Depicting Shape and Color Atom Overlaps
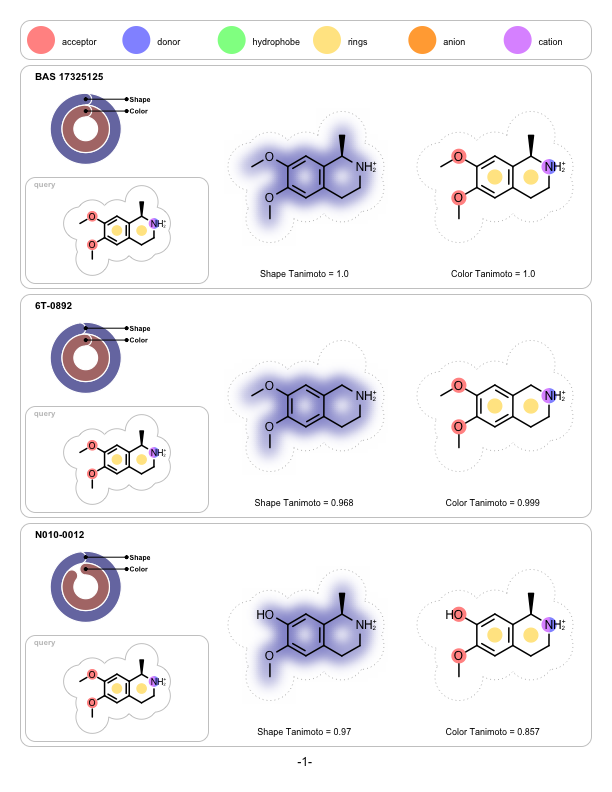
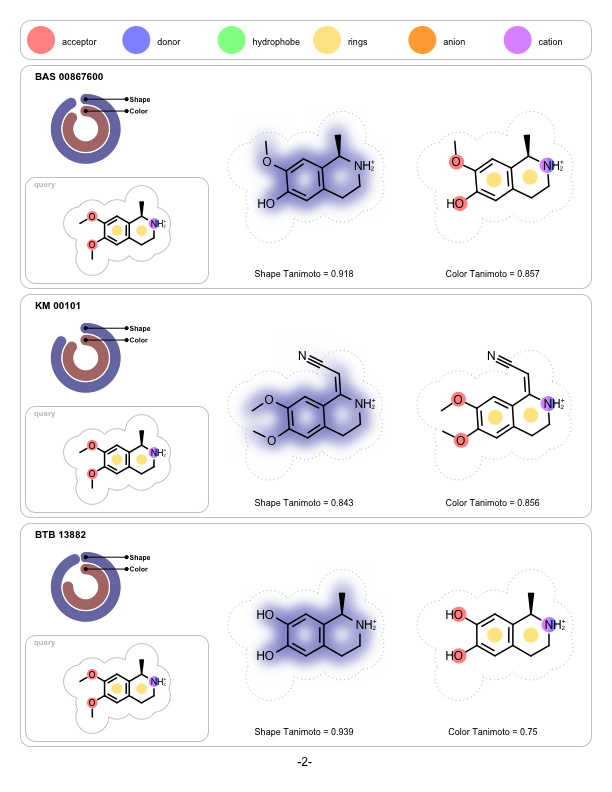
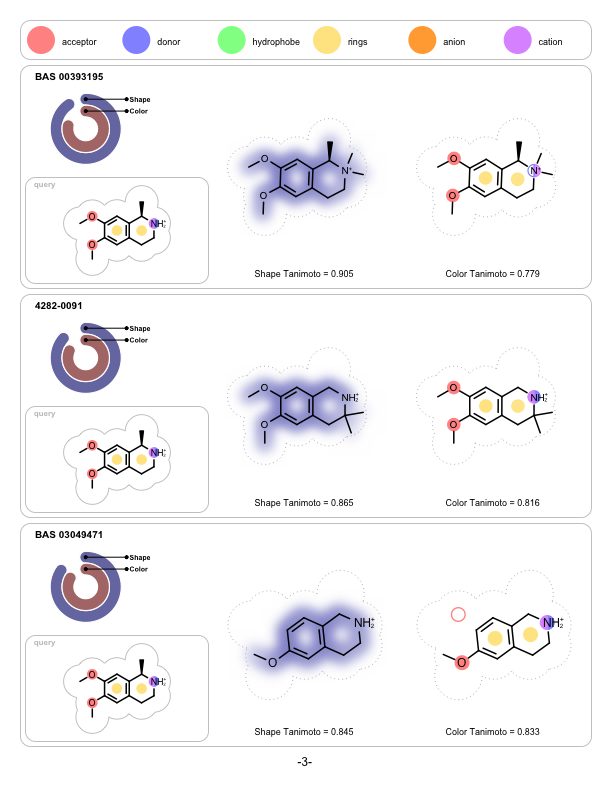
A program that depicts the shape and the color overlap between a 3D reference structure and a sets of pre-aligned 3D fit molecules. It is implemented to visualize the output of ROCS but can be used to visualize the shape and color similarities of any molecules that have been pre-aligned with other applications.
Note
OEShape TK license is not required to run this example.
Command Line Interface
A description of the command line interface can be obtained by executing the program with the –help argument.
prompt> ShapeOverlap2PDF --help
will generate the following output:
[-in] <input> [-out] <output pdf>

 Simple parameter list
     input/output options:
       -in : Input molecule filename
       -out : Output image filename

     general options:
       -maxhits : Maximum number of hits depicted
Code
Download code
See also
OEColorForceField class in the OEShape TK
OEShapeQueryDisplay and OEShapeQueryDisplayOptions classes
OERenderShapeQueryfunctionOEShapeOverlapDisplay, OEShapeOverlapDisplayOptions, and OEColorOverlapDisplayOptions classesOERenderShapeOverlapfunctionOERenderColorOverlapfunctionOEDrawColorForceFieldLegendfunctionOEDrawROCSScoresfunction