Short Trajectory MD with Analysis for Non-Equilibrium Switching
In this tutorial, we will follow the new protocol (Figure New Protocol of the MD Stage in Lead Optimization) of the MD stage in the structure-based lead optimization funnel, by running the series of three Floes: (1) STMD, (2)*Edge Mapper for RBFE calculations*, and (3)NES, with the four selected ligands of the Tyk2 receptor.
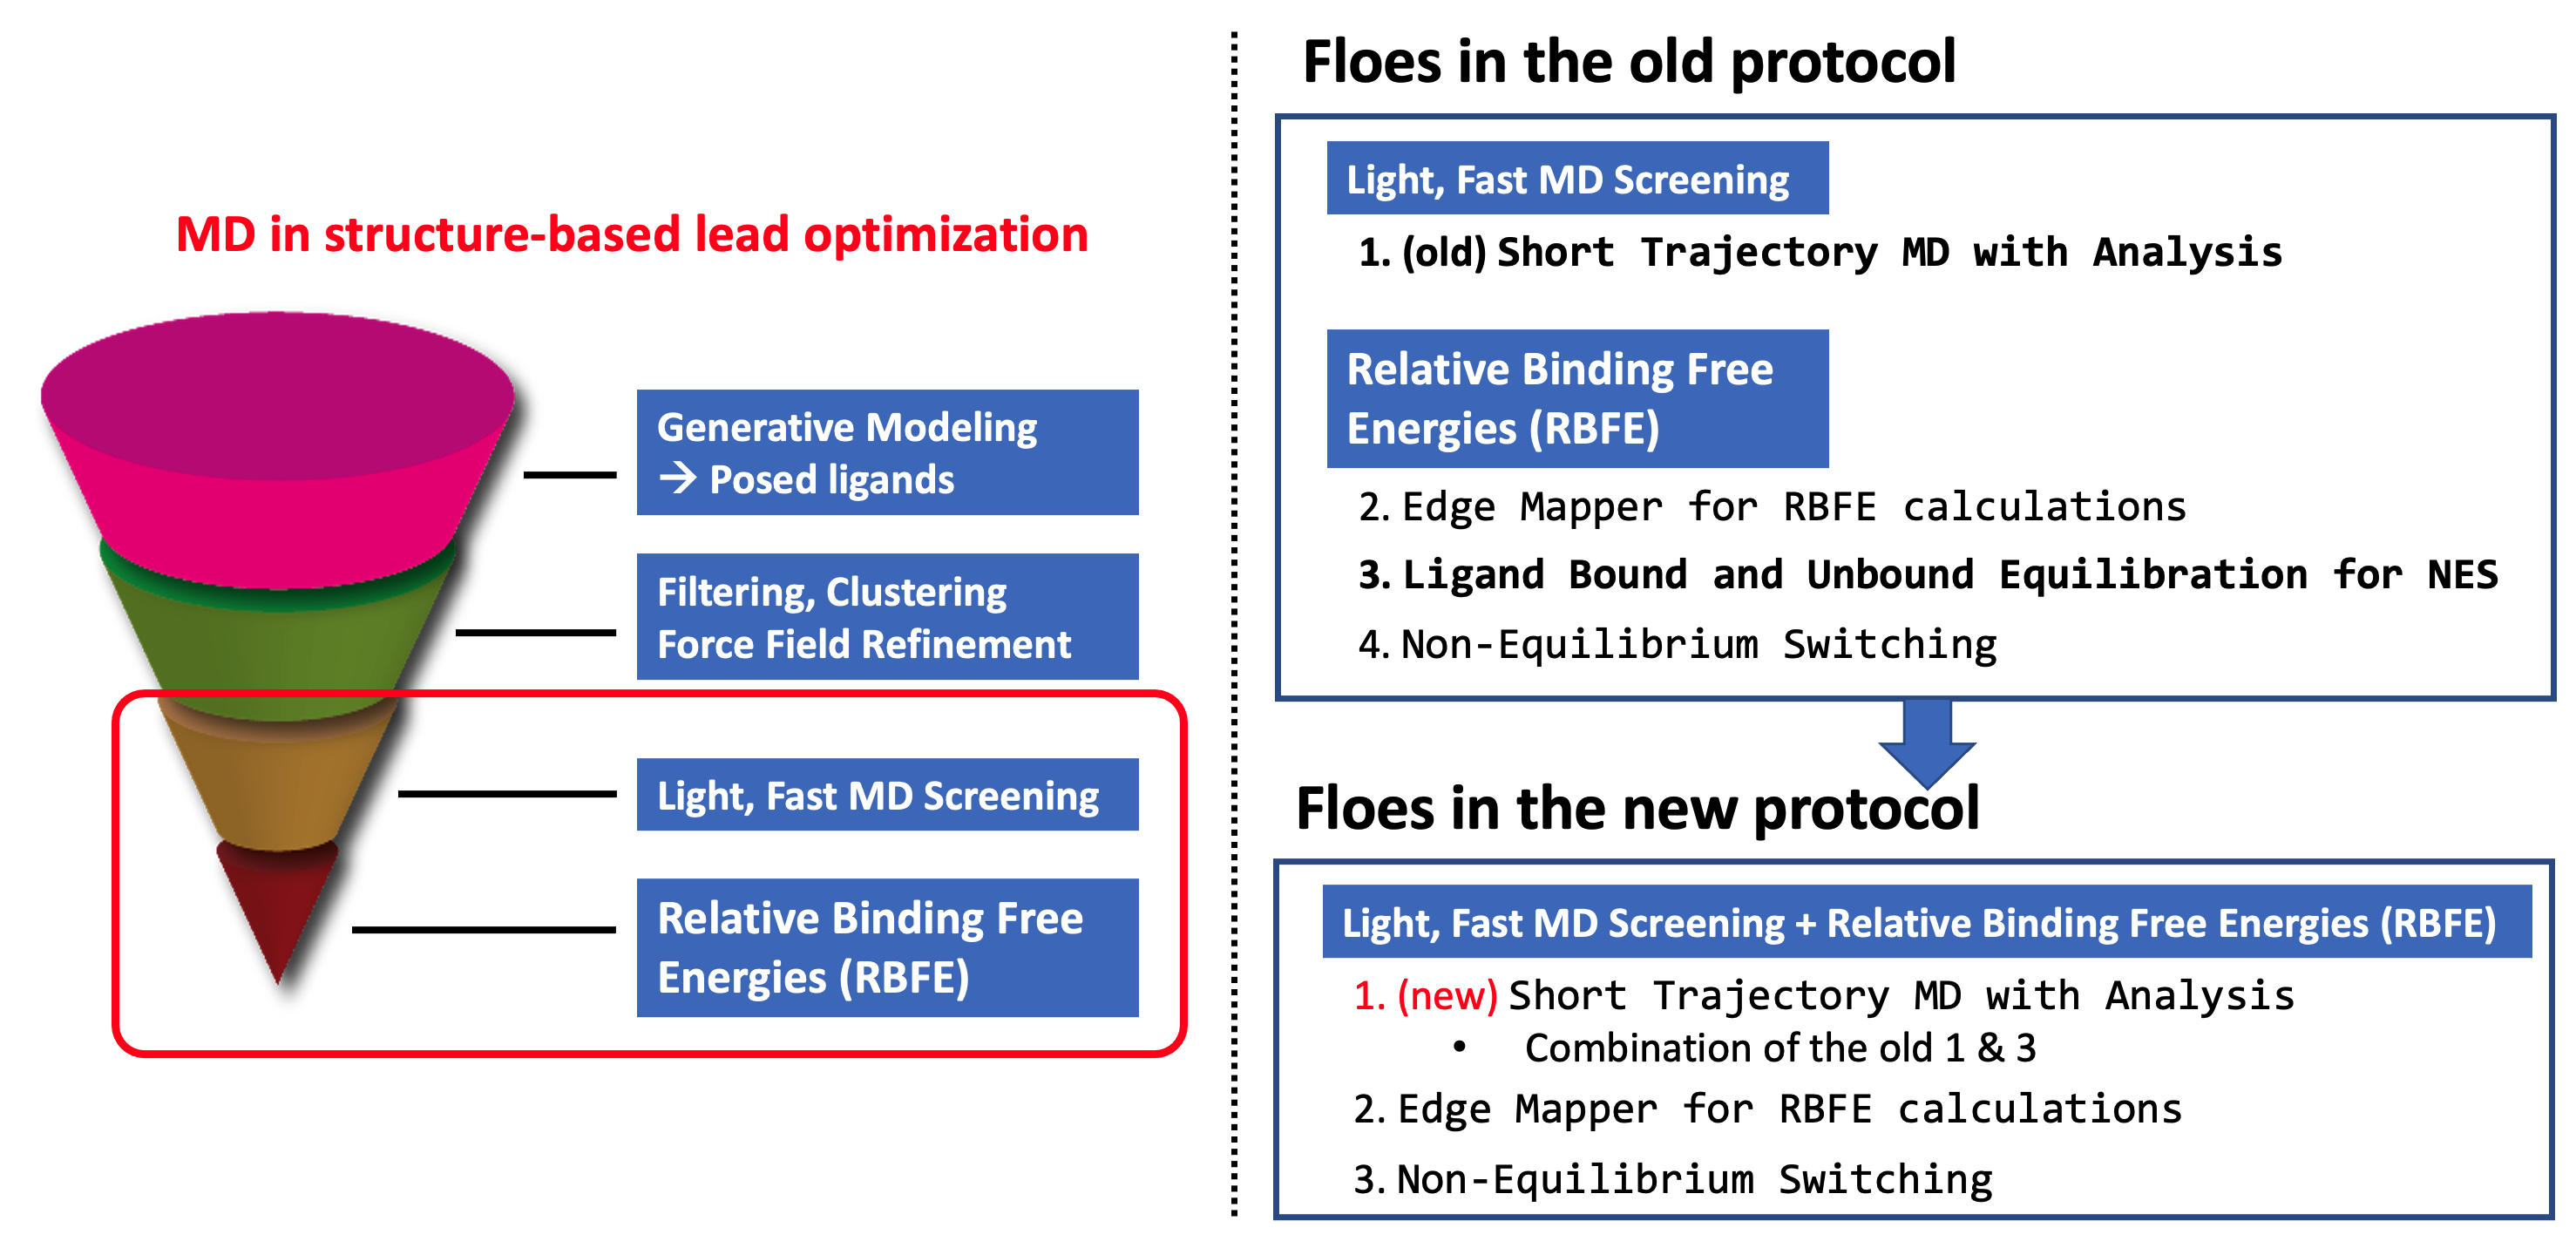
New Protocol of the MD Stage in Lead Optimization
1. Running Short Trajectory MD with Analysis
For more detailed information on how to run the STMD Floe, please refer to STMD: How-To Guide.
Running Floe
After selecting the Short Trajectory MD with Analysis Floe in the Orion UI, you will be presented with a job form with parameters to select. In this tutorial, we keep the default parameter values. For more informations about the top-parameters, please refer to How to Run This Floe in the how-to guide. Specify Protein Input Dataset and Ligand Input Dataset. Then we suggest to modify the output dataset names, so that you can recognise your data later. Here the prefix Tyk2_4ligs_ is added to the default output dataset names.
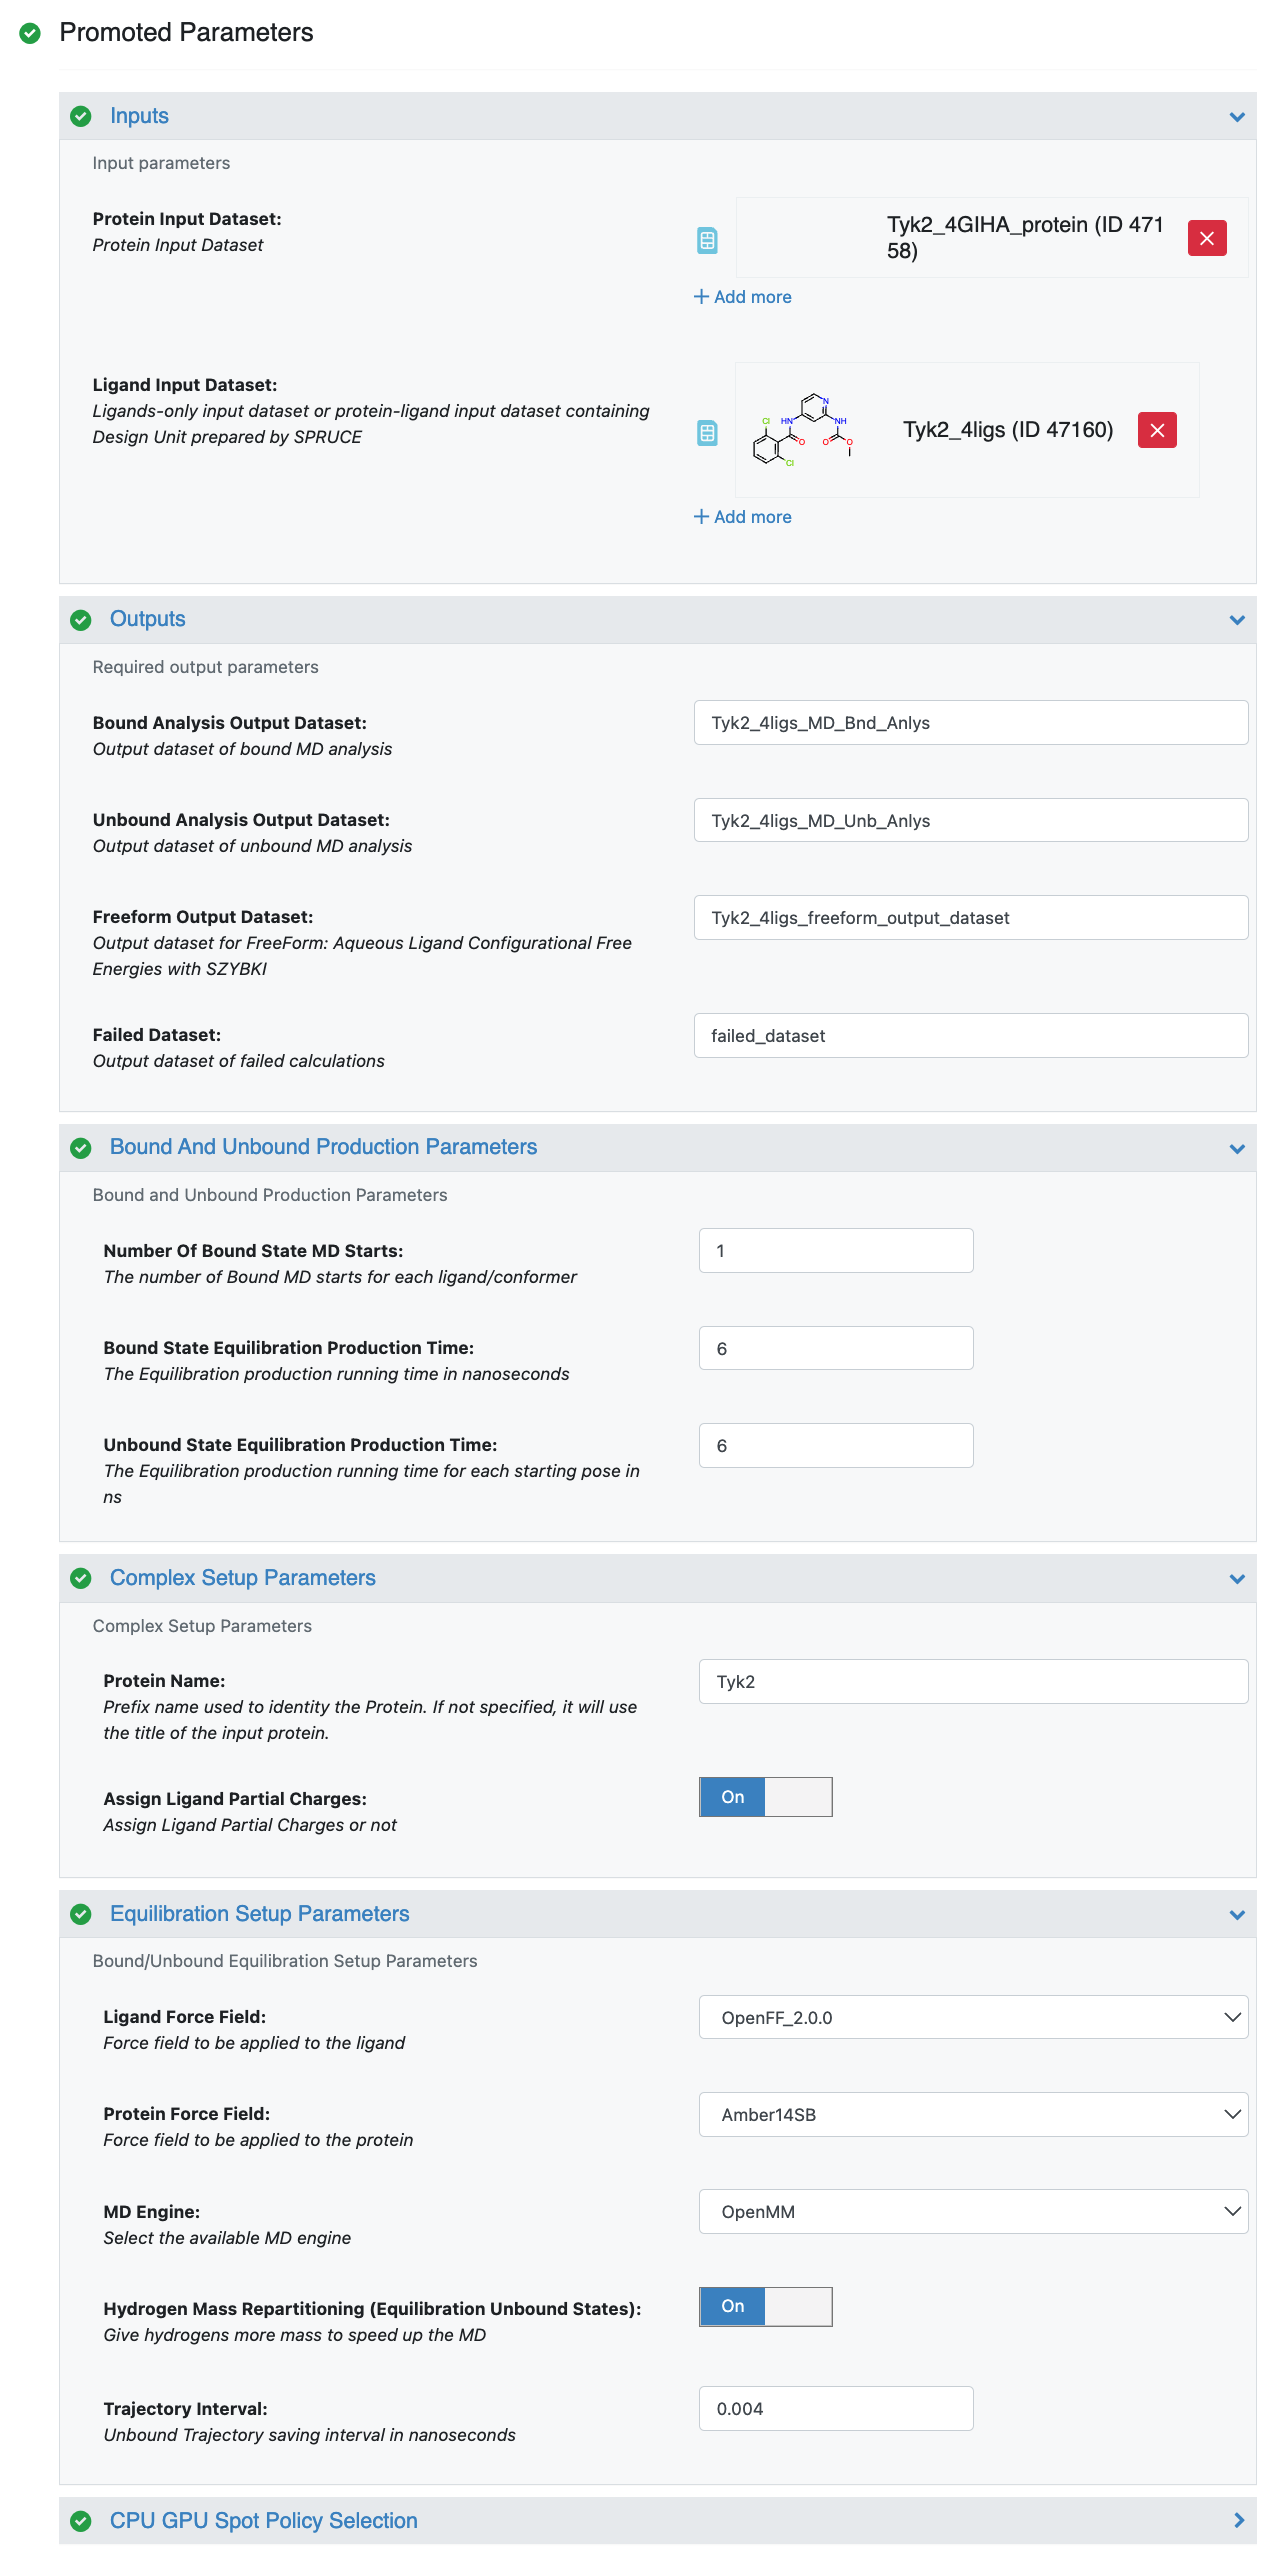
Tyk2 4ligs STMD Job Form
We are all set to go. Let’s hit the Start Job button!
Understanding Results and Output Datasets
The results from the STMD Floe are accessed via two main avenues: through the job output in the Jobs tab on Orion’s Floe page, and through Orion’s Analyze page. In the Jobs tab on Orion’s Floe page, having selected the job name for your STMD job, you should land on the job results page. On the results page, The left panel contains the usual Orion job information from the run, and the right panel has two tabs at the top once the job has been completed successfully. Selecting the second tab called FLOE REPORT should give you a page looking similar to Figure Tyk2 4ligs STMD Floe Report.
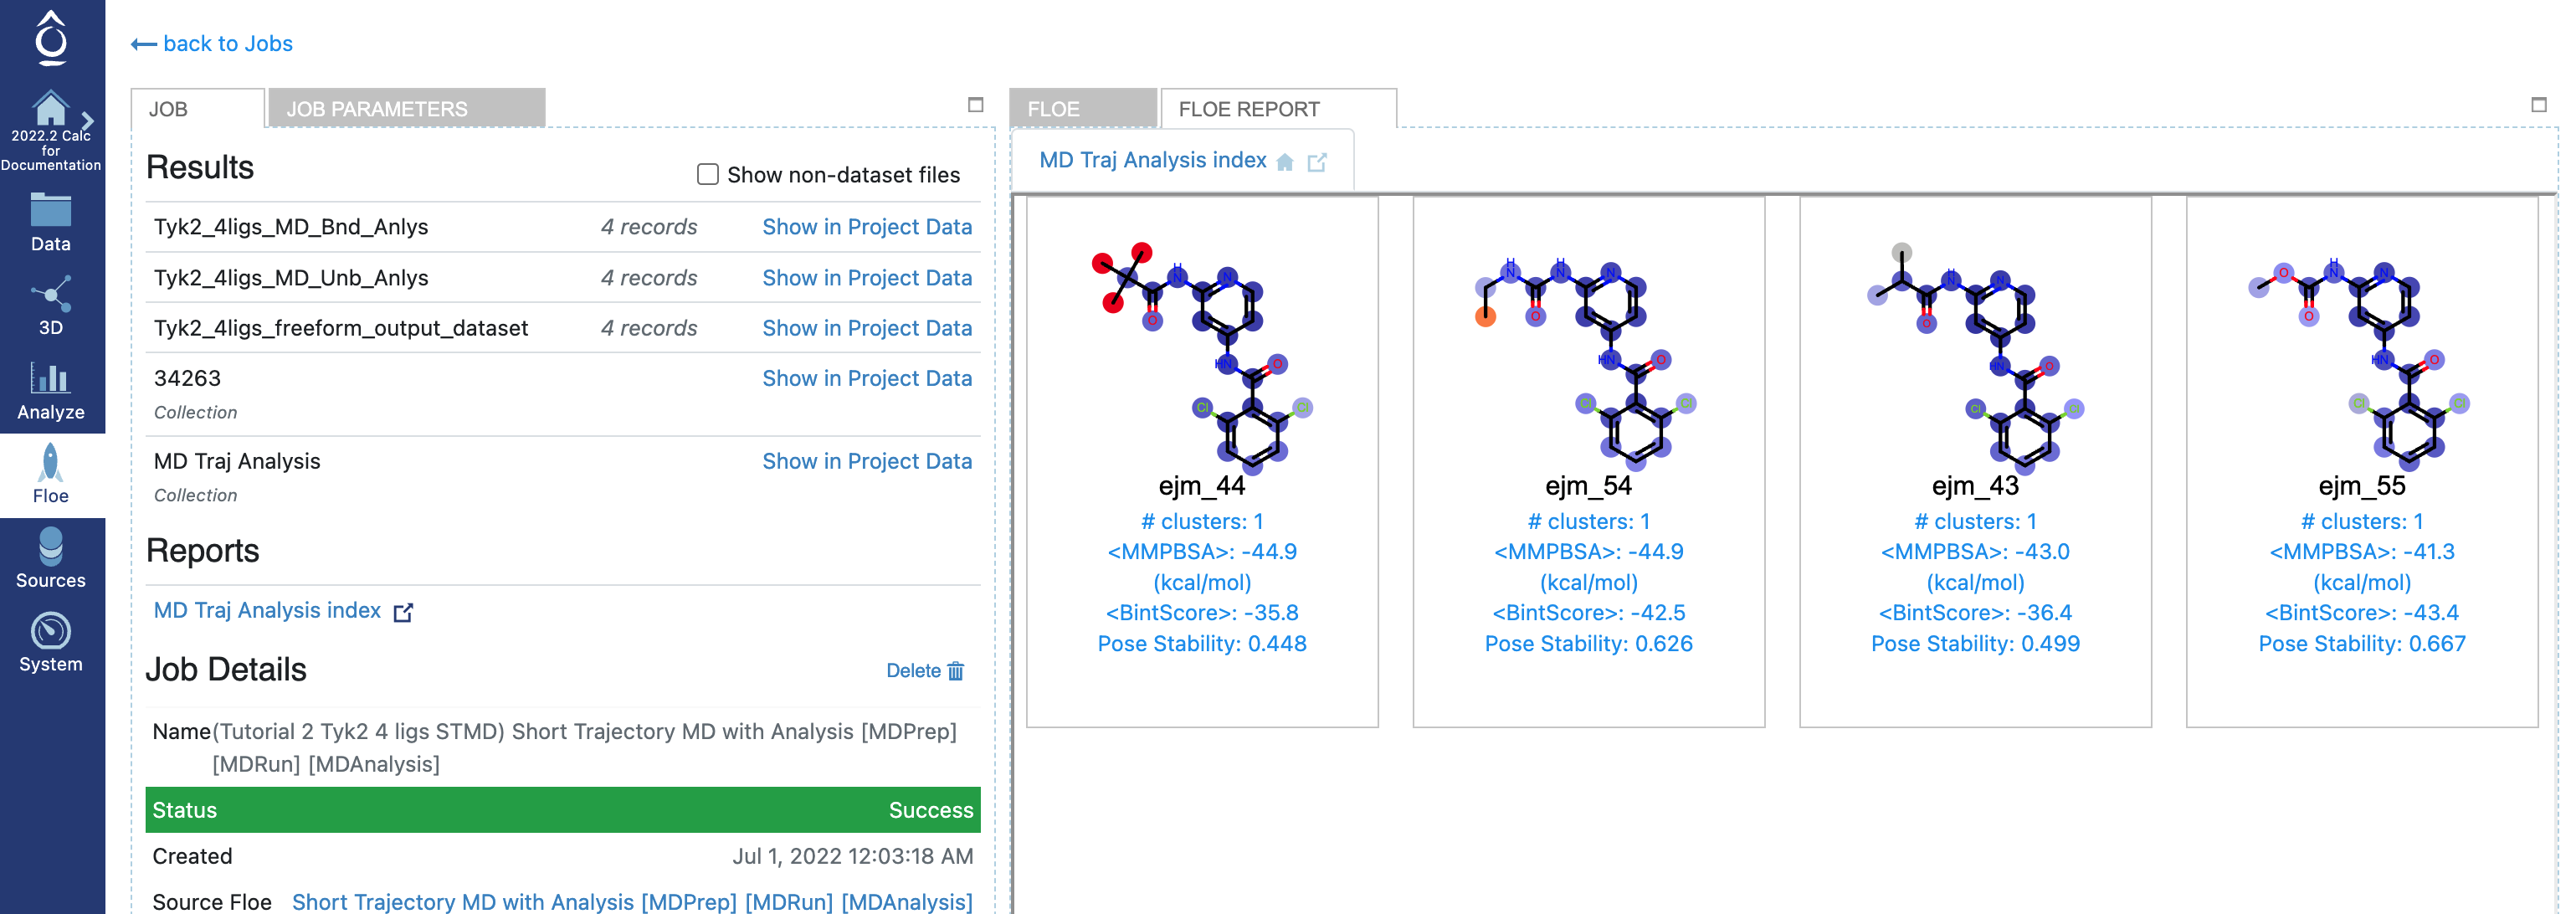
Tyk2 4ligs STMD Floe Report
Along with the Floe report, three datasets are written: Freeform output dataset (Tyk2_4ligs_freeform_output_dataset) and unbound/bound MD analysis dataset (Tyk2_4ligs_MD_Bnd_Anlys, Tyk2_4ligs_MD_Unb_Anlys). The last two analysis datasets will be used as bound/unbound input datasets of nonequilibrium switching Floes later in this tutorial.
2. Running Edge Mapper for RBFE calculations
For more detailed information on how to run the Edge Mapper for RBFE calculations Floe, please refer to Edge Mapper for RBFE calculations tutorial.
Floe Inputs
The required input for the Floe can take either (1) an Orion dataset of posed ligands , (2) Bound MD Output Dataset from Ligand Bound and Unbound Equilibration for NES or (3) Bound Analysis Output Dataset from STMD.
Optionally, the user can also import the externally or manually generated edge map. In this case, the Floe will generate a mapper output dataset simply with the edges from the input edge map. The user-provided map must be a text file containing one edge per line in the following format:
ligA >> ligB
The first field is the title of the starting ligand, followed by “>>”, and the third field is the title of the final ligand. With the above example line, the mapper will look in the input ligand dataset for a ligand titled “ligA” and another titled “ligB” and it will generate an edge record in the mapper output dataset defining the transformation of LigA into LigB.
In this tutorial, we will use the custom edge map, which connects all the ligands in the posed ligand dataset (Tyk2_4ligs.oeb).
Running Floe
After selecting the Edge Mapper for RBFE calculations Floe in the Orion UI, you will be presented with a job form with parameters to select. After specifying Ligand Or Bound Equilibrium Dataset and Ligand Edge Map File, your job form will look like the Figure Tyk2 4ligs Edge Mapper Job Form.
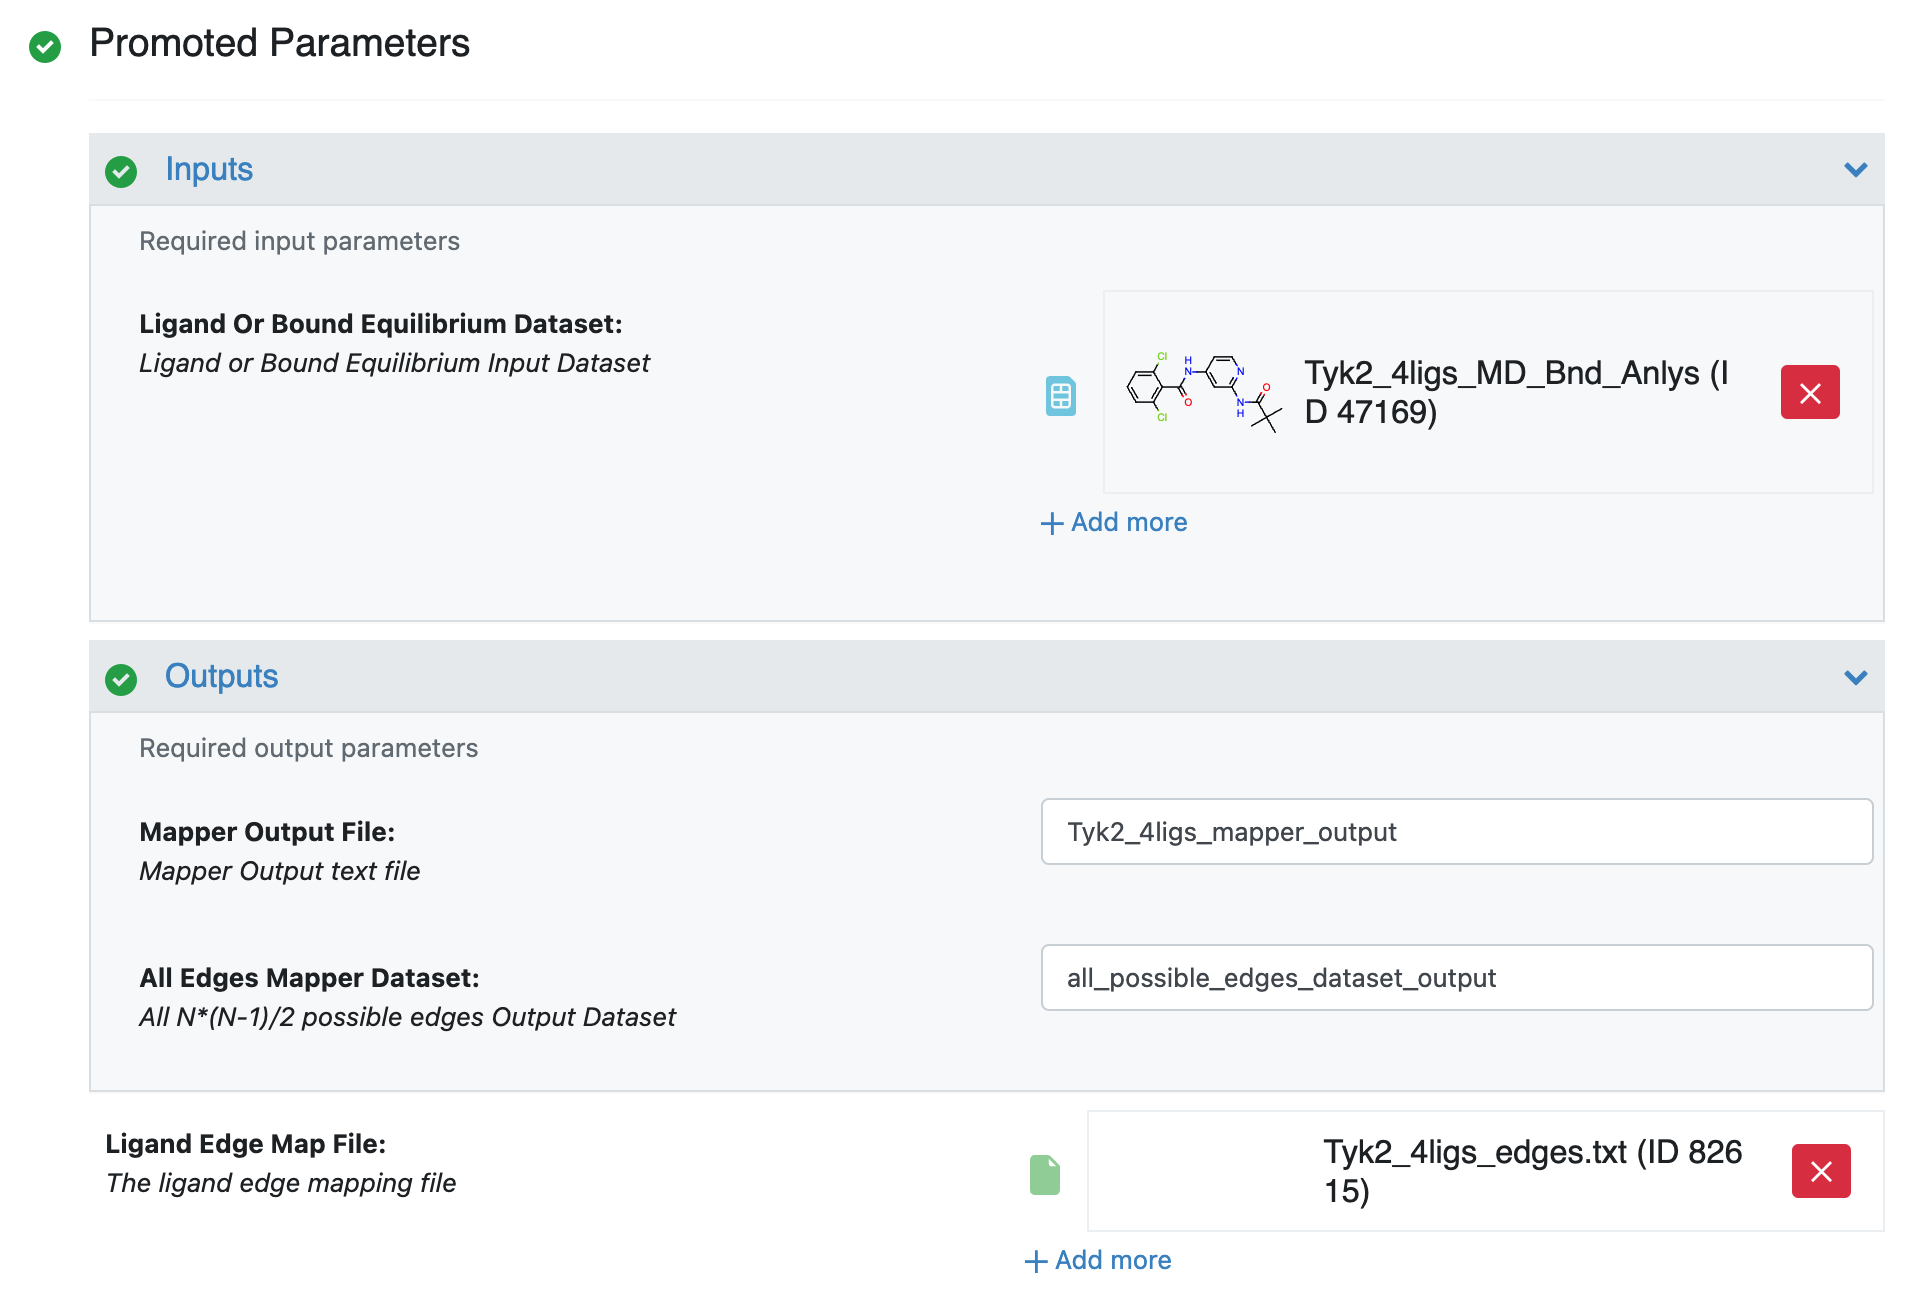
Tyk2 4ligs Edge Mapper Job Form
We are all set to go. Let’s hit the Start Job button!
Understanding Results and Output Datasets
Once the job is completed, you will be able to find the two output datasets under the Output path you specified in the job form: Tyk2_4ligs_mapper_output and all_possible_edges_dataset_output. With the Tyk2_4ligs_mapper_output dataset, now we are ready to run the final Floe for the free energy calculations.
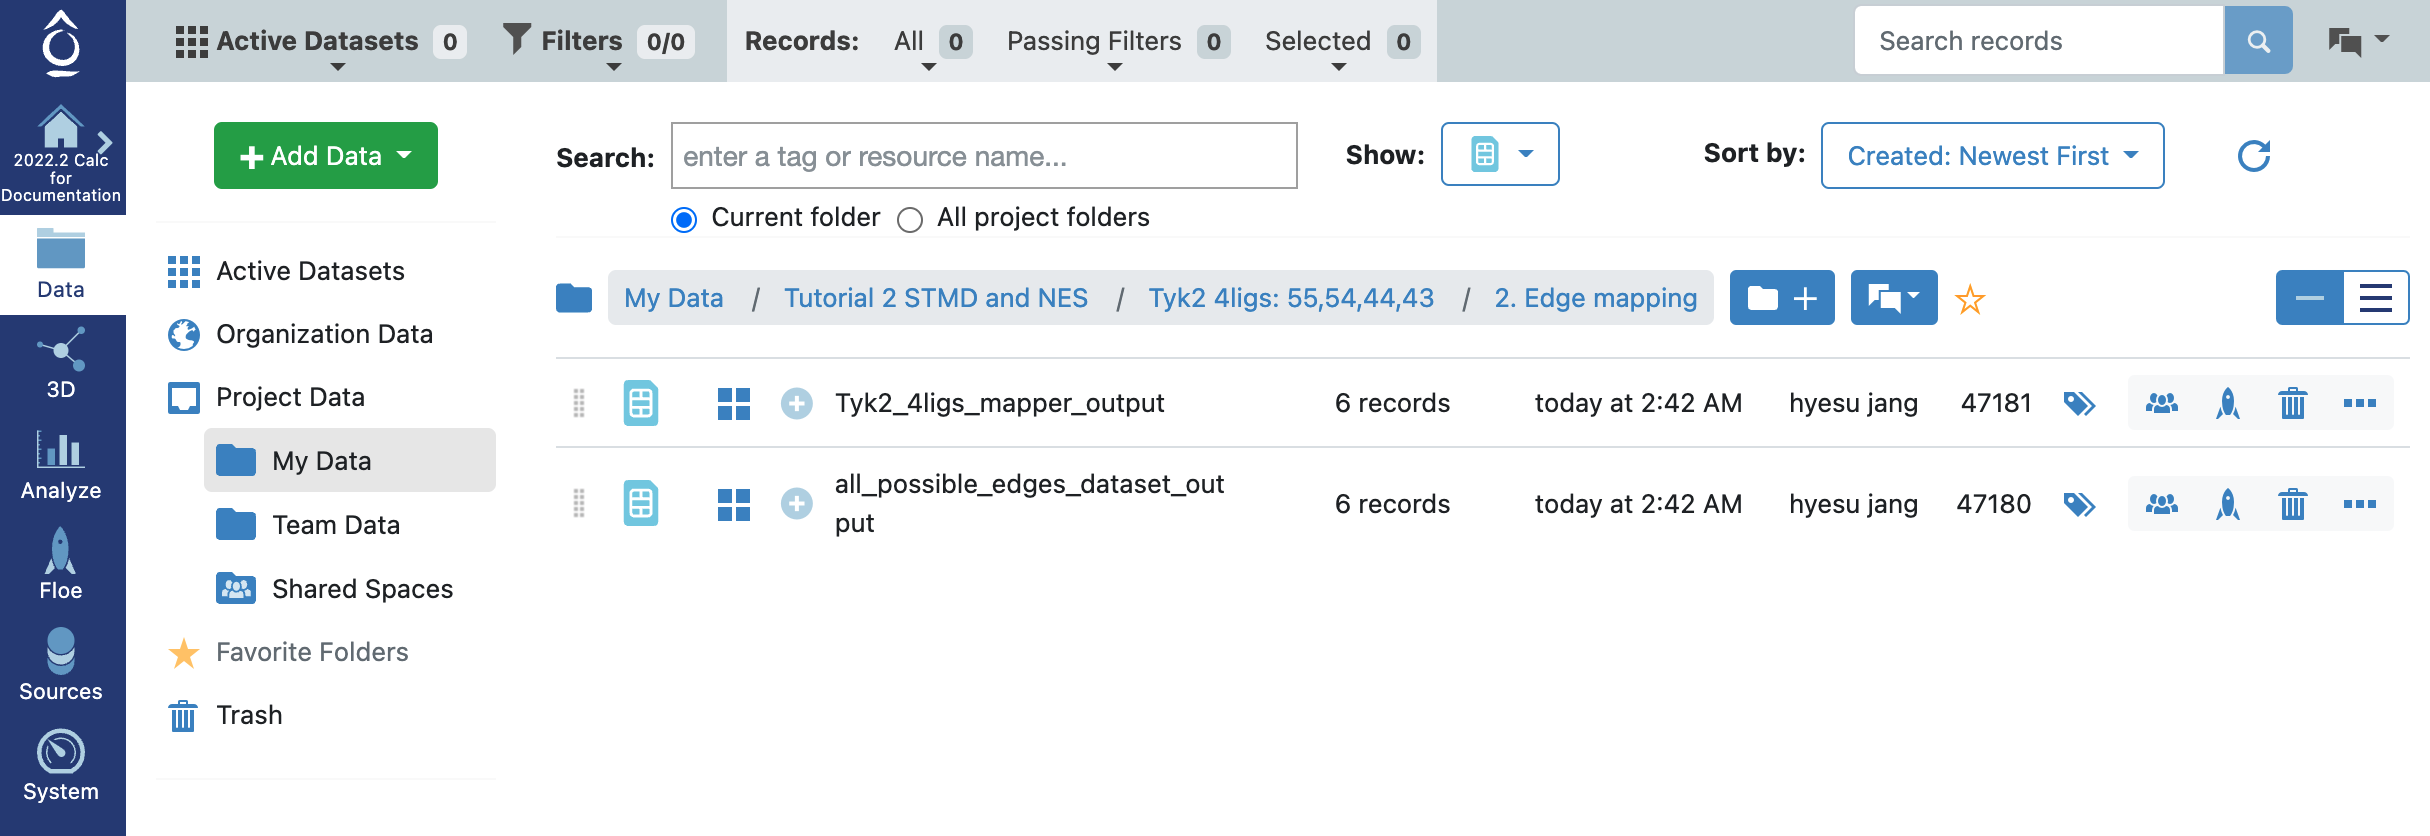
Tyk2 4ligs Edge Mapper Outputs
3. Running NES
For more detailed information on how to run the Nonequilibrium Switching Floe, please refer to Nonequilibrium switching tutorial.
Floe Inputs
From the STMD Floe, we got MD_Bnd_Anlys and MD_Unb_Anlys. And From the Edge Mapper Floe, we got Tyk2_4ligs_mapper_output. Those are the key ingredients for the NES Floe.
In addition to the collected input datasets, optionally, we can provide a file containing the experimental ligand affinities for the comparison between experimental and calculated affinities:
Running Floe
After selecting the Non-Equilibrium Switching Floe in the Orion UI, you will be presented with a job form with parameters to select. we keep the default parameter values. For more informations about the top-parameters, please refer to Nonequilibrium switching tutorial. Specify the inputs and the Ligand Affinity Experimental File.
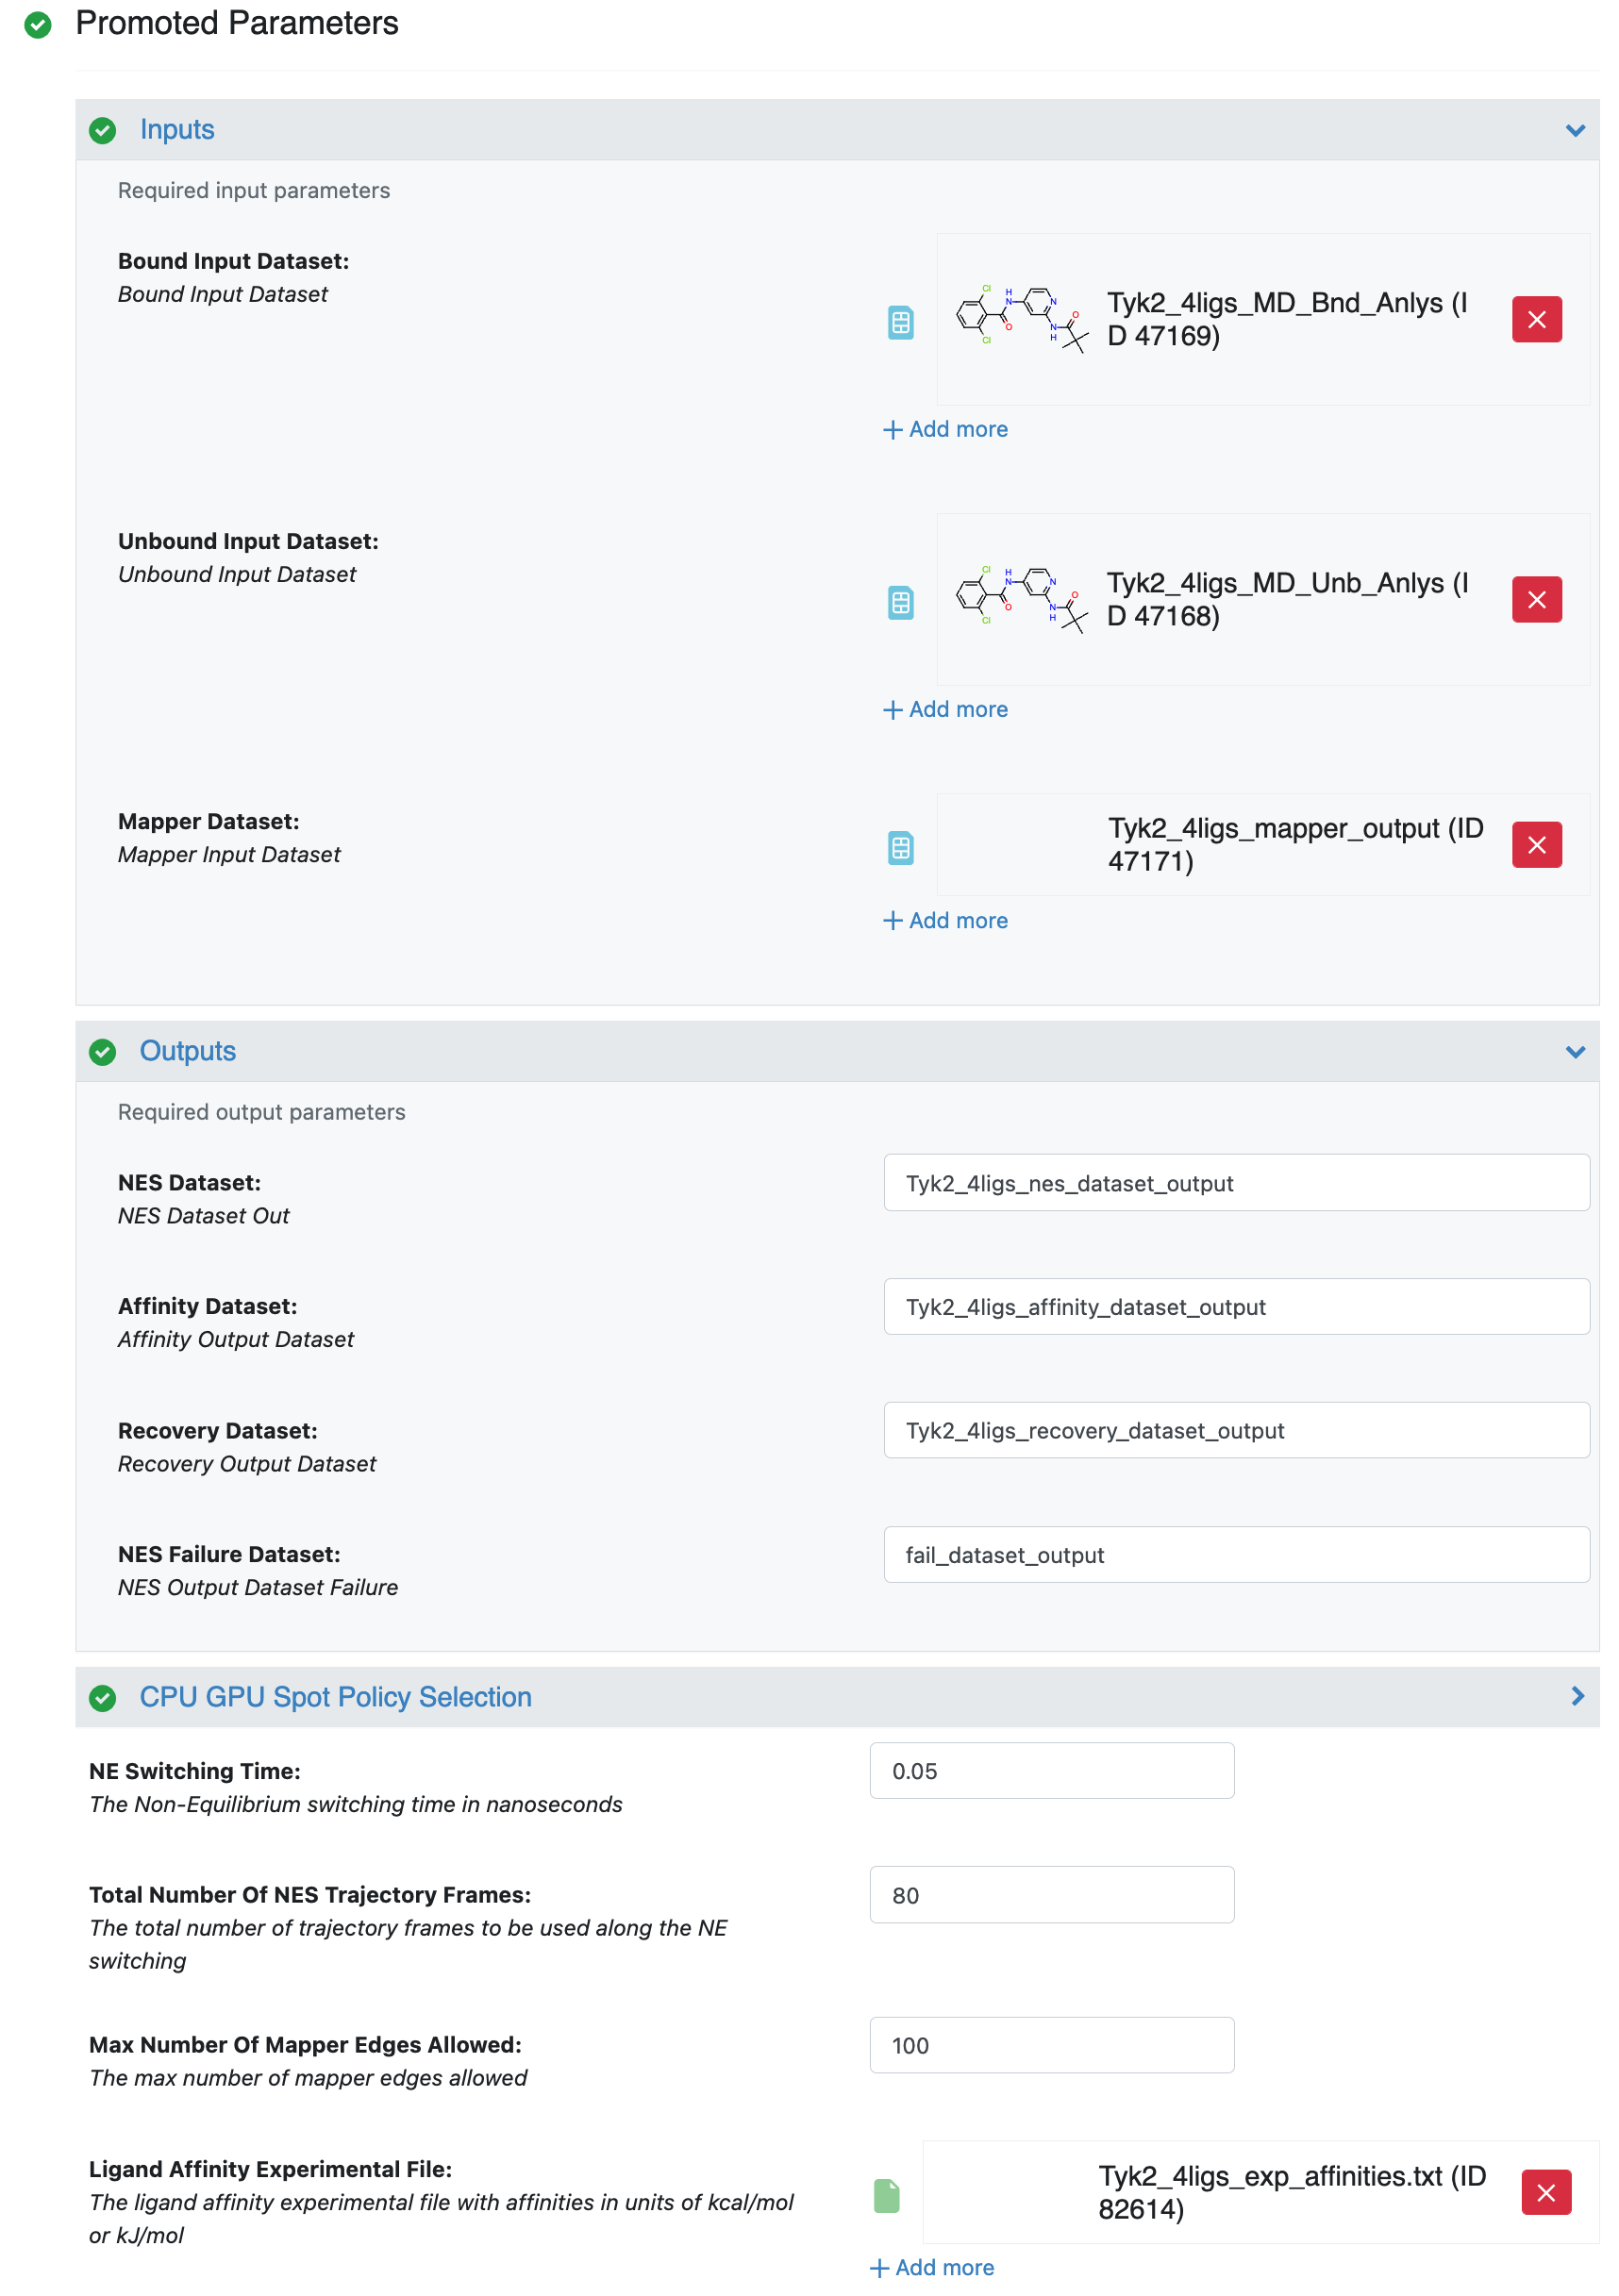
NES Job Form
We are all set to go. Let’s hit the Start Job button!
Understanding Results and Output Datasets
In the Jobs tab on Orion’s Floe page, having selected the job name for your NES job, you should land on the job results page. On the results page, The left panel contains the usual Orion job information from the run, and the right panel has two tabs at the top once the job has been completed successfully. Selecting the second tab called FLOE REPORT should give you a page looking similar to Figure Tyk2 4ligs NES Floe Report.
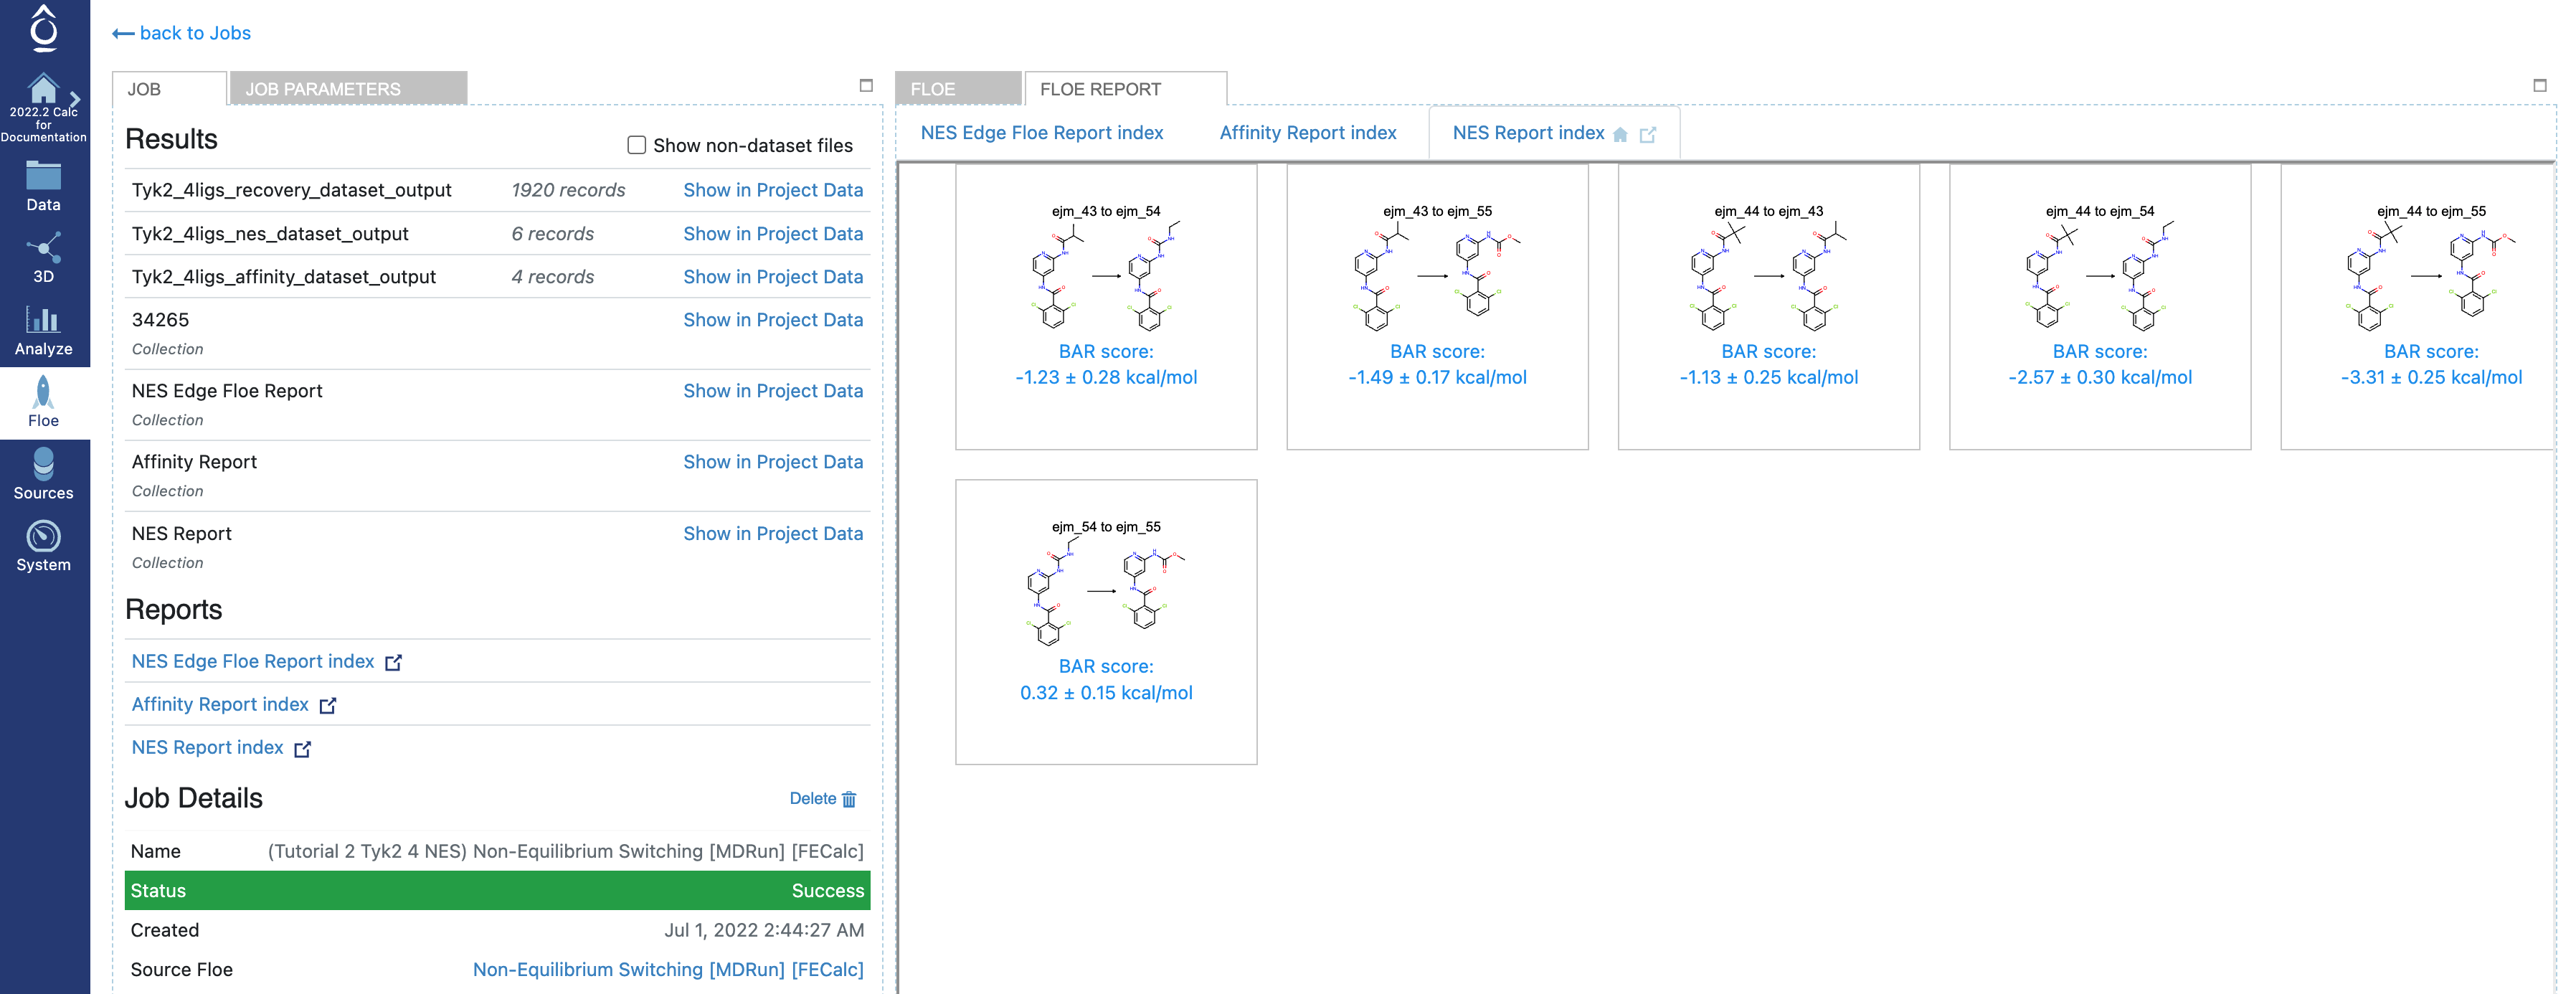
Tyk2 4ligs NES Floe Report
From the Floe report page, you will be able to find the three Floe reports: NES Report index, NES Edge Floe Report index, and Affinity Report index.
Under the NES Report index tab, you will see the tiles, where each tile shows the edge and the predicted RBFE by using the Bennet Acceptance Ratio method for NES.
If you click the NES Edge Floe Report index tab, you will see the page looking similar to Figure The Interactive NES Edge Floe Report.
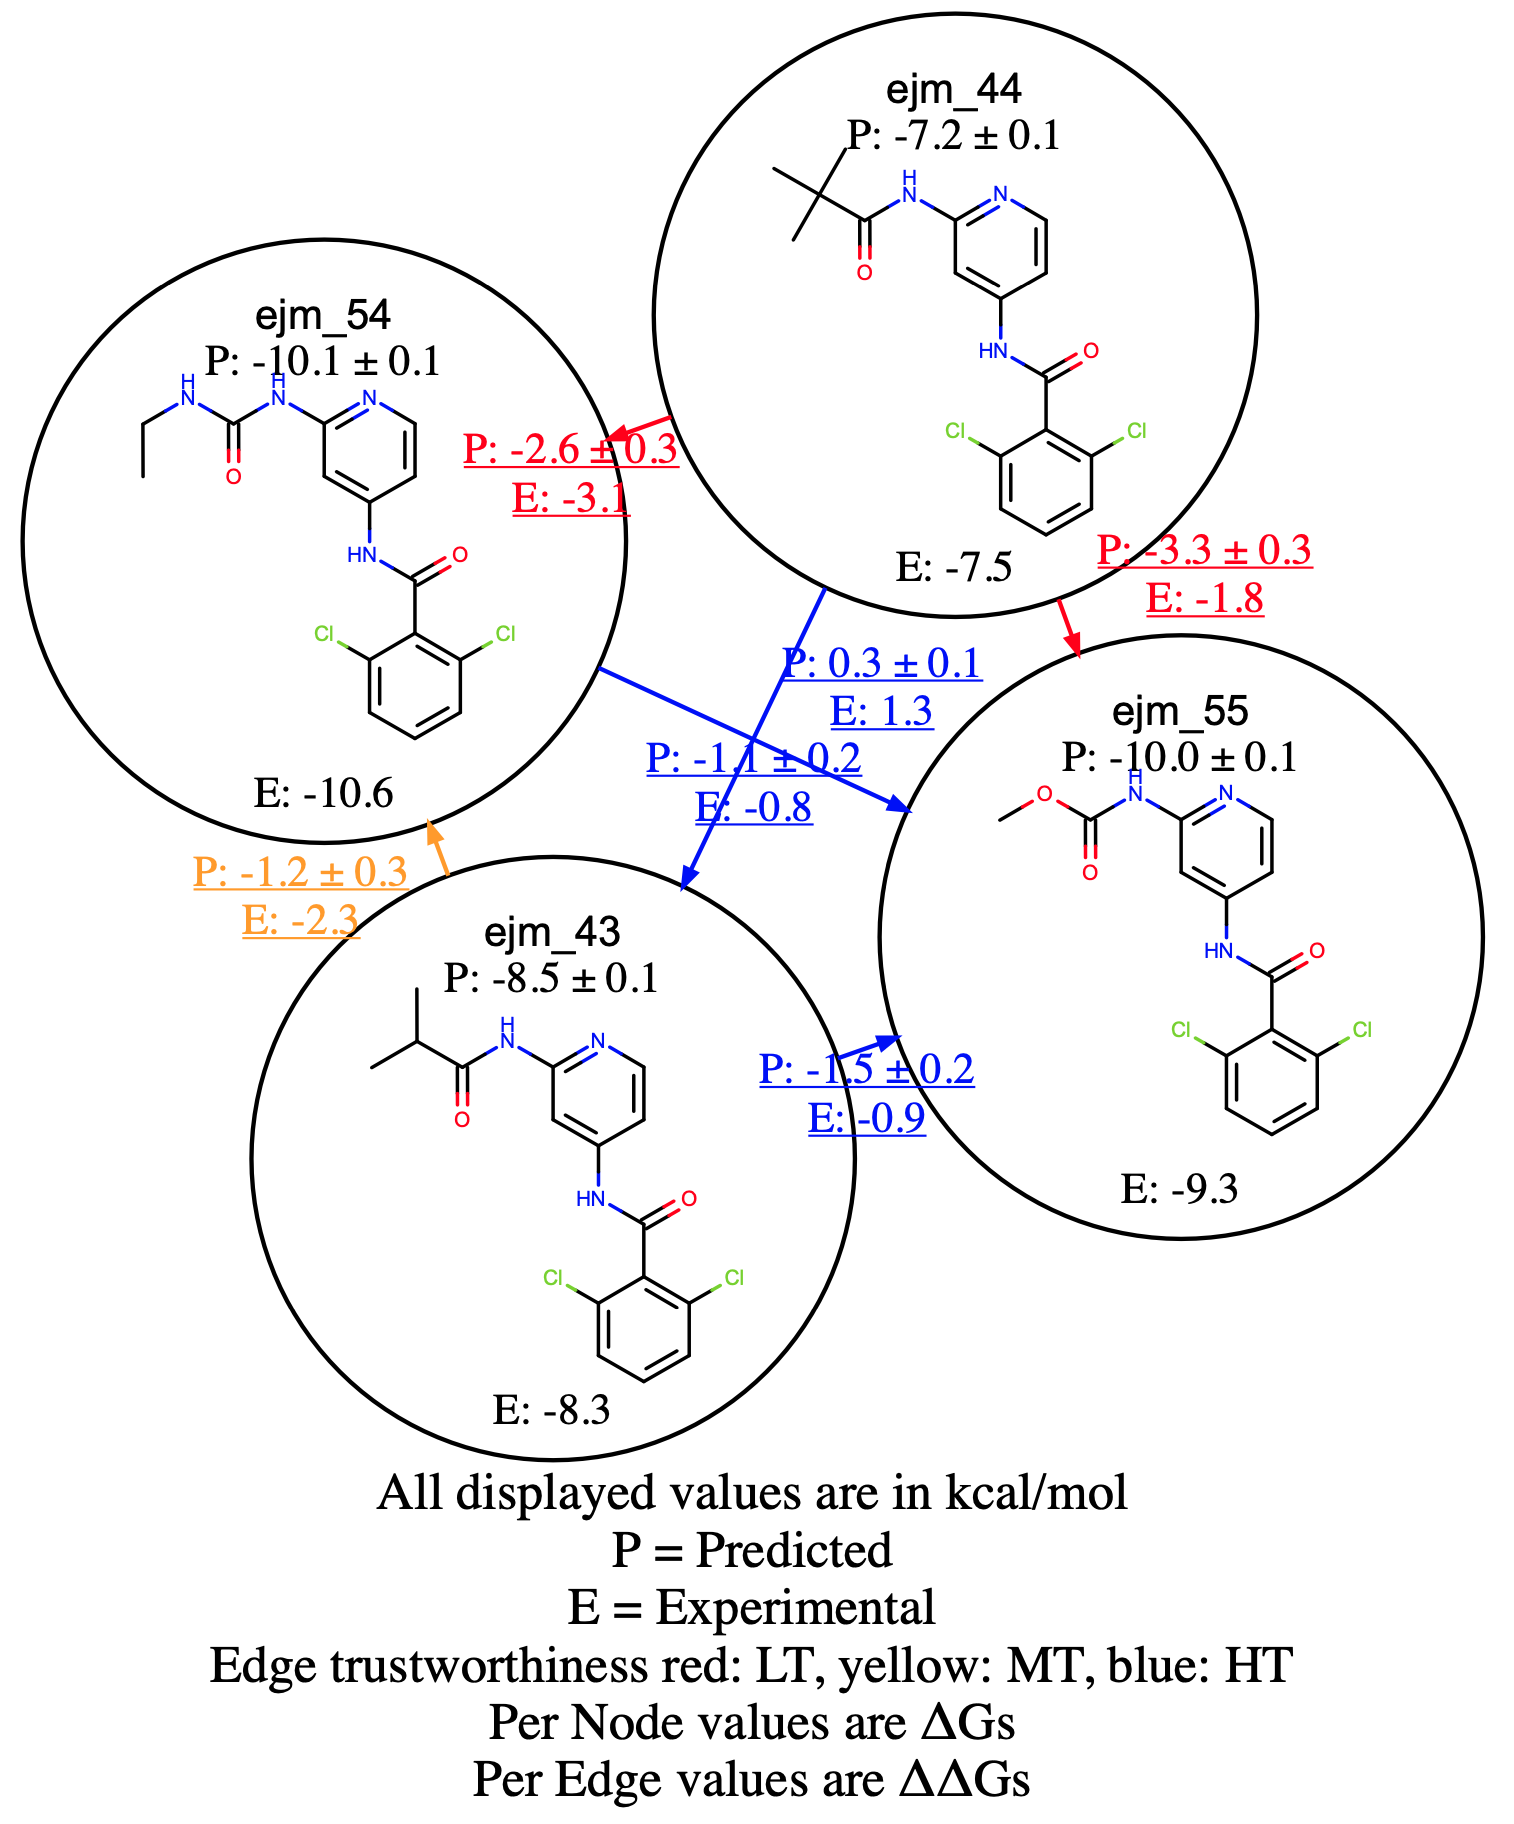
The Interactive NES Edge Floe Report
Among the six edges connecting the four Tyk2 ligands, there are two bad edges and one mediocre edge. The Edge Floe report is interactive, For the detailed information of each edge, you can click and it will link to the individual edge report. For example, the detailed calculation information of the edge connecting the ligands ejm_44 and ejm_54, click the edge from the Edge Floe report, and it will link to the page looking similar to the Figure A bad RBFE Calculation, where you can check the poor forward and reverse work distribution overlaps for both bound and unbound, which indicates that the results are likely incorrect.
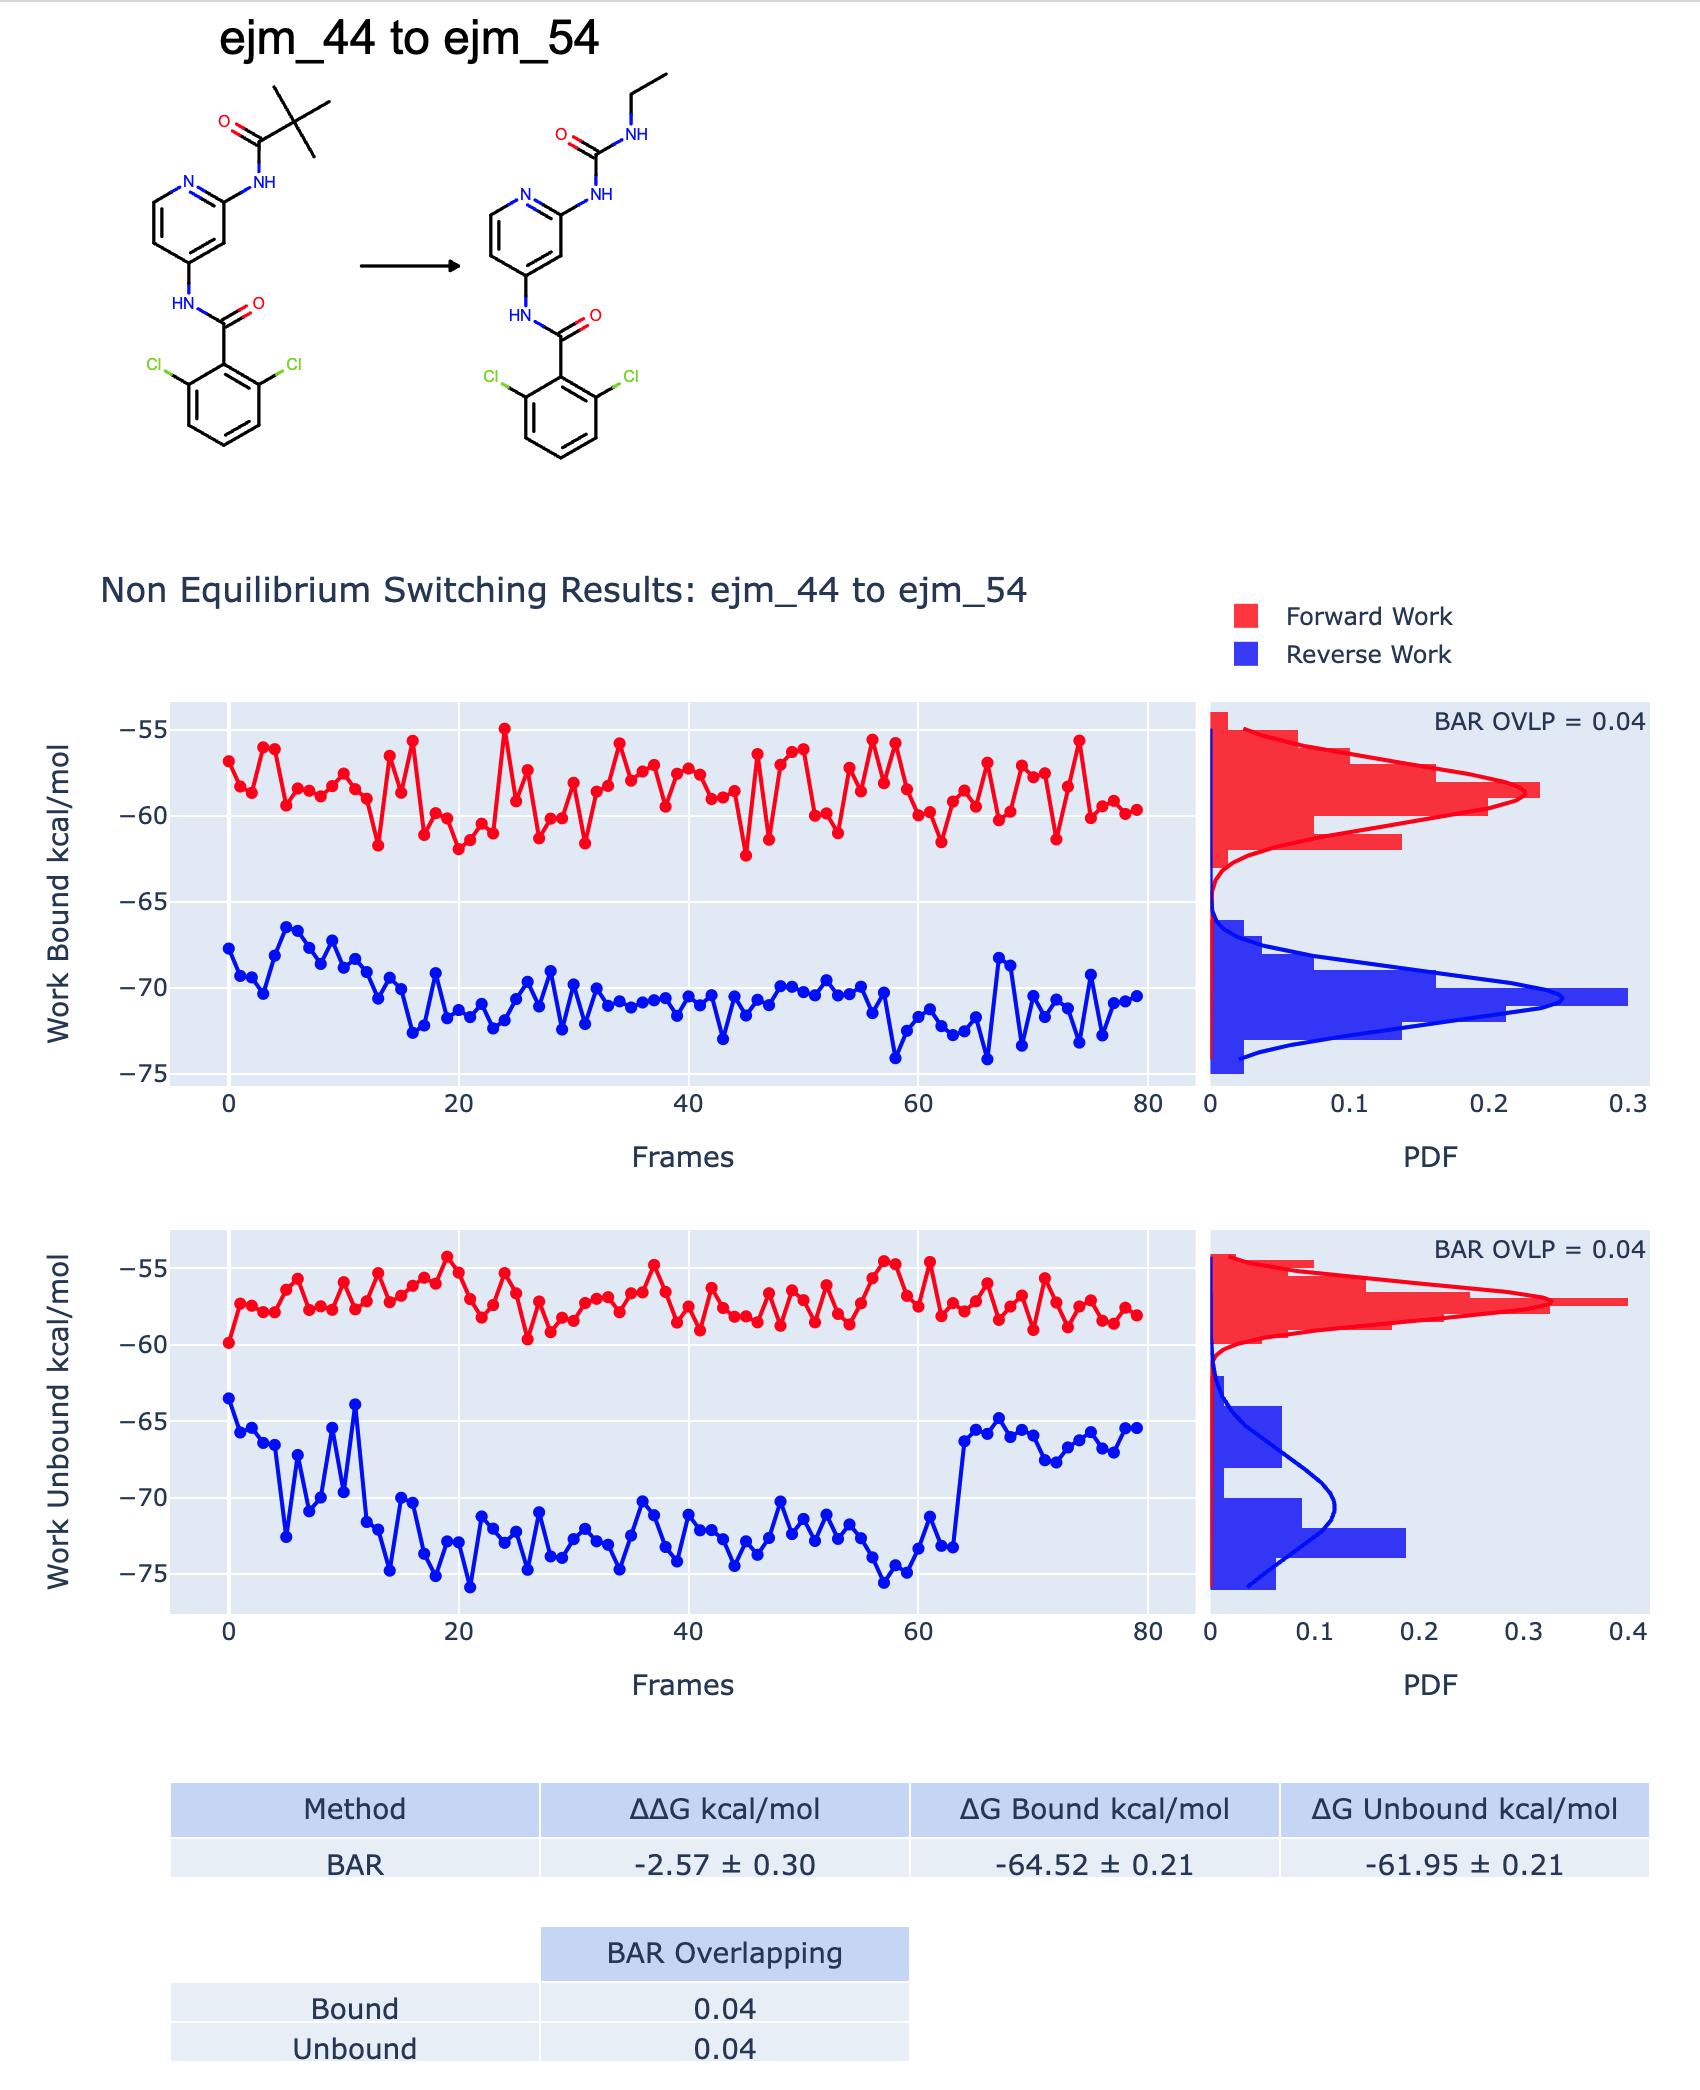
A bad RBFE Calculation
Under the Affinity Report index tab, you can find the affinity report, which shows two main sections. In the first section, experimental and predicted affinities are compared. Here, a graph between \(\Delta G_{Experimental}\) vs \(\Delta G_{Predicted}\) is shown. This graph is available if the experimental affinity file has been provided and the ligand edge map is connected enough to be able to make affinity predictions.
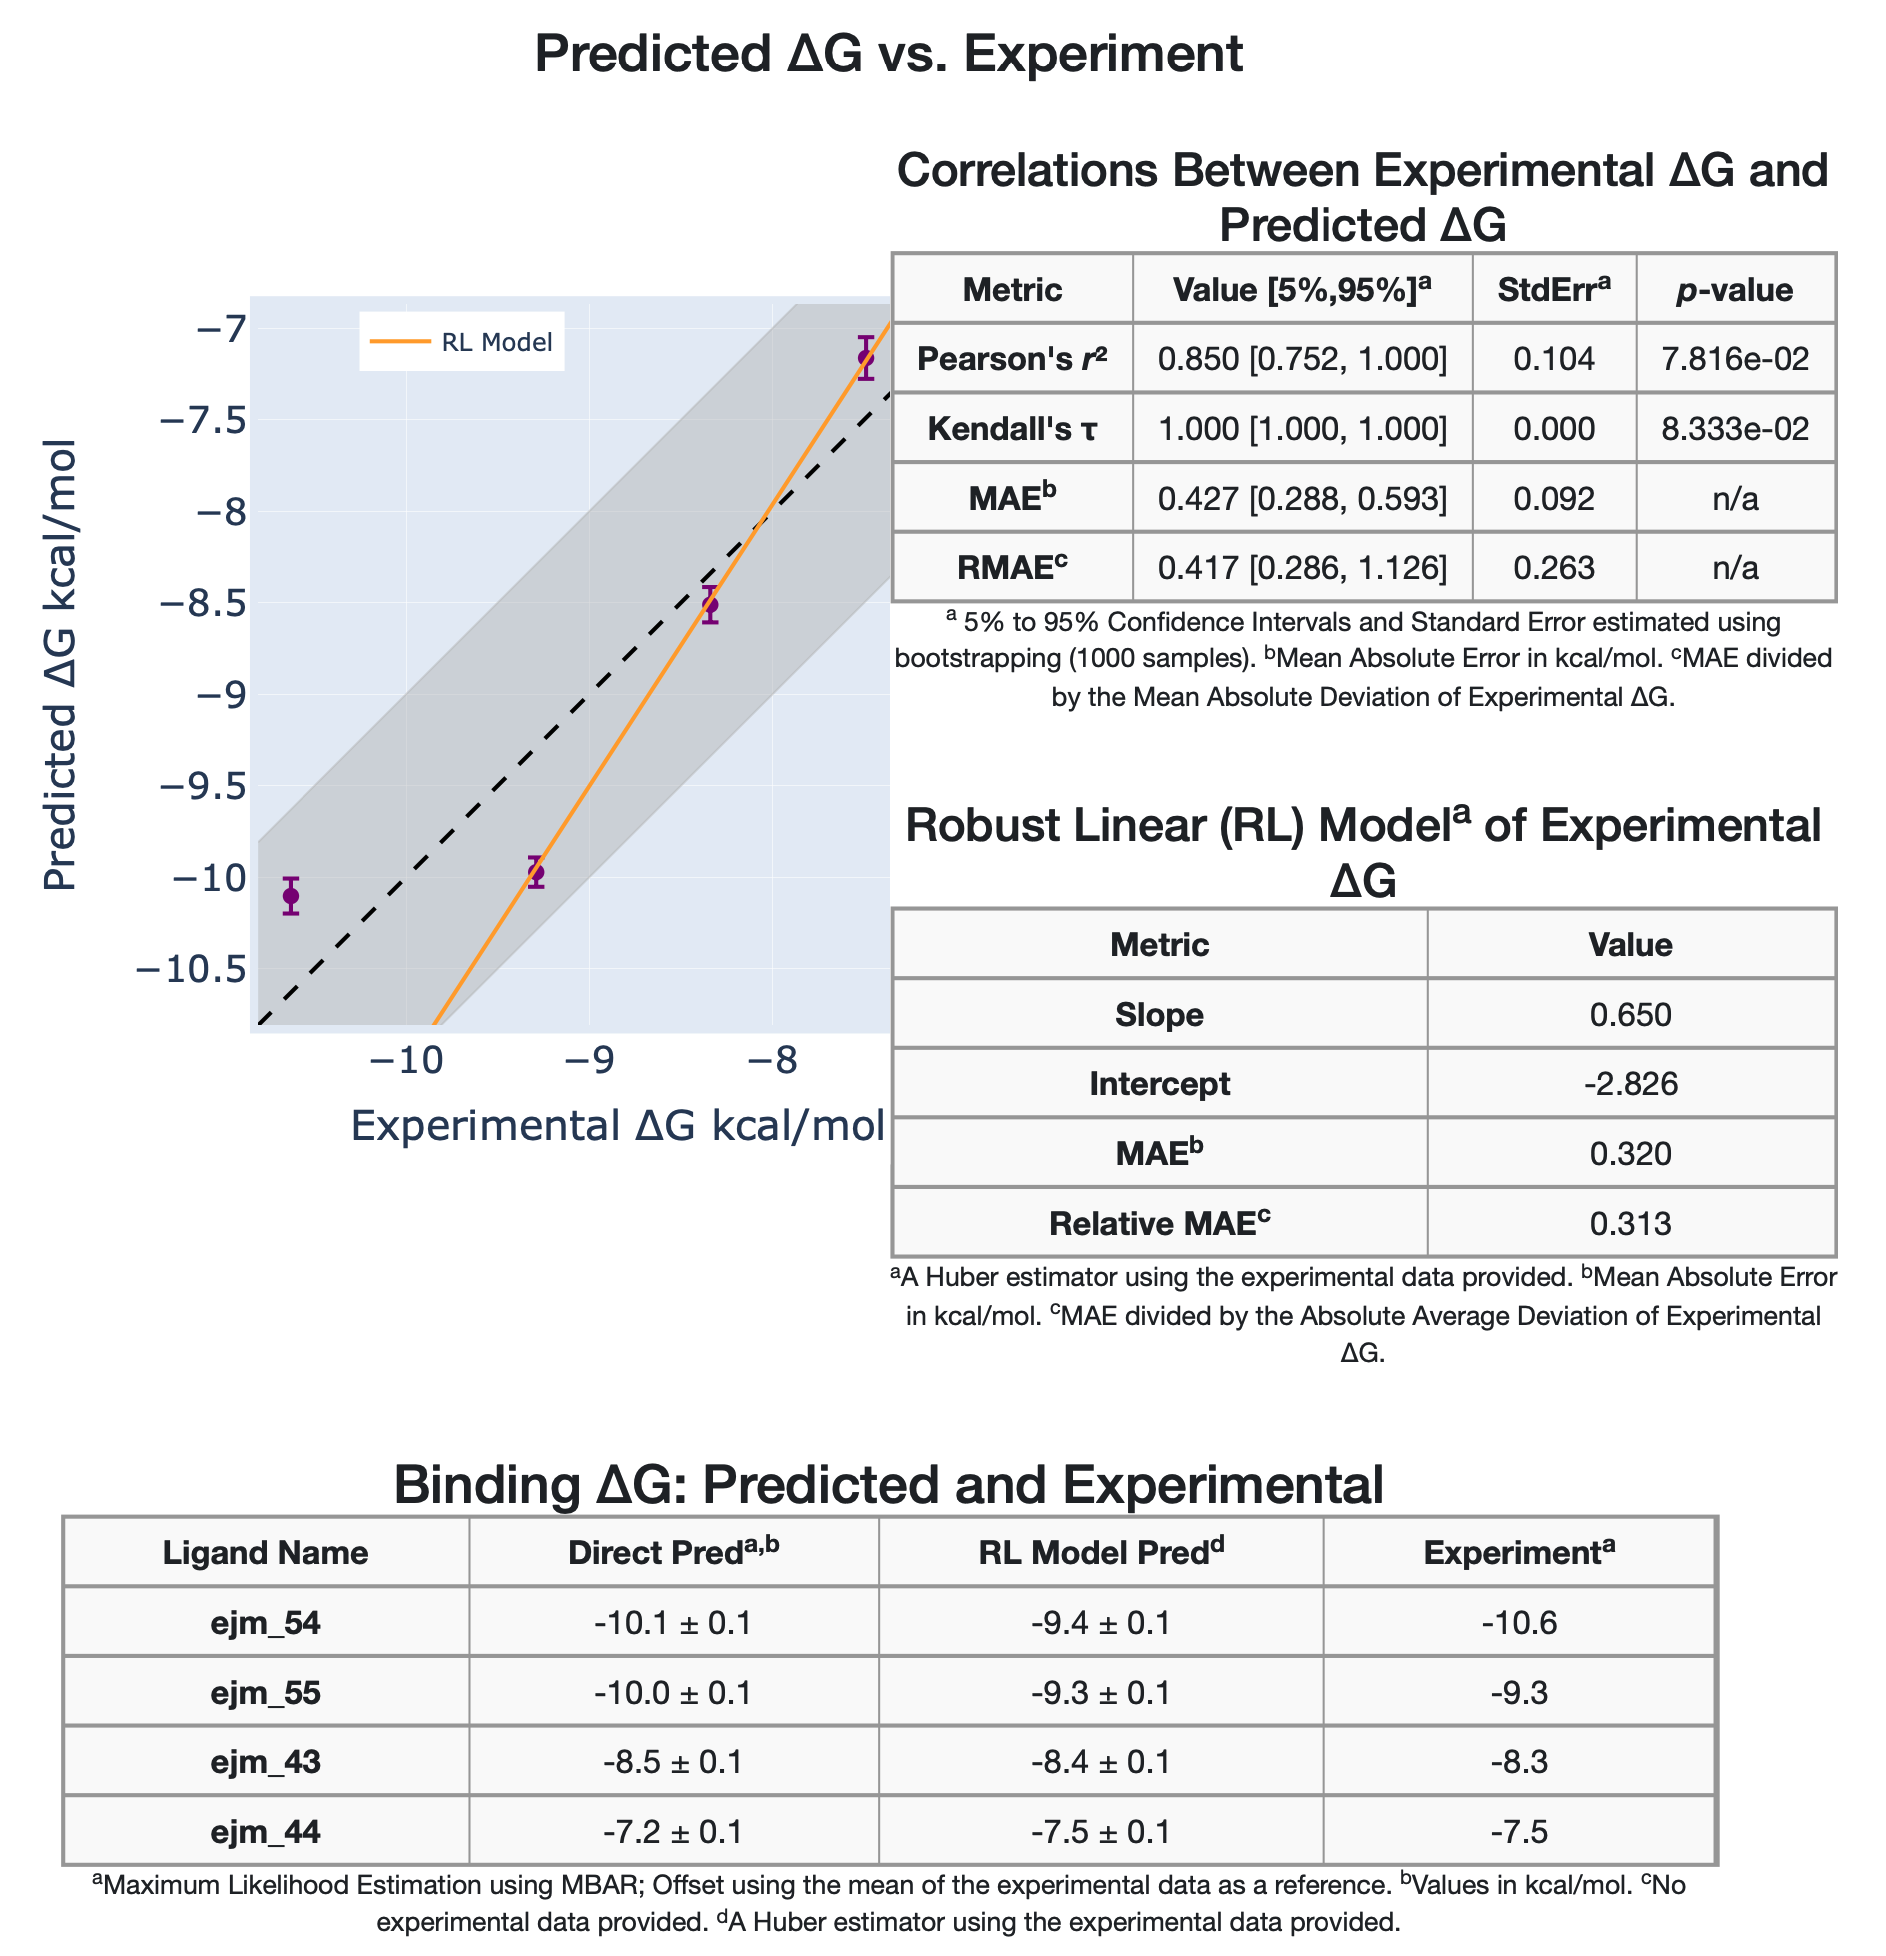
Tyk2 4ligs Experimental vs Predicted Affinities
In addition, the graph data are tabulated, and different statistical metrics are shown, such as correlation metrics and linear models. The second section of the Affinity Report shows a comparison between the experimental and predicted relative binding affinities \(\Delta\Delta G_{Experimental}\) vs \(\Delta\Delta G_{Predicted}\) in a graph and tables with the statistical metrics as well.
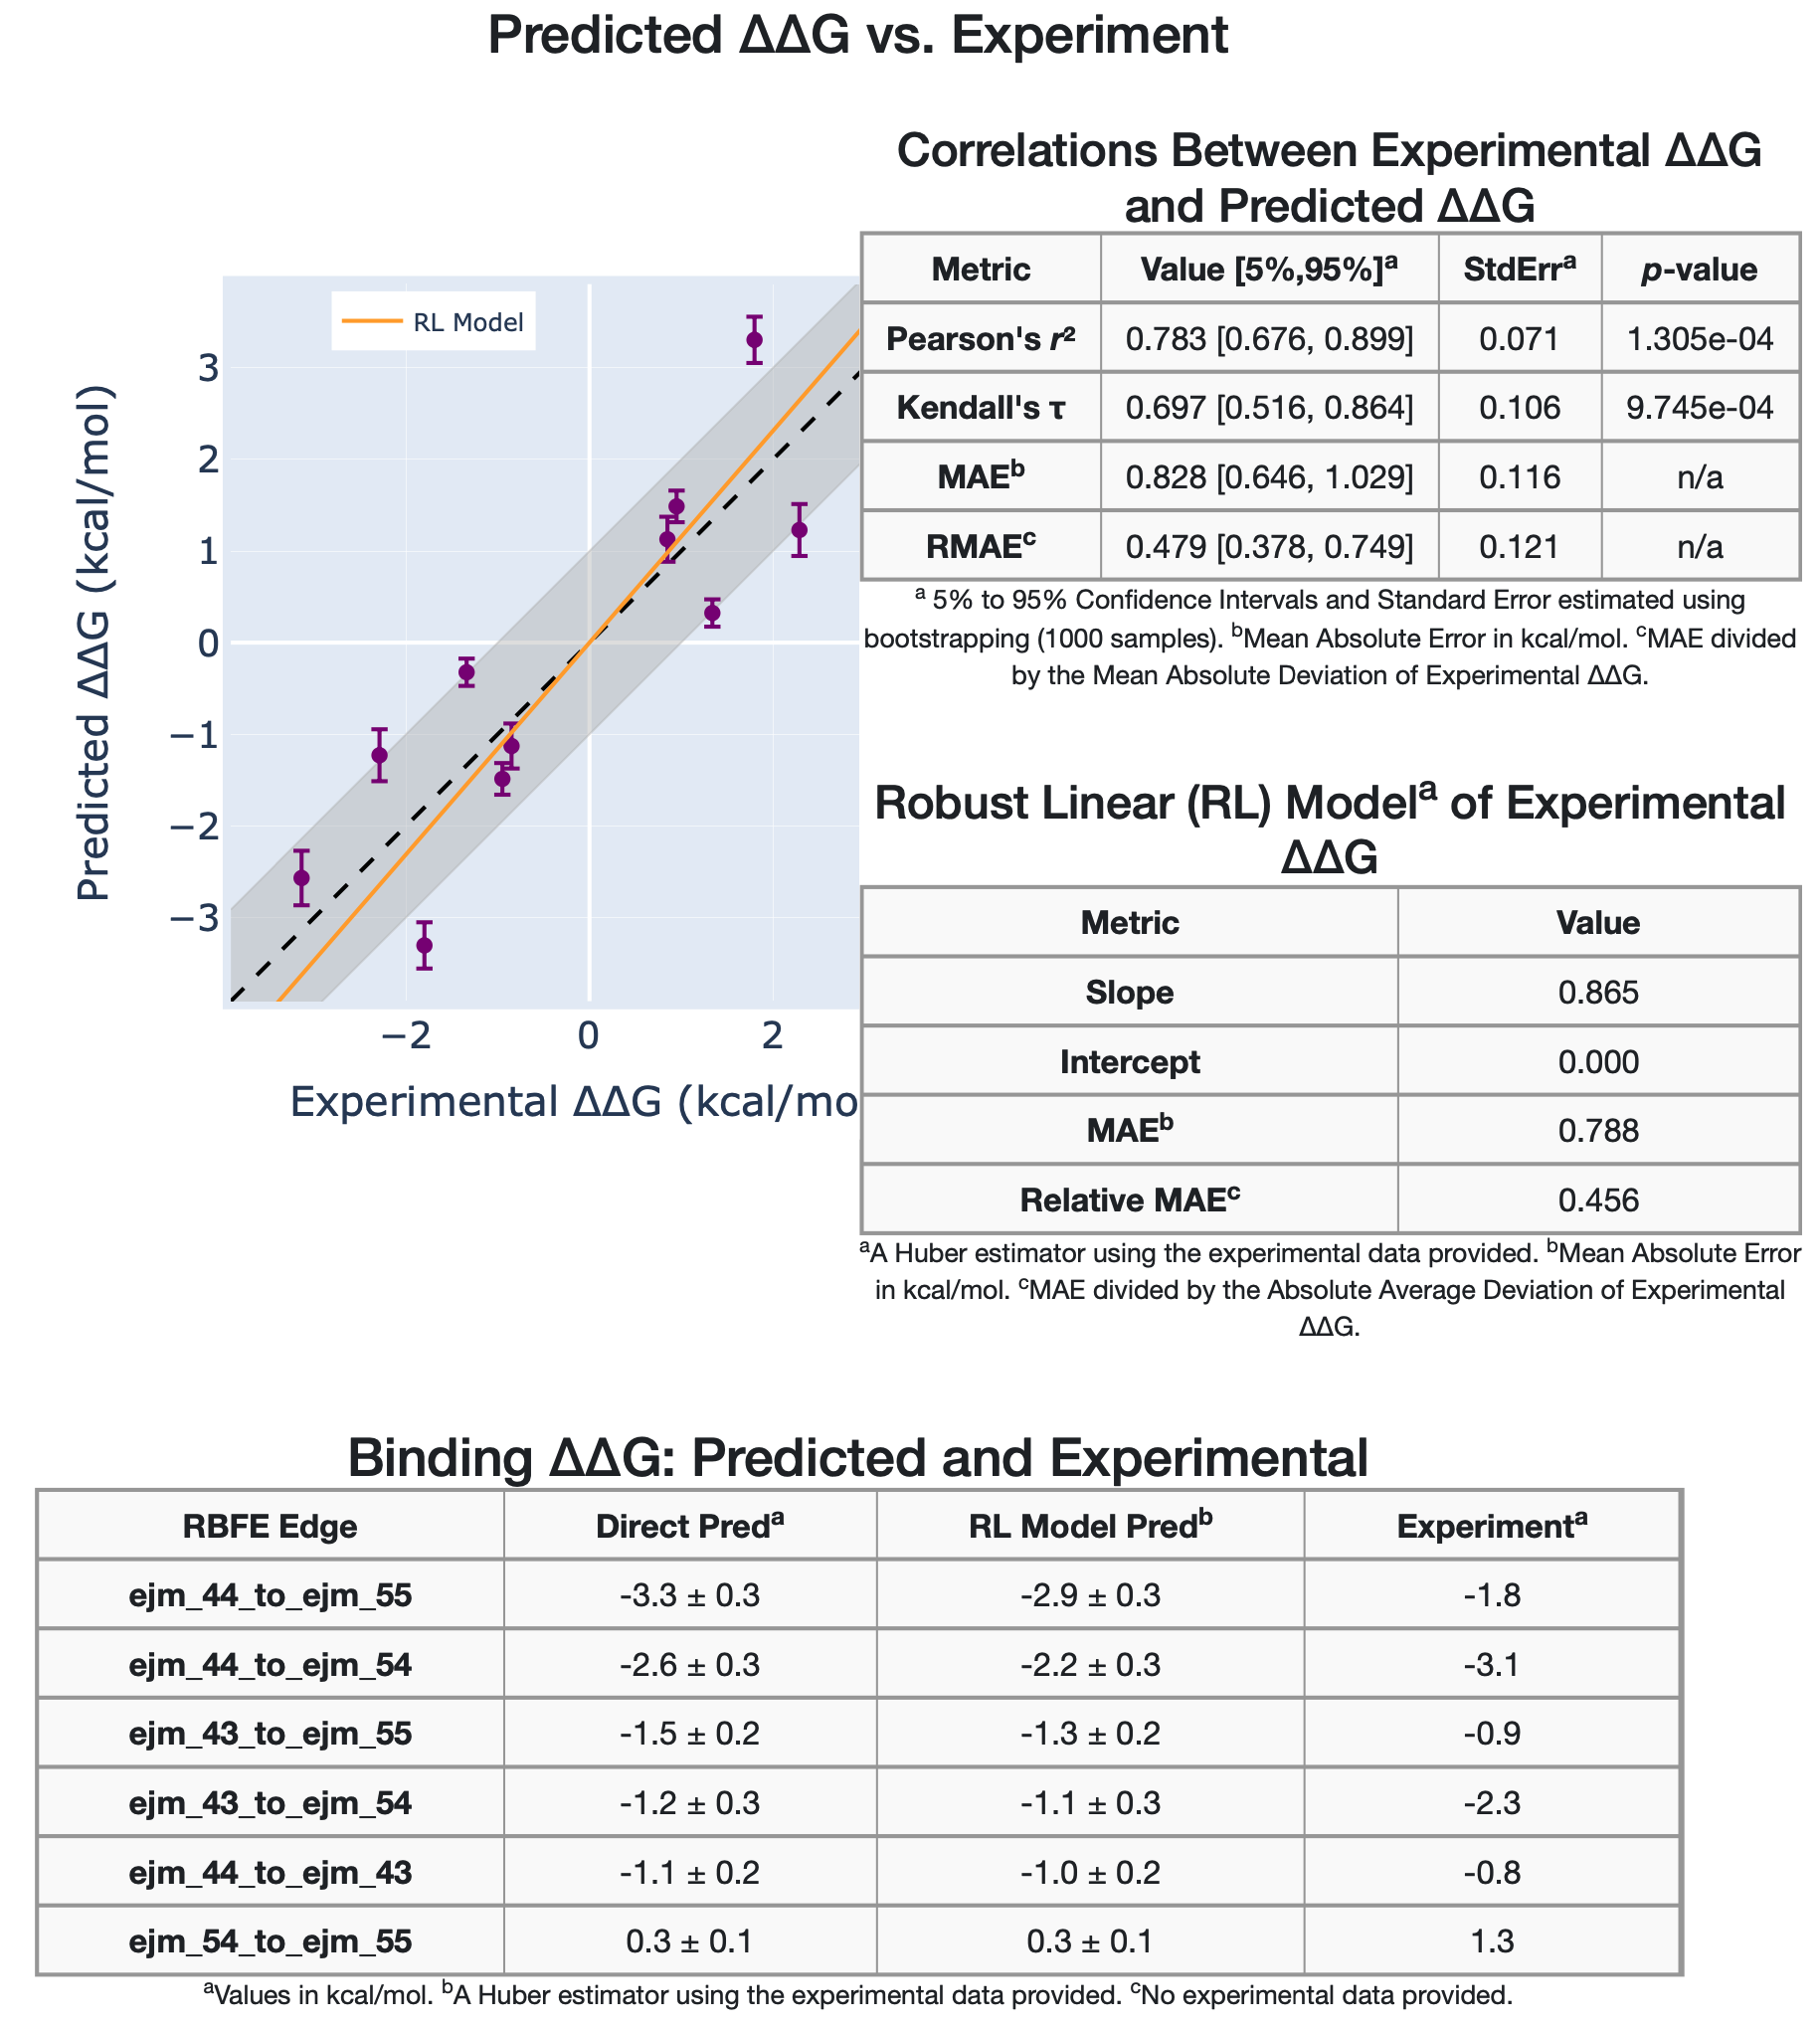
Tyk2 4ligs Experimental vs Predicted Relative Binding Affinities
In addition to the NES and the Affinity floe reports, the results themselves are also uploaded to Orion S3 in .tar.gz file format ready to be locally downloaded. These files, contain all the NES and affinity data provided in .csv file formats that can be used for a more close analysis and the .html reports.