Drawing Fingerprint Score Histogram
Problem
You want to plot the histogram of molecular similarity scores of a dataset (see Figure 1).

Figure 1. Similarity scores of molecules with the same activity class
Ingredients
|
Difficulty level

Download
Solution
The plot_similarity_score_histogram function shows how to calculate the similarity scores histogram by calling the the OEFastFPDatabase.GetHistogram method. The OEFastFPDatabase.GetHistogram method calculates the similarity scores for all pairs of fingerprints stored in the fingerprint database and returns the scores in OEFPHistogram object (line 19). The plot is then initialized iterating over the bins of the OEFPHistogram object. Finally, the average similarity score along with the corresponding legend are plotted.
Note
For symmetric similarity measures, the histogram will only contain upper-triangular similarity scores (excluding the diagonal). In case of the asymmetric OETversky similarity measure, the histogram for the whole NxN matrix is returned.
 1def plot_similarity_score_histogram(fpdb, opts, nrbins):
 2    """
 3    Plots similarity score histograms
 4
 5    :type fpdb: oegraphsim.OEFastFPDatabase
 6    :type opts: oegraphsim.OEFPDatabaseOptions
 7    :type  nrbins: int
 8    """
 9
10    nrfps = fpdb.NumFingerPrints()
11    fptype = fpdb.GetFPTypeBase()
12    memtypestr = fpdb.GetMemoryTypeString()
13    simfuncstr = oegraphsim.OEGetSimilarityMeasureName(opts.GetSimFunc())
14
15    # get histogram
16
17    timer = oechem.OEWallTimer()
18    timer.Start()
19    hist = fpdb.GetHistogram(opts, nrbins)
20    oechem.OEThrow.Info("%5.2f sec to get histogram for %d fingerprints (%s)" % (timer.Elapsed(), nrfps, memtypestr))
21
22    # plot histogram
23
24    plt.xlim(hist.GetMin(), hist.GetMax())
25
26    centers = [c for c in hist.GetBinCenters()]
27    densities = [d for d in hist.GetDensity()]
28
29    plt.plot(centers, densities, 'r', linewidth=2, drawstyle='steps-mid')
30
31    plt.axis([hist.GetMin(), hist.GetMax(), 0.0,  max(densities)])
32
33    plt.title(fptype.GetFPTypeString(), fontsize=10)
34
35    plt.ylabel('Probability', fontsize=18)
36    plt.xlabel('Similarity score (%s)' % simfuncstr, fontsize=18)
37    plt.yticks(fontsize=16)
38    plt.xticks(fontsize=16)
39
40    mean = hist.Mean()
41    plt.plot([mean, mean], [0.0, 1.0], linestyle='dashed', color='blue', linewidth=2, label='mean=%.3f' % hist.Mean())
42
43    plt.legend(loc='upper right', fontsize=20)
Usage
Usage
First use the makefastfp.py
script (described in the Rapid Similarity Searching of Large Molecule Files recipe)
with drugs.sdf supporting data
to generate a binary fingerprint file.
prompt > python3 makefastfp.py -in drugs.sdf -fpdbfname drugs-tree.fpbin -fptype Tree
Then the fphist2img.py
script can be used to plot the histogram of the similarity scores.
prompt > python3 fphist2img.py -fpdbfname drugs-tree.fpbin -out drugs-tree.svg
Command Line Parameters
Simple parameter list
    fingerprint database options
      -memorytype : Fingerprint database memory type

    fingerprint database search options
      -simfunc : Similarity measure

    input/output options
      -fpdbfname : Input filename of binary fingerprint database
      -out : Output filename of the generated image

    histogram options
      -nrbins : Number of bins in the histogram
Discussion
When using GraphSim TK to identify molecules that are similar to a query molecule, no default cutoff value is given. The reason for this that the score distribution highly depends on not only the similarity measure used to calculate the scores (see Table 1) but also the fingerprint types (see Table 2).
Tanimoto |
Euclid |
Tversky |

|

|

|
Tree |
Circular |
Path |
|
|

|

|
Plotting the similarity score distribution of molecules that belong the same activity class as the query as well as molecules with different activity classes could gives an idea about what a reasonable cutoff value would be.
molecules with same activity class |
molecules with different activity classes |
|
|

|
Performance
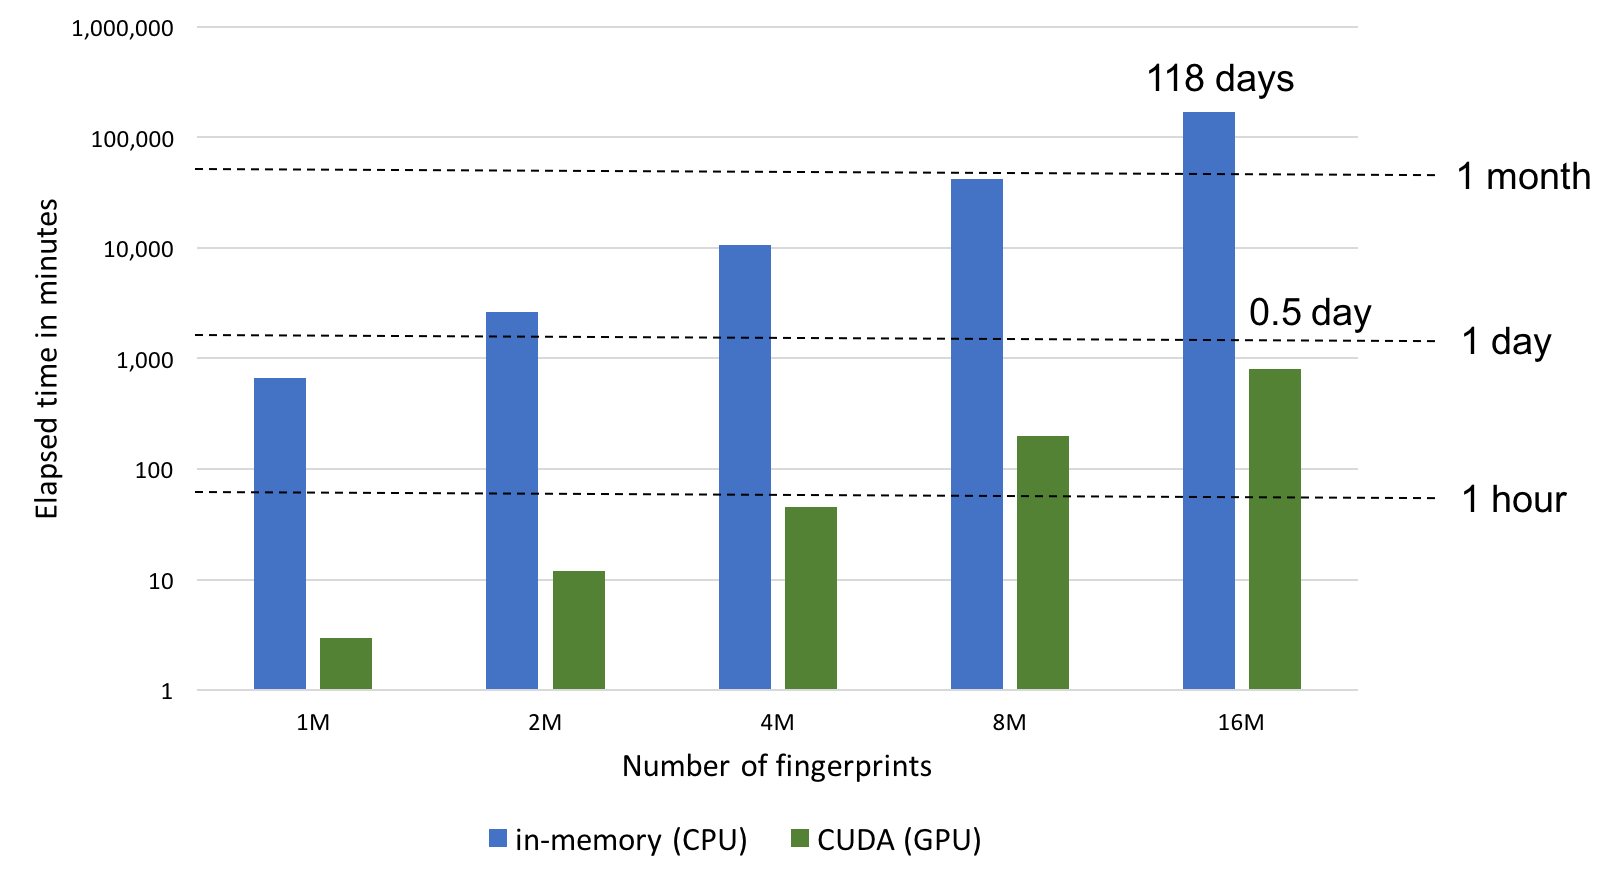
the fphist2img.py script can run in three different modes that determine how fingerprints are stored and searched in the OEFastFPDatabase object:
prompt > python3 fphist2img.py --help -memorytype
Contents of parameter -memorytype
   Aliases : -m
   Type : string
   Default : memory-mapped
   Legal values : memory-mapped in-memory CUDA
   Brief : Fingerprint database memory type
   Detail

 API : OEFastFPDatabaseMemoryType namespace
- in-memory
The in-memory mode involves pre-loading all fingerprints into memory prior to and performing the search in the memory. While this represents the fastest way to perform similarity searches once the fingerprints are loaded, searches are limited by memory availability.
- memory-mapped
The memory-mapped mode has no load time penalty or memory limitation but the search itself takes more time.
- CUDA
GPU-enabled calculation that provides 200x faster calculation than the two CPU modes above. CUDA mode involves pre-loading all fingerprints into GPU memory prior to performing similarity calculations. While this represents the fastest way to perform similarity searches once the fingerprints are loaded, searches are limited by GPU memory availability and will fall back to the memory-mapped CPU mode if the entire set of fingerprints cannot be preloaded into the GPU memory.
See also
OEFastFPDatabaseMemoryType namespace in the GraphSim TK manual
|
|
See also in GraphSim TK manual
Theory
Fingerprint Generation chapter
API
OEGetSimilarityMeasureName function
OEFastFPDatabase class
OEFPDatabaseOptions class
OEFPHistogram class