Depicting Molecule Similarity Based on Fingerprints
Problem
You want to depict the 2D similarity of two molecules based on their fingerprints. See example in Figure 1.

Figure 1. Example of depiction of 2D molecule similarity
Ingredients
|
Difficulty level

Solution
The GraphSim TK not only provides functionality to encode 2D molecular graph information into fingerprints, but it also gives access to the fragments that are being enumerated during the fingerprint generation process. The OEGetFPOverlap function, used in this example, returns all common fragments found between two molecules based on the given fingerprint type. These fragments are used in the SetFingerPrintSimilarity function to assess the similar parts of two molecules. Iterating over the bonds of the common fragments, the occurrence of each bond is counted and used as an overlap score (lines 6-10). These scores are then attached to the corresponding bonds as generic data (lines 15-18). The maximum overlap score is also calculated and returned by the function.
 1def SetFingerPrintSimilarity(qmol, tmol, fptype, tag, maxvalue=0):
 2
 3    qbonds = oechem.OEUIntArray(qmol.GetMaxBondIdx())
 4    tbonds = oechem.OEUIntArray(tmol.GetMaxBondIdx())
 5
 6    for match in oegraphsim.OEGetFPOverlap(qmol, tmol, fptype):
 7        for bond in match.GetPatternBonds():
 8            qbonds[bond.GetIdx()] += 1
 9        for bond in match.GetTargetBonds():
10            tbonds[bond.GetIdx()] += 1
11
12    maxvalue = max(maxvalue, max(qbonds))
13    maxvalue = max(maxvalue, max(tbonds))
14
15    for bond in qmol.GetBonds():
16        bond.SetData(tag, qbonds[bond.GetIdx()])
17    for bond in tmol.GetBonds():
18        bond.SetData(tag, tbonds[bond.GetIdx()])
19
20    return maxvalue
These bond overlap scores can be used to highlight the similar and dissimilar parts of the molecules. The ColorBondByOverlapScore bond annotation class takes a linear color gradient and draws a “stick” underneath each bond (lines 20-24). The color of the “stick” is determined by the overlap score of the bond (lines 17-18).
 1class ColorBondByOverlapScore(oegrapheme.OEBondGlyphBase):
 2    def __init__(self, cg, tag):
 3        oegrapheme.OEBondGlyphBase.__init__(self)
 4        self.colorg = cg
 5        self.tag = tag
 6
 7    def RenderGlyph(self, disp, bond):
 8
 9        bdisp = disp.GetBondDisplay(bond)
10        if bdisp is None or not bdisp.IsVisible():
11            return False
12
13        if not bond.HasData(self.tag):
14            return False
15
16        linewidth = disp.GetScale() / 3.0
17        color = self.colorg.GetColorAt(bond.GetData(self.tag))
18        pen = oedepict.OEPen(color, color, oedepict.OEFill_Off, linewidth)
19
20        adispB = disp.GetAtomDisplay(bond.GetBgn())
21        adispE = disp.GetAtomDisplay(bond.GetEnd())
22
23        layer = disp.GetLayer(oedepict.OELayerPosition_Below)
24        layer.DrawLine(adispB.GetCoords(), adispE.GetCoords(), pen)
25
26        return True
27
28    def ColorBondByOverlapScore(self):
29        return ColorBondByOverlapScore(self.colorg, self.tag).__disown__()
The DepictMoleculeOverlaps shows how to depict the 2D similarity of the two molecules:
Calculate the bond overlap scores for both molecules, an OELinearColorGradient object is constructed that is used by the ColorBondByOverlapScore class to annotate the bonds based on their overlap score (lines 6-10).
Prepare both molecules for depiction. The target molecule is aligned to the query by calling the OEPrepareMultiAlignedDepiction function (lines 12-14). The OEGetFPOverlap function is utilized to return all common fragments found between two molecules based on a given fingerprint type. These common fragments reveal the similar parts of the two molecules being compared that are used by the OEPrepareMultiAlignedDepiction function to find the best alignment between the molecules.
Divide the image into two cells using the OEImageGrid class, and the molecules are rendered next to each other (lines 16-30).
Generate fingerprints and calculate the similarity score calling the OETanimoto function (lines 32-38).
Render the score into the image (lines 40-42).
You can see the result in Figure 1. The DepictMoleculeOverlaps function uses “yellow to dark green” linear color gradient. Where there is 2D similarity detected between the two molecules, the color green is used to highlight the bonds and the color gets darker with increasing similarity. The color pink is used to highlight parts of the molecules that are not sharing any common fragments i.e. they are 2D dissimilar.
 1def DepictMoleculeOverlaps(image, qmol, tmol, fptype, opts):
 2
 3    tag = oechem.OEGetTag("fpoverlap")
 4    maxvalue = SetFingerPrintSimilarity(qmol, tmol, fptype, tag)
 5
 6    colorg = oechem.OELinearColorGradient()
 7    colorg.AddStop(oechem.OEColorStop(0.0, oechem.OEPinkTint))
 8    colorg.AddStop(oechem.OEColorStop(1.0, oechem.OEYellow))
 9    colorg.AddStop(oechem.OEColorStop(maxvalue, oechem.OEDarkGreen))
10    bondglyph = ColorBondByOverlapScore(colorg, tag)
11
12    oedepict.OEPrepareDepiction(qmol)
13    overlaps = oegraphsim.OEGetFPOverlap(qmol, tmol, fptype)
14    oedepict.OEPrepareMultiAlignedDepiction(tmol, qmol, overlaps)
15
16    grid = oedepict.OEImageGrid(image, 1, 2)
17    grid.SetMargin(oedepict.OEMargin_Bottom, 10)
18    opts.SetDimensions(grid.GetCellWidth(), grid.GetCellHeight(), oedepict.OEScale_AutoScale)
19    opts.SetAtomColorStyle(oedepict.OEAtomColorStyle_WhiteMonochrome)
20
21    molscale = min(oedepict.OEGetMoleculeScale(qmol, opts),
22                   oedepict.OEGetMoleculeScale(tmol, opts))
23    opts.SetScale(molscale)
24
25    qdisp = oedepict.OE2DMolDisplay(qmol, opts)
26    oegrapheme.OEAddGlyph(qdisp, bondglyph, oechem.IsTrueBond())
27    oedepict.OERenderMolecule(grid.GetCell(1, 1), qdisp)
28
29    tdisp = oedepict.OE2DMolDisplay(tmol, opts)
30    oegrapheme.OEAddGlyph(tdisp, bondglyph, oechem.IsTrueBond())
31    oedepict.OERenderMolecule(grid.GetCell(1, 2), tdisp)
32
33    qfp = oegraphsim.OEFingerPrint()
34    oegraphsim.OEMakeFP(qfp, qmol, fptype)
35
36    tfp = oegraphsim.OEFingerPrint()
37    oegraphsim.OEMakeFP(tfp, tmol, fptype)
38
39    score = oegraphsim.OETanimoto(qfp, tfp)
40
41    font = oedepict.OEFont(oedepict.OEFontFamily_Default, oedepict.OEFontStyle_Default, 16,
42                           oedepict.OEAlignment_Center, oechem.OEBlack)
43    center = oedepict.OE2DPoint(image.GetWidth() / 2.0, image.GetHeight() - 10)
44    image.DrawText(center, "Tanimoto score = %.3f" % score, font)
Download code
Usage:
prompt > python3 simcalc2img.py -query query.mol -target target.mol -out similarity.png
Discussion
Hint
Visualizing similarity of two molecules based on their fingerprints provides insight into molecule similarity beyond a single numerical score and reveals information about the underlying fingerprint methods.
The images in the following tables illustrate how changing a core or a terminal atom in a molecule effects the Tanimoto similarity scores.
Path |
Tree |
Circular |

|

|

|
Path |
Tree |
Circular |

|

|

|
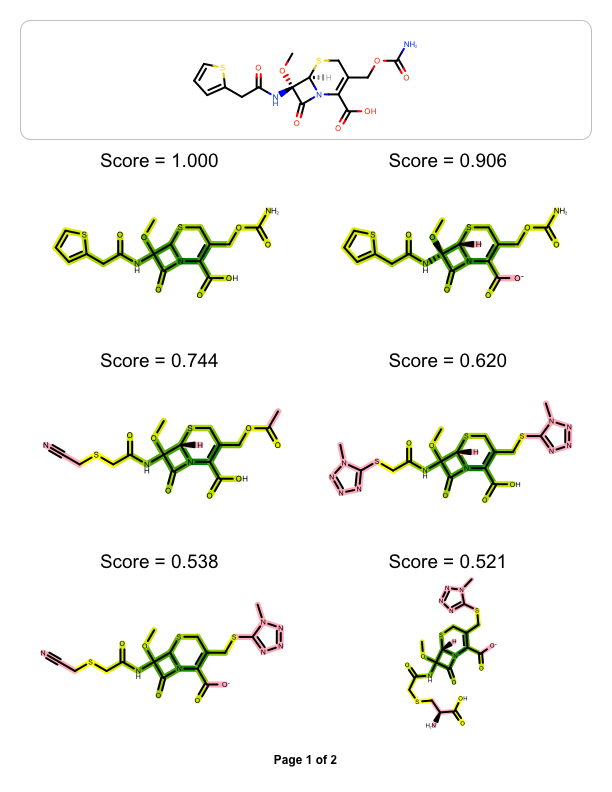
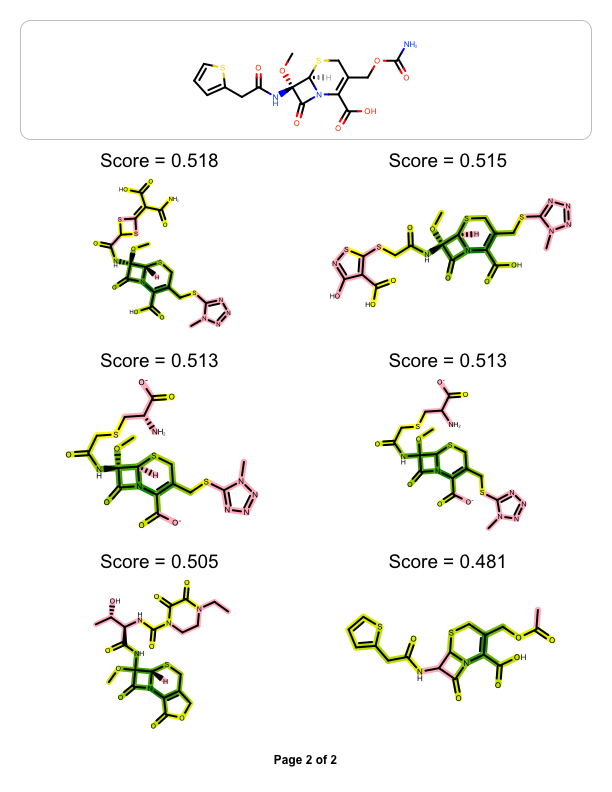
The example above shows how to visualize the molecule similarity of two molecule, however you might want to visualize the similarity between one ‘query’ molecule against a set of ‘target’ molecules. The example below reads a pre-generated binary fingerprint file (see more details in Rapid Similarity Searching of Large Molecule Files) and then generates a multi-page documentation depicting the most similar hits aligned to the ‘query molecule’
page 1 |
page 2 |
|
|
Download code
Usage:
prompt3 > simcalc2pdf.py -query query.ism -molfname targets.ism -fpdbfname targets.fpbin -out simcalc.pdf
See also in OEChem TK manual
Theory
Generic Data chapter
API
OELinearColorGradient class
See also in GraphSim TK manual
Theory
Fingerprint Generation chapter
Similarity Measures chapter
Fingerprint Overlap chapter
API
OEFingerPrint class
OEGetFPOverlap function
OEMakeFP function
OETanimoto function
See also in OEDepict TK manual
Theory
Molecule Depiction chapter
API
OE2DMolDisplay class
OE2DMolDisplayOptions class
OEImage class
OEImageGrid class
OEPrepareDepiction function
OEPrepareMultiAlignedDepiction function
OERenderMolecule function
See also in GraphemeTM TK manual
Theory
Annotating Atoms and Bonds chapter
API
OEAddGlyph function
OEBondGlyphBase abstract base class