Visualizing 3D Information
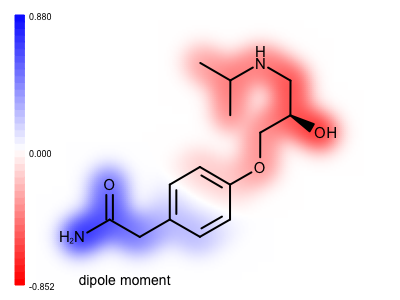
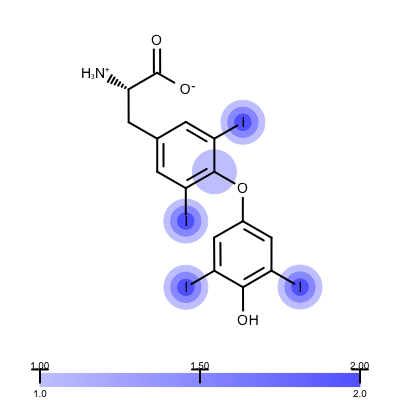
The recipes in this chapter illustrate how the Grapheme TK can be utilized to project complex 3D information into the 2D molecular graph.
Note
The interactive svg images generated by some of the examples below should be included into and HTML page with the SVG MIME type.
<object data="<imagename>.svg" type="image/svg+xml"></object>

|

|
|
|

|

|

|

|

|

|

|

|

|

|

|

|

|

|

|