Visualizing Shape and Color Overlap new
Problem
You want to visualize the output of OpenEye’s ROCS application by depicting shape, color similarity between a multi-conformer reference molecule and set of fit molecules. See Table 1.
ROCS is a tool for aligning and scoring a database of molecules to a reference (i.e. query) molecule. The scores are used to rank molecules based on the probability that they share relevant (biological) properties with the reference molecule. ROCS aligns molecules based on shape similarity and their distributions of chemical features (also referred as color atoms). ROCS outputs a file of the best alignment and scores for each of the database molecules to the reference molecule.
While the Python script of this recipe is designed to visualize the output of the OpenEye’s ROCS application, it can be easily modified to depict any set of molecules that are pre-aligned to a reference molecule.
Along with share and color overlays, the script can also depict the 2D graph similarity between the reference molecule and the set of fit molecules. This helps to easily identify molecules with high shape and color similarity but with a novel 2D molecular graph (i.e. with low 2D similarity scores). See examples in Table 2.
| page 1 | page 2 | page 3 |

|

|

|
Ingredients
|

Download
Solution
The main function of the script is depict_shape_color_graphsim_overlaps. After some fingerprint generation and depiction style setup, the function loops over all fit molecules and determines which conformation of the reference corresponds to each fit molecule (line 46-50). In the case of a multi-conformer reference molecule, a single conformation can not be used as the reference, otherwise the generated shape and color 2D depictions would not accurately represent the corresponding 3D information.
In the multi-page report a following images are generated for each fit molecule in the dataset:
- Score diagram (OEDrawROCSScores) and reference molecule display (OERenderShapeQuery).
- Shape overlap between the reference and the fit molecule (OERenderShapeOverlap) with a pre-calculated shape Tanimoto score.
- Color overlap between the reference and the fit molecule (OERenderColorOverlap) with a pre-calculated color Tanimoto score.
- 2D similarity (if requested) between the reference and the fit molecule (line 80-84). with Tree fingerprint similarity score calculated on-the-fly.
1 2 3 4 5 6 7 8 9 10 11 12 13 14 15 16 17 18 19 20 21 22 23 24 25 26 27 28 29 30 31 32 33 34 35 36 37 38 39 40 41 42 43 44 45 46 47 48 49 50 51 52 53 54 55 56 57 58 59 60 61 62 63 64 65 66 67 68 69 70 71 72 73 74 75 76 77 78 79 80 81 82 83 84 85 86 | def depict_shape_color_graphsim_overlaps(report, refmol, refmol_displays,
fitmols, depictsim):
"""
Depict shape, color, and 2D similarities.
:type report: oedepict.OEReport
:type refmol: oechem.OEMol
:type refmol_displays: dict[string, oegrapheme.OEShapeQueryDisplay]
:type fitmols: list[oechem.OEMol]
:type depictsim: boolean
"""
fptag, fptype, refmolfp, bondglyph = None, None, None, None
if depictsim:
fptag = oechem.OEGetTag("fpoverlap")
fptype = oegraphsim.OEGetFPType(oegraphsim.OEFPType_Tree)
print("Using fingerprint type %s" % fptype.GetFPTypeString())
refmolfp = oegraphsim.OEFingerPrint()
oegraphsim.OEMakeFP(refmolfp, refmol, fptype)
fpcolorg = get_fingerprint_colorgradient(get_max_bond_self_similarity_score(refmol, fptype))
bondglyph = ColorBondByOverlapScore(fpcolorg, fptag)
sopts = get_shape_overlap_display_options()
copts = get_color_overlap_display_options()
ftableopts = get_fit_table_options(depictsim)
rtableopts = get_ref_table_options()
scorefont = oedepict.OEFont(oedepict.OEFontFamily_Default, oedepict.OEFontStyle_Bold, 9,
oedepict.OEAlignment_Center, oechem.OEBlack)
tracer = oechem.OEConsoleProgressTracer()
tracer.SetTask("Generating overlays")
for fitidx, fitmol in enumerate(fitmols):
tracer.SetProgress(fitidx, len(fitmols))
if not oechem.OEHasSDData(fitmol, "ROCS_ShapeQuery"):
warning = "Shape query reference is not available for molecule '{}'"
oechem.OEThrow.Warning(warning.format(fitmol.GetTitle()))
continue
reftitle = oechem.OEGetSDData(fitmol, "ROCS_ShapeQuery")
if reftitle not in refmol_displays:
warning = "Shape query reference '{}'' is not valid for molecule '{}'"
oechem.OEThrow.Warning(warning.format(reftitle, fitmol.GetTitle()))
continue
refdisp = refmol_displays[reftitle]
cell = report.NewCell()
fittable = oedepict.OEImageTable(cell, ftableopts)
# title + score graph + query
maintitle = "Hit: {}".format(fitmol.GetTitle())
fittable.DrawText(fittable.GetCell(1, 1), maintitle)
reftable = oedepict.OEImageTable(fittable.GetCell(2, 1), rtableopts)
reftable.DrawText(reftable.GetCell(1, 1), "Rank: {}".format(fitidx+1))
render_score(reftable.GetCell(2, 1), fitmol, "ROCS_TanimotoCombo", "Tanimoto Combo", scorefont)
simscore = None if not depictsim else calc_fingerprint_similarity(refmol, refmolfp, fitmol, fptype, fptag)
render_score_radial(reftable.GetCell(3, 1), fitmol, simscore)
oegrapheme.OERenderShapeQuery(reftable.GetCell(4, 1), refdisp)
reftable.DrawText(reftable.GetCell(5, 1), "query : {}".format(reftitle))
odisp = oegrapheme.OEShapeOverlapDisplay(refdisp, fitmol, sopts, copts)
# shape overlap
render_score(fittable.GetHeaderCell(1), fitmol, "ROCS_ShapeTanimoto", "Shape Tanimoto", scorefont)
oegrapheme.OERenderShapeOverlap(fittable.GetCell(2, 2), odisp)
# color overlap
render_score(fittable.GetHeaderCell(2), fitmol, "ROCS_ColorTanimoto", "Color Tanimoto", scorefont)
oegrapheme.OERenderColorOverlap(fittable.GetCell(2, 3), odisp)
# 2D similarity
if depictsim:
simtitle = "2D Graph Tanimoto = {:4.3f}".format(simscore)
oedepict.OEDrawTextToCenter(fittable.GetHeaderCell(3), simtitle, scorefont)
depict_molecule_similarity(fittable.GetCell(2, 4), fitmol, refdisp, bondglyph, fptag)
tracer.Pop()
|
Usage
Usage
shapeoverlap2pdf.py and ROCS result file: 4cox_rocs_hits.oeb.gz
The following command will generate the images shown in Table 1.
prompt > python3 shapeoverlap2pdf.py -in 4cox_rocs_hits.oeb.gz -out test.pdf -maxhits 12
The following command will generate the images shown in Table 2.
prompt > python3 shapeoverlap2pdf.py -in 4cox_rocs_hits.oeb.gz -out test.pdf -maxhits 12 -depictsim
| page 1 | page 2 | page 3 |

|

|

|
Command Line Parameters
/Users/krisztina/cookbook/oepycookbook/recipes/visualization/shapeoverlap2pdf.py : [-in] <input> [-out] <output pdf>
Simple parameter list
    input/output options:
      -in : Input molecule filename
      -out : Output image filename

    general options:
      -depictsim : Calculate and depict 2D molecule similarity
      -maxhits : Maximum number of hits depicted

    report options
      -pagebypage : Write individual numbered separate pages
Discussion
The aim of this script is to represent 3D overlays, see example in Figure 1, in a more comprehensible 2D layout that enables fast comparison of hit molecules. See corresponding 2D depiction in Figure 3.

Figure 1. 3D overlay of the fit molecule (pink) into the reference (grey)
For each fit molecule the corresponding query molecule is also depicted in the first column. The layout and orientation of query molecule can vary since the generation of the 2D coordinates are driven by the 3D coordinates of best matching conformation of the 3D query. See the layout difference of the query molecule in the 2nd and 3rd row on page 1 in Table 1.
See also
- OEPrepareDepictionFrom3D function in the OEDepict TK manual
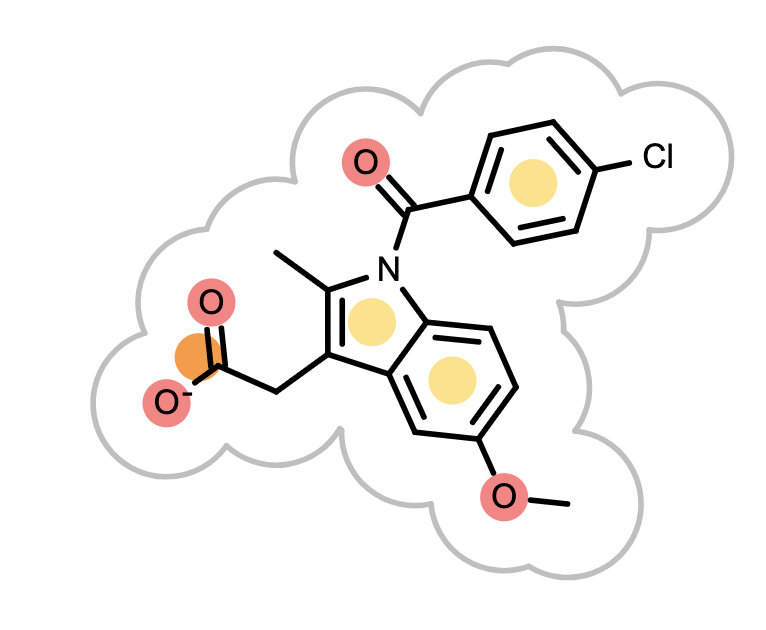
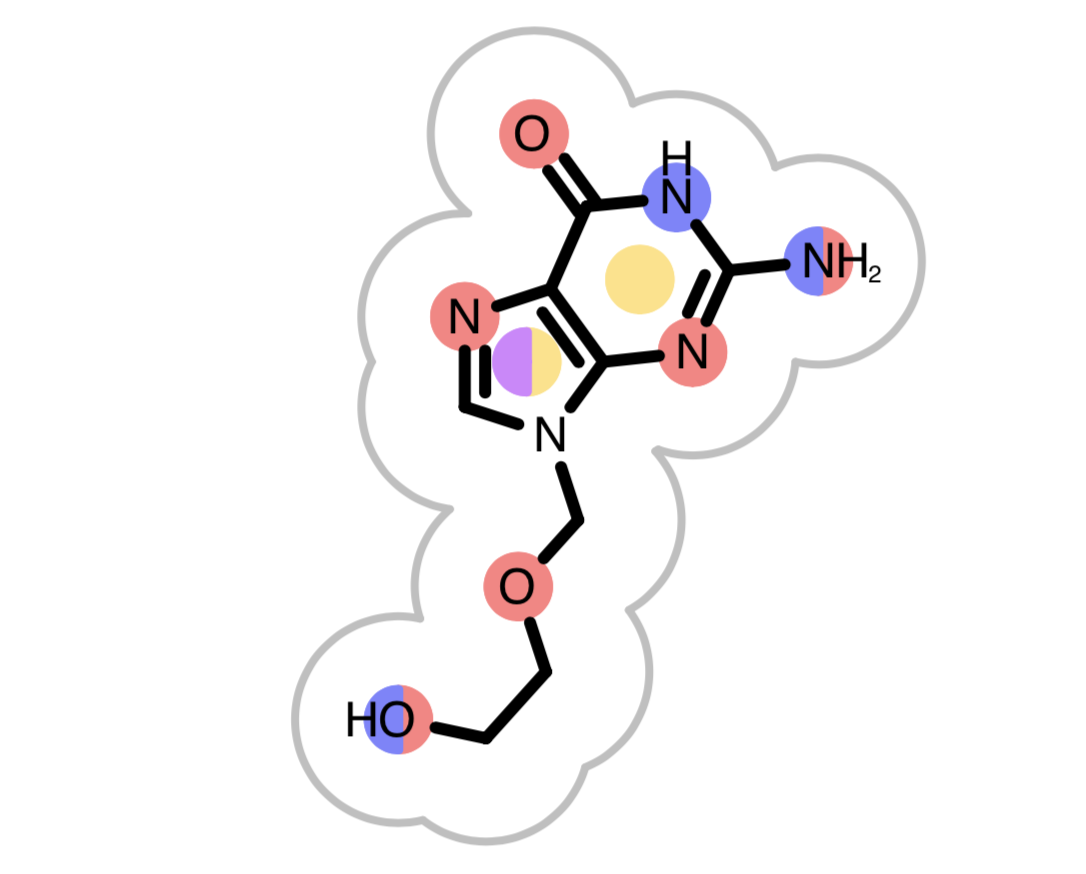
OEGrapheme TK uses colors to mark different chemical features detected in molecules.

Figure 2. Color-coding of chemical features
When the reference molecule is depicted, see examples in Table 3, colored circles indicate the detected chemical features on the molecular graph. If two color atoms occupy the same space in 3D, they are represented with adjacent half circles on the molecular graph.
|
|
When visualizing chemical features matches between the reference and the fit molecule, each circle on the fit molecule (see the 3rd image from the left in Figure 3), corresponds to a color atom in the reference molecule. The color of the circle indicates the fitness of the color atom match in 3D. The lighter the color, the smaller the overlap between the reference and fit color atoms in 3D. Unfilled circles represent unmatched reference color atoms. If there is a good color atom match exist for a reference color atom in 3D, then the circle representing the color atom is positioned to the matching fit color atom in 2D.
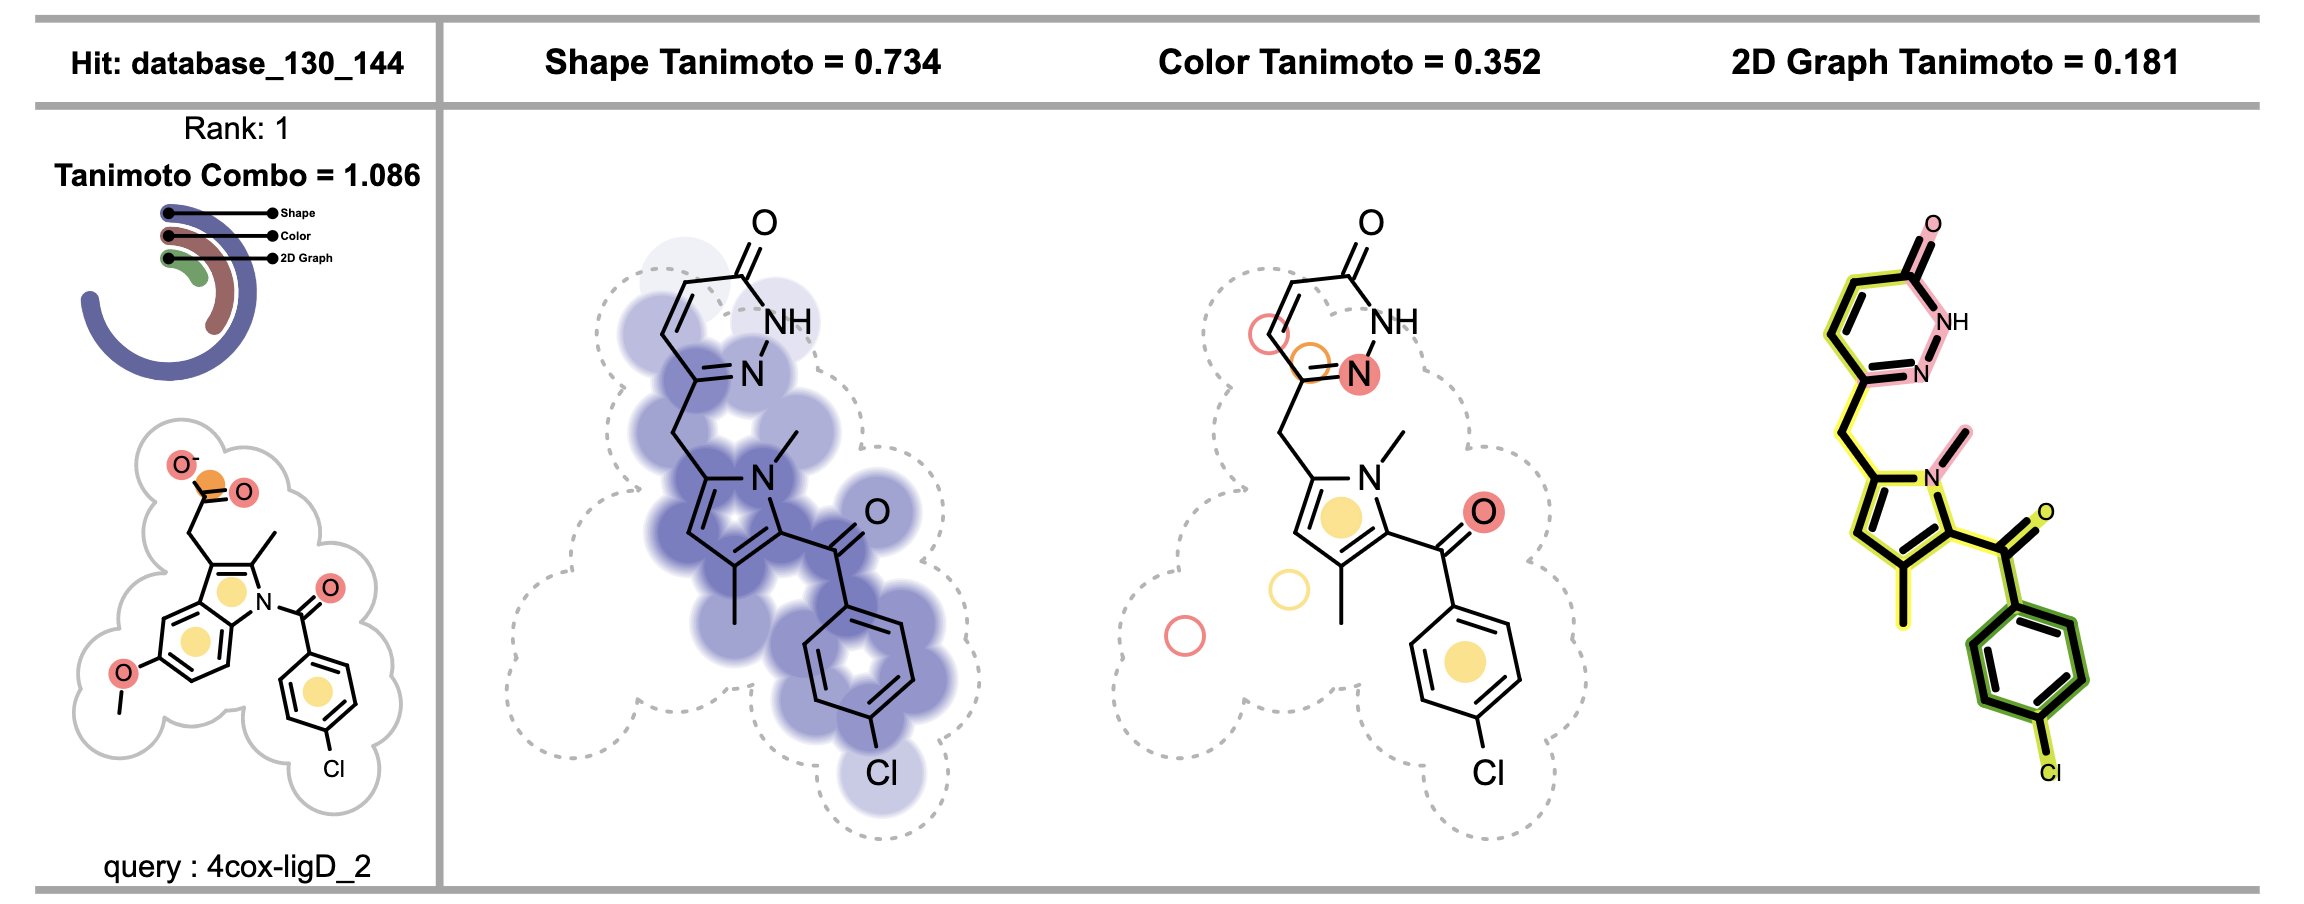
Figure 3. Visualizing shape, color and 2D similarity of the fit molecule to the corresponding reference (on the left)

Figure 4. Visualizing scores
The shape overlap between the reference and the fit molecule (see the 2nd image from the left in Figure 3) is visualized by drawing circles underneath the molecule, darker color indicates good 3D shape overlap between the reference and the fit molecules. Additionally, clashes between the molecular graph of the fit molecule and 2D molecule surface of the reference structure imply shape mismatch in 3D.
The 4th depiction in Figure 3 shows the 2D graph similarity between the reference and the fit molecule. See Depicting Molecule Similarity Based on Fingerprints recipe for more details about the calculation and interpretation of these images.
All scores (shape, color and 2D similarity) are in the range of [0.0, 1.0]. These scores are visualized in a radials graph for easy interpretation and comparison. See example in Figure 4.
See also in GraphSim TK manual
Theory
- Fingerprint Generation chapter
- Similarity Measures chapter
- Fingerprint Overlap chapter
API
- OEFingerPrint class
- OEGetFPOverlap function
- OEMakeFP function
- OETanimoto function
See also in OEDepict TK manual
Theory
- Molecule Depiction chapter
API
- OE2DMolDisplay class
- OE2DMolDisplayOptions class
- OEDepictOrientation namespace
- OEDrawTextToCenter function
- OEImage class
- OEImageTable class
- OEImageTableOptions class
- OEImageTableStyle namespace
- OEPrepareDepiction function
- OERenderMolecule function
- OEReport class
- OEReportOptions class
- OEWriteReport function
See also in GraphemeTM TK manual
Theory
- Annotating Atoms and Bonds chapter
API
- OEAddGlyph function
- OEBondGlyphBase abstract base class
- OEColorForceFieldDisplay class
- OEColorForceFieldLegendDisplayOptions class
- OEColorOverlapDisplayOptions class
- OEDrawColorForceFieldLegend function
- OEDrawROCSScores function
- OEGetMoleculeSurfaceScale function
- OEPrepareAlignedDepictionFrom3D function
- OERenderColorOverlap function
- OERenderShapeOverlap function
- OERenderColorOverlap function
- OERenderShapeQuery function
- OEShapeOverlapDisplay class
- OEShapeOverlapDisplayOptions class
- OEShapeOverlapDisplayStyle namespace
- OEShapeQueryDisplay class
- OEShapeQueryDisplayOptions class