Depicting CSV or SDF in PPTX (PowerPoint)
Problem
You want to depict molecules along with their associated data read from a
CSV file in an pptx PowerPoint file.
See example in drugs.pptx
and in Table 1.
slide 1 |
slide 2 |
slide 3 |
slide 4 |
|
|
|
|
Ingredients
|
Difficulty Level

Solution
The CSV file format is a text file format containing comma-separated values. In OEChem TK this file format is implemented to enable data exchange with a wide variety of other software. Each line of a CSV file stores data for a molecule that is represented by a SMILES string.
See also
CSV File Format section of the OEChem TK documentation about the layout of the CSV file format.
When reading a CSV file, the fields of the file are attached to each molecule as SD data. This data can be accessed by the OEGetSDDataIter function that returns an iterator over all the SD data (tag - value) pairs of a molecule. The CollectDataTags function iterates over a list of molecules and returns the unique tags of the data attached to the molecules.
1def CollectDataTags(mollist):
2
3    tags = []
4    for mol in mollist:
5        for dp in oechem.OEGetSDDataIter(mol):
6            if not dp.GetTag() in tags:
7                tags.append(dp.GetTag())
8
9    return tags
The WritePPTXFile function takes a list of molecules read from a CSV file along with the data tags returned by the CollectDataTags function.
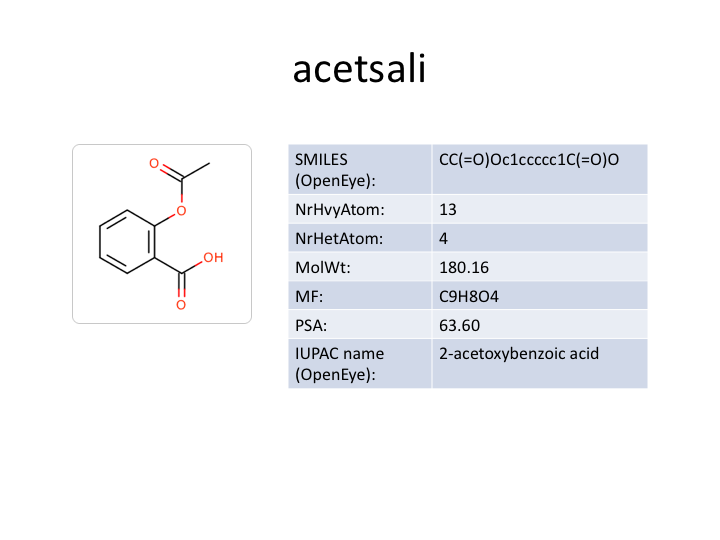
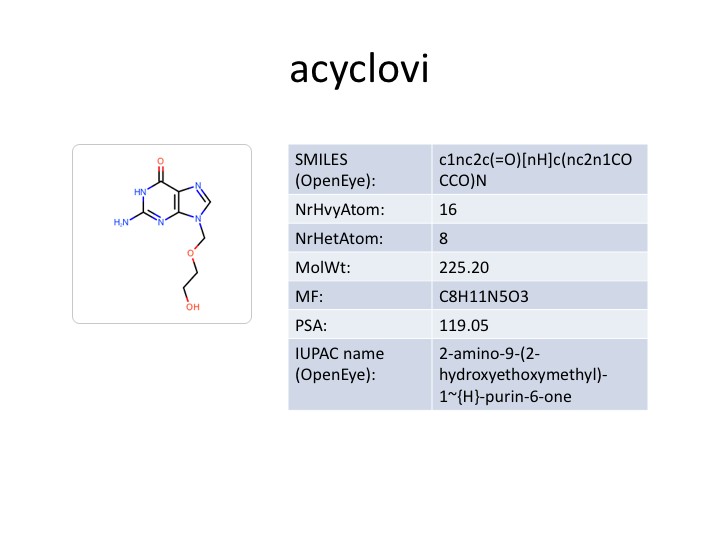
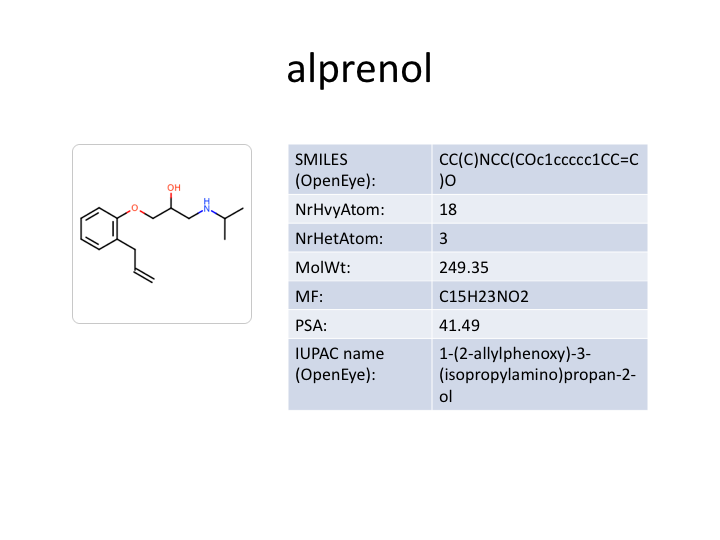
First a new ‘presentation’ is created with a first slide showing the name of the input file. Then iterating over the molecules, each molecule is depicted in a new slide along with the corresponding data by calling. the RenderData function. In order to add the images, a temporary image file has to be generated for each molecule. These files can be removed after the presentation is saved.
 1def WritePPTXFile(oname, mollist, iname, tags, opts):
 2
 3    # create new PowrPoint presentation
 4
 5    pres = pptx.Presentation()
 6
 7    # add first slide
 8
 9    title_slide_layout = pres.slide_layouts[0]
10    title_slide = pres.slides.add_slide(title_slide_layout)
11    title = title_slide.shapes.title
12    title.text = os.path.basename(iname)
13
14    tmpfnames = []
15
16    # create a new slide for each molecule
17
18    for idx, mol in enumerate(mollist):
19        slide_layout = pres.slide_layouts[5]
20        slide = pres.slides.add_slide(slide_layout)
21
22        if mol.GetTitle():
23            title = slide.shapes.title
24            title.text = mol.GetTitle()
25
26        fname = "tmp%d.png" % idx
27        WriteImageToFile(fname, mol, opts)
28        slide.shapes.add_picture(fname, left=Inches(1.0), top=Inches(2.0), width=Inches(2.5))
29        tmpfnames.append(fname)
30
31        RenderData(slide, mol, tags)
32
33    pres.save(oname)
34
35    # remove temporary image files
36
37    for fname in tmpfnames:
38        os.remove(fname)
The WriteImageToFile function generates a molecule depiction and writes it into an image file.
1def WriteImageToFile(fname, mol, opts):
2
3    image = oedepict.OEImage(opts.GetWidth(), opts.GetHeight())
4    oedepict.OEPrepareDepiction(mol)
5    disp = oedepict.OE2DMolDisplay(mol, opts)
6    oedepict.OERenderMolecule(image, disp, False)
7    oedepict.OEDrawCurvedBorder(image, oedepict.OELightGreyPen, 10.0)
8    oedepict.OEWriteImage(fname, image)
The RenderData function generates a new table and adds each (tag - value) tuples into separate rows.
 1def RenderData(slide, mol, tags):
 2
 3    data = []
 4    for tag in tags:
 5        value = "N/A"
 6        if oechem.OEHasSDData(mol, tag):
 7            value = oechem.OEGetSDData(mol, tag)
 8        data.append((tag, value))
 9
10    rows, cols = len(data), 2
11    table = slide.shapes.add_table(rows, cols, left=Inches(4.0), top=Inches(2.0),
12                                   width=Inches(5.5), height=Inches(0.8)).table
13
14    table.columns[0].width = Inches(2.0)
15    table.columns[1].width = Inches(3.5)
16    table.first_row = False
17
18    for row, (tag, value) in enumerate(data):
19        table.cell(row, 0).text = tag + ':'
20        table.cell(row, 1).text = value
Download code
csv2pptx.py
and drugs.csv
supporting data
Usage
Running the above command will generate the
drugs.pptx file.
prompt > python3 csv2pptx.py drugs.csv drugs.pptx
Discussion
Reading the columns of an CSV file into SD data fields, means
that the OEChem TK provides a meta-data interchange between sdf files and
CSV files.
Consequently, the same Python script can be used to generate a pptx file
reading an sdf file.
Usage
After downloading drugs.sdf supporting
data file, the above command will generate the same
drugs.pptx
file (apart from the input filename on the first slide).
prompt > python3 csv2pptx.py drugs.sdf drugs.pptx
See also
See also in OEChem TK manual
Theory
SD Tagged Data Manipulation section
CSV File Format section
API
OEGetSDDataPairs function
See also in OEDepict TK manual
Theory
Molecule Depiction chapter
API
OE2DMolDisplay class
OE2DMolDisplayOptions class
OEPrepareDepiction function