Depicting Fragment Combinations
Problem
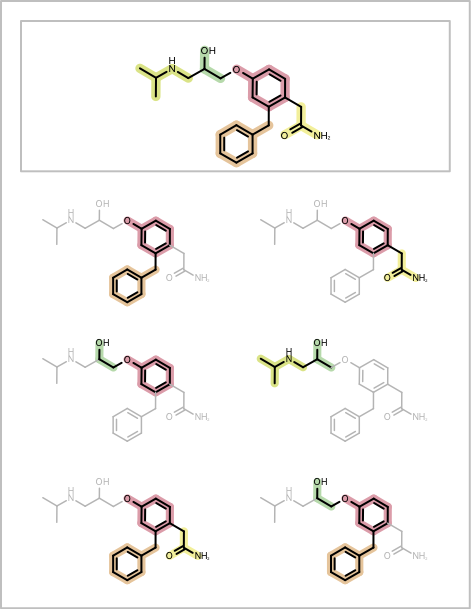
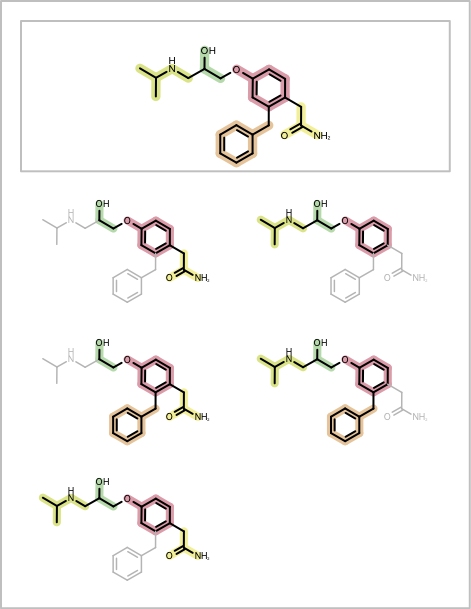
You want to depict fragment combinations generated by the algorithm described in the Enumerating Fragment Combinations. See example in Table 1.
page 1 |
page 2 |

|

|
Ingredients
|
Difficulty Level


Solution
The DepictMoleculeWithFragmentCombinations shows how to visualize fragment combinations returned by the GetFragmentAtomBondSetCombinations function. First a molecule is fragmented using one of the fragmentation functions described in the Enumerating Fragment Combinations section (see line 5 in the code below). Before enumerating the fragment combinations, an index is assigned to each bond of the molecule that indicates which fragment the bond belongs to (lines 9-13). Then a color list is created that is used by the ColorBondByFragmentIndex class to annotate the bonds based on their fragment index (lines 17-22). A highlighting style is also set up in order to fade part of the molecule that does not belong to a given fragment combination (lines 24-25). Then the GetFragmentAtomBondSetCombinations function is called that generates all adjacent fragment combinations and returns them as a list of OEAtomBondSet objects. Each fragment combination is then depicted in a separate cell of the report, by using highlighting and bond annotation (lines 33-47). Finally, in each page header the original molecule fragmentation is depicted (lines 51-59) .
 1def DepictMoleculeWithFragmentCombinations(report, mol, fragfunc, opts):
 2
 3    # fragment molecule
 4
 5    frags = [f for f in fragfunc(mol)]
 6
 7    # assign fragment indexes
 8
 9    stag = "fragment idx"
10    itag = oechem.OEGetTag(stag)
11    for fidx, frag in enumerate(frags):
12        for bond in frag.GetBonds():
13            bond.SetData(itag, fidx)
14
15    # setup depiction styles
16
17    nrfrags = len(frags)
18    colors = [c for c in oechem.OEGetLightColors()]
19    if len(colors) < nrfrags:
20        colors = [c for c in oechem.OEGetColors(oechem.OEYellowTint, oechem.OEDarkOrange, nrfrags)]
21
22    bondglyph = ColorBondByFragmentIndex(colors, itag)
23
24    lineWidthScale = 0.75
25    fadehighlight = oedepict.OEHighlightByColor(oechem.OEGrey, lineWidthScale)
26
27    # generate adjacent fragment combination
28
29    fragcombs = GetFragmentAtomBondSetCombinations(mol, frags)
30
31    # depict each fragment combinations
32
33    for frag in fragcombs:
34
35        cell = report.NewCell()
36        disp = oedepict.OE2DMolDisplay(mol, opts)
37
38        fragatoms = oechem.OEIsAtomMember(frag.GetAtoms())
39        fragbonds = oechem.OEIsBondMember(frag.GetBonds())
40
41        notfragatoms = oechem.OENotAtom(fragatoms)
42        notfragbonds = oechem.OENotBond(fragbonds)
43
44        oedepict.OEAddHighlighting(disp, fadehighlight, notfragatoms, notfragbonds)
45        oegrapheme.OEAddGlyph(disp, bondglyph, fragbonds)
46
47        oedepict.OERenderMolecule(cell, disp)
48
49    # depict original fragmentation in each header
50
51    cellwidth, cellheight = report.GetHeaderWidth(), report.GetHeaderHeight()
52    opts.SetDimensions(cellwidth, cellheight, oedepict.OEScale_AutoScale)
53    opts.SetAtomColorStyle(oedepict.OEAtomColorStyle_WhiteMonochrome)
54    disp = oedepict.OE2DMolDisplay(mol, opts)
55    oegrapheme.OEAddGlyph(disp, bondglyph, oechem.IsTrueBond())
56
57    headerpen = oedepict.OEPen(oechem.OEWhite, oechem.OELightGrey, oedepict.OEFill_Off, 2.0)
58    for header in report.GetHeaders():
59        oedepict.OERenderMolecule(header, disp)
60        oedepict.OEDrawBorder(header, headerpen)
The ColorBondByFragmentIndex bond annotation class draws a “stick” underneath each bond (lines 20-24). The color of the “stick” is determined by the index attached to the bond as generic data (lines 17-18).
 1class ColorBondByFragmentIndex(oegrapheme.OEBondGlyphBase):
 2    def __init__(self, colorlist, tag):
 3        oegrapheme.OEBondGlyphBase.__init__(self)
 4        self.colorlist = colorlist
 5        self.tag = tag
 6
 7    def RenderGlyph(self, disp, bond):
 8
 9        bdisp = disp.GetBondDisplay(bond)
10        if bdisp is None or not bdisp.IsVisible():
11            return False
12
13        if not bond.HasData(self.tag):
14            return False
15
16        linewidth = disp.GetScale() / 2.0
17        color = self.colorlist[bond.GetData(self.tag)]
18        pen = oedepict.OEPen(color, color, oedepict.OEFill_Off, linewidth)
19
20        adispB = disp.GetAtomDisplay(bond.GetBgn())
21        adispE = disp.GetAtomDisplay(bond.GetEnd())
22
23        layer = disp.GetLayer(oedepict.OELayerPosition_Below)
24        layer.DrawLine(adispB.GetCoords(), adispE.GetCoords(), pen)
25
26        return True
27
28    def ColorBondByFragmentIndex(self):
29        return ColorBondByFragmentIndex(self.colorlist, self.tag).__disown__()
Download code
The following will generate the multi-page PDF shown in
Table 1.
Usage:
prompt > python3 enumfrags2pdf.py -in .ism -out enumfrags.pdf -fragtype funcgroup

CC(C)NCC(COc1ccc(c(c1)Cc2ccccc2)CC(=O)N)O
See also in OEChem TK manual
Theory
Predicates Functors chapter
Generic Data chapter
API
OEAtomBondSet class
OEColorStop class
OEIsAtomMember predicate
OEIsBondMember predicate
OENotAtom predicate
OENotBond predicate
OELinearColorGradient class
See also in OEMedChem TK manual
Theory
Molecule Fragmentation chapter
API
OEGetFuncGroupFragments function
OEGetRingChainFragments function
OEGetRingLinkerSideChainFragments function
See also in OEDepict TK manual
Theory
Molecule Depiction chapter
Highlighting chapter
API
OE2DMolDisplay class
OEAddHighlighting function
OEHighlightByColor class
OERenderMolecule function
OEReport class
See also in GraphemeTM TK manual
Theory
Annotating Atoms and Bonds chapter
API
OEAddGlyph function
OEBondGlyphBase abstract base class