Verify Refinement: Verify Page
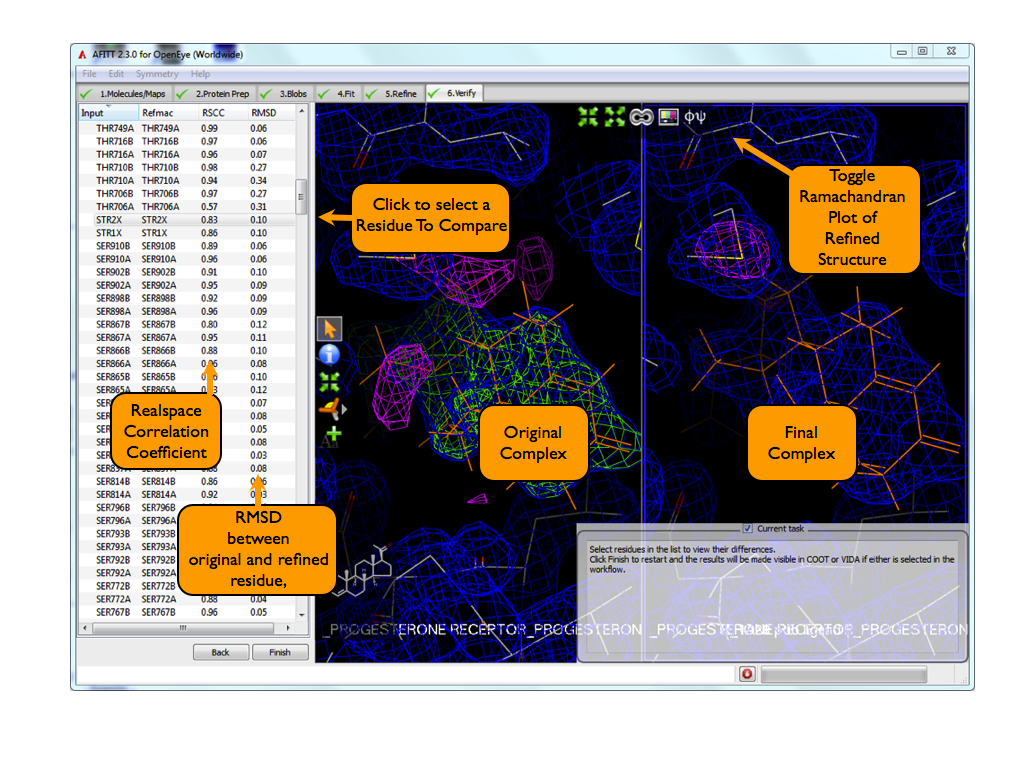
After a refinement has been done, AFITT analyzes the differences between the original protein-ligand complex and the refined complex. The analyzed differences are:
- RMSD
- Real space correlaction coefficient [EDS]
- Ramachandran Plot
The basic controls sre shown in Figure Verify Page.
Selecting a Residue
To see a residue in the 3D window, simply select the residue from the list shown in Figure: AFITT Verify Complex Page.
This list is sortable by residue name, real space correlation coefficient or RMSD.
In some occasions the RMSD column contains the word Broken. This usually means that the structure is missing a bond and the actual RMSD between the two structures could not be completed.
Note
For broken residues, we have found that using a much lower XRAY weight for refinement is preferable. Sometimes values as low as 0.01 are needed to maintain covalent geometries.
Ramachandran Plot
To show the Ramachandran plot, click on the Phi, Psi icons in the 3D window. When a residue is selected from the list window, it will be turned black in the Ramachandran plot. Additionally, placing the mouse over a residue in the Ramachandran plot will indicate the residue name.
Finishing
Clicking Finish will restart the wizard.
