Visualizing Protein-Ligand Interactions
Problem
You want to visualize protein-ligand interactions. See example in Figure 1.
Figure 1. Example of visualizing protein-ligand interactions (PDB: 13GS)

Ingredients
|
Difficulty level

Download
Solution
The depict_complex illustrates how to generate protein-ligand iteration images.
OEInteractionHintContainer object is constructed that stores information about possible interactions between the ligand and the protein.
The interactions are perceived by calling the OEPerceiveInteractionHints function.
The image is then separated into two frames: the ligand and the residues around it is going to rendered into one frame, while the corresponding legend into the other frame.
The active site is then prepared for 2D depiction by invoking the OEPrepareActiveSiteDepiction function.
When the OE2DActiveSiteDisplay object is constructed, residues are positioned around the ligand close to those atoms which they are interacting with. The OERenderActiveSite function generates an image in which each residue cycle are colored based on the types in which they are interact with the ligand. The interactions between the residues and the ligand atoms are marked by using different style of lines. See more details in the Discussion section below.
The legend associated with the active site is rendered by invoking the OEDrawActiveSiteLegend function.
def depict_complex(image, protein, ligand, opts, legend_frame=None):
    """
    :type image: oedepict.OEImageBase
    :type protein: oechem.OEMolBase
    :type ligand: oechem.OEMolBase
    :type opts: oedepict.OE2DMolDisplayOptions
    :type legend_frame: oedepict.OEImageBase
    """

    # perceive interactions

    asite = oechem.OEInteractionHintContainer(protein, ligand)
    if not asite.IsValid():
        oechem.OEThrow.Fatal("Cannot initialize active site!")
    asite.SetTitle(ligand.GetTitle())

    oechem.OEPerceiveInteractionHints(asite)

    # depiction

    oegrapheme.OEPrepareActiveSiteDepiction(asite)
    adisp = oegrapheme.OE2DActiveSiteDisplay(asite, opts)
    oegrapheme.OERenderActiveSite(image, adisp)

    if legend_frame is not None:
        lopts = oegrapheme.OE2DActiveSiteLegendDisplayOptions(12, 1)
        oegrapheme.OEDrawActiveSiteLegend(legend_frame, adisp, lopts)
Usage
Download code
Usage
The following commands will generate the image shown in Figure 1.
prompt > wget https://files.rcsb.org/download/13gs.pdb
prompt > python3 complex2img.py -complex 13gs.pdb -out 13gs.svg -interactive-legend
Command Line Parameters
Simple parameter list
    -height : Height of output image
    -width : Width of output image

    SplitMolComplex options :
      -covalentligand : Split covalent ligands
      -ligandname : Ligand name

    molecule display options :
      -aromstyle : Aromatic ring display style

    input/output options :
      -complex : Input filename of the protein-ligand complex
      -protein : Input filename of the protein
      -ligand : Input filename of the ligand
      -out : Output filename of the generated image

    active site display options:
      -interactive-legend : Visualize legend on mouse hover (SVG feature)
      -magnify-residue : Scaling factor to magnify residue glyph on mouse hover
                         (SVG feature)
Discussion
Interaction perception
Currently the OEPerceiveInteractionHints function perceives the following interaction types:
Table 1. Interaction types currently available in OEChem TK name
corresponding interaction class
corresponding interaction type namespace
cation-pi
chelator
clash
None
contact
None
covalent
None
halogen bond
hydrogen bond
salt-bridge
stacking (T and Pi)
The default geometric parameters used by the OEPerceiveInteractionHints function have been set based on literature data ([Kumar-2002], [Cavallo-2016], [Bissantz-2010], and [Marcou-2007] ). The interaction parameters can be customized by using the OEPerceiveInteractionOptions class.
Interaction depiction

Figure 2. Example of visualizing protein-ligand interactions (PDB: 1GKC)
Protein-ligand interaction images (such as Figure 2) are generated in the following steps:
Determining the 2D layout of the ligand
The 2D coordinates of the ligand are generated using the OEPrepareDepictionFrom3D function. The 2D layout is driven by the 3D coordinates of the bound ligand.
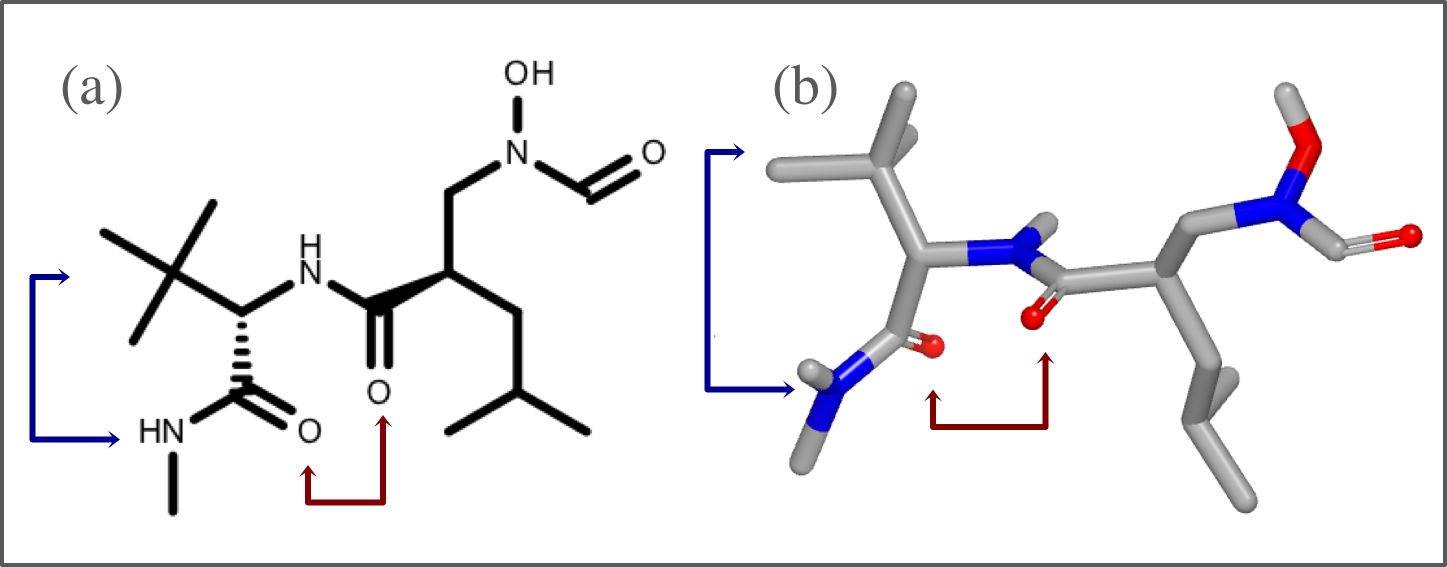
Step 1. Determining the 2D layout of the ligand
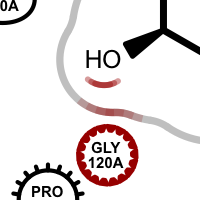
Visualizing the shape of the active site
The shape of active site is represented with a continuous gray line around the ligand. First, 2D molecule surface is constructed from adjoining arcs. The radius of each arc reflects the distance between the molecule surface of the ligand and the protein in 3D. The absence of an arc indicates regions where the ligand is exposed to the solvent. This 2D molecule surface is then smoothed to get the final aesthetic pleasing representation.

Step 2. Visualizing the shape of the active site
Positioning the residues
The residues are positioned close to the ligand atoms they interacts with. The distances of residue glyphs for the 2D ligand do not indicate distances in the 3D complex. Residues that only have contact interaction with the ligand are positioned further away, while those that have other type of interactions such as hydrogen bonding, salt bridge etc. are positioned closer to the atoms they are interacting with
Step 3. Positioning the residues (click on any residues in the image above)

Visualizing the residues and interactions
The type of the residues and other components around the ligand are represented by different shapes. For example, nearby water is depicted with a glyph resembling a water drop. Basic amino acid residues are represented with a circle and further annotated whether their atoms that are interact with ligand are in the backbone, side-chain or in both.

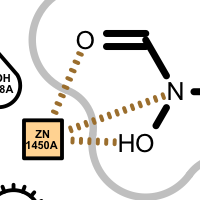
Legend of residue and interaction styles
Apart from the color each interaction type is also associated with a linker type. These linkers indicates which ligand atom(s) are interacting with which residue(s). Some of these linkers also imply the direction of the iterations. For example in case of the hydrogen bond interaction (see the first image in the table below), the chevron arrow shows the direction of the proton.
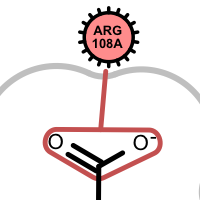
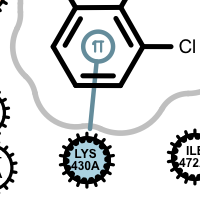
Examples of various interaction types 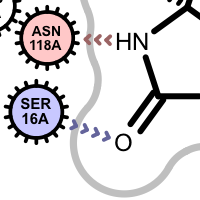
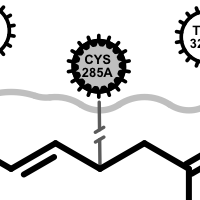
hydrogen bond
clash
chelator
covalent
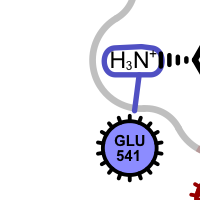
salt-bridge ligand (+)
salt-bridge ligand (-)
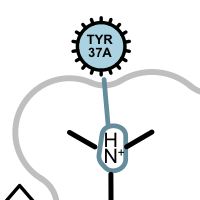
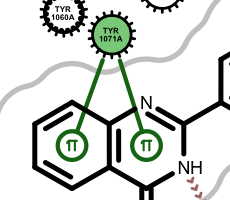
cation-pi (ligand aromatic ring)
cation-pi (protein aromatic ring)
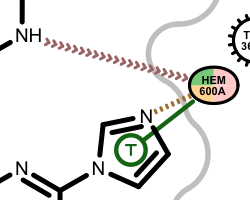
pi-stacking
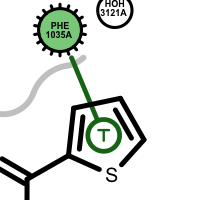
t-stacking
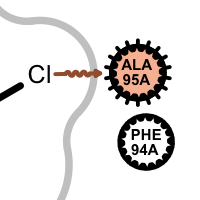
halogen bond
If a residue participates in more than one type of interactions than the residue glyph has multiple colors (see examples below).
Example of of residues contributing to more than one types of interactions 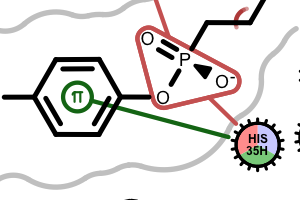
Hydrogen position optimization
Since the interaction perception dependents on the position of hydrogens, it is highly recommended to optimize those positions prior to perceiving the interactions. The two images below reveal the effect of optimizing the hydrogen bond network in a protein-ligand complex: less atom clash(es) and more hydrogen bond interaction(s).

|

|
original complex downloaded from PDB Database (PDB 1D3H) |
complex after optimizing hydrogen positions |
See also
OEPlaceHydrogens function in the OEChem TK manual
Protein Preparation chapter in the OEChem TK manual
See also in OEChem TK manual
Theory
Biopolymers chapter
Protein Preparation chapter
API
OEPerceiveInteractionHints function
OEPlaceHydrogens function
See also in OEDepict TK manual
Theory
Molecule Depiction chapter
API
OEImage class
OEImageFrame class
See also in GraphemeTM TK manual
Theory
Drawing a Molecule Surface chapter
API
OE2DActiveSiteDisplay class
OEDrawActiveSiteLegend function
OEPrepareActiveSiteDepiction function
OERenderActiveSite function