OEDrawActiveSiteLegend
void OEDrawActiveSiteLegend(OEDepict::OEImageBase &image,
                            const OE2DActiveSiteDisplay &adisp,
                            const OE2DActiveSiteLegendDisplayOptions &opts)
Draws legend for active site interaction map.
- image
The image on which the color force field legend is drawn.
- adisp
The OE2DActiveSiteDisplay object that holds the data necessary to depict the interactions of an active site.
- opts
The OE2DActiveSiteLegendDisplayOptions object that determines how the legend is depicted.
The following code snippet shows how to use the OEDrawActiveSiteLegend
function. The image created is shown in
Figure: Example of using the OEDrawActiveSiteLegend function.
# initializing adisp OE2DActiveSiteDisplay object

rows, cols = 2, 4
opts = oegrapheme.OE2DActiveSiteLegendDisplayOptions(rows, cols)

image = oedepict.OEImage(600, 150)
oegrapheme.OEDrawActiveSiteLegend(image, adisp, opts)
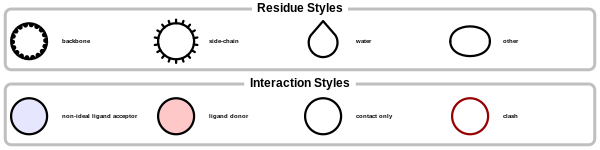
Example of using the OEDrawActiveSiteLegend function
Note
The OEDrawActiveSiteLegend function renders
only those residue “glyphs” that are used to depict the interactions
of the given active site when calling the OERenderActiveSite
function.
See also
Code Example
Visualizing Protein-Ligand Interactions OpenEye Python Cookbook recipe