Track Data Source at a Glance (March 1, 2023)
What you will learn: Easily track data sources using color scheme in Orion spreadsheets.
Easily keep track of data sources with Orion’s color-coded spreadsheet. Instantly differentiate between user-added data and existing-dataset data or floe-generated data.
Orion’s spreadsheet uses a color scheme to differentiate between data that was present in the original file used to create a dataset and data added by a floe versus data added by the user. This allows for easy identification of the source of the data in the spreadsheet.
White background: Columns containing data from the original file and added by a floe.
Tan background: Columns containing data added by the user.

Columns with a white background were calculated by the floe. In contrast, columns with a tan background were added by the user.
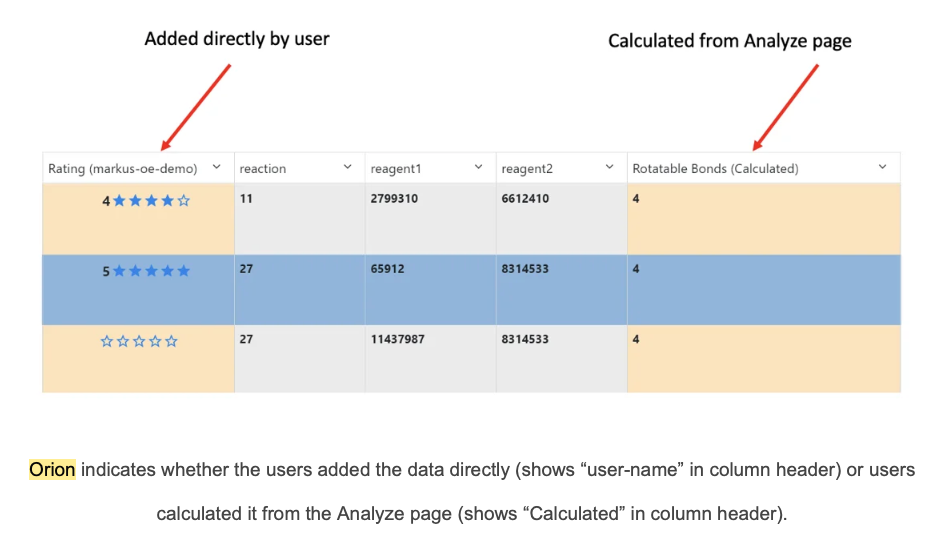
Orion indicates whether the users added the data directly (shows username in column header) or users calculated it from the Analyze page (shows “Calculated” in column header).