Surfaces
In Spicoli, the surface is presented as a first-class object, i.e., an
object in its own right, named OESurface. This
presentation requires a minimalist definition similar to the way
OEChem represents molecules as a collection of atoms and
bonds. Basically, both OESurfaces and
OEMolBases represent a graph in computer
memory.
An OESurface provides two ways of retrieving
data. The first is a set of methods that will return a copy of the
entire underlying data array,
e.g. GetVertices. The
second is a set of methods that allow random access directly into the
array of data,
e.g. GetVertex. Basic usage
of both will be shown for vertices and triangles.
Vertices
The simplest datum in a surface is the vertex: a set of (x, y, z)
coordinates. Vertices are stored internally as an array of large
enough to hold GetNumVertices() * 3 floats. Figure 1 shows how equivalent dimensions are stored at
every third place in the array:

Figure 1
Arrangement of coordinates in the vertices array
A copy of this array can be obtained using the code fragment in
Listing 1, where surf
is a OESurface object.
Listing 1: Example of retrieving the coordinates of all the vertices
OEFloatArray coords = new OEFloatArray(surf.GetNumVertices()*3);
surf.GetVertices(coords);
For direct access to the vertex array use
OESurface.GetVertex. Listing
2 is a code fragment
that shows how to iterate over all the vertex coordinates of a
surface.
Listing 2: Example of iterating over all vertices
OEFloatArray vert = new OEFloatArray(3);
for(int i=0; i < surf.GetNumVertices(); ++i)
{
    surf.GetVertex(i, vert);
}
Triangles
A triangle in Spicoli is a set of three vertices. However, it is important that the order of these vertices be locally consistent. To maintain this consistency vertices of the triangles are defined in a clockwise fashion.
Consider the two triangles in Figure 2 defined by
the vertices A, B, C, D. The triangle on the left is defined by
the set (A, B, C). The triangle on the right is defined by the set
(D, B, A). Also notice how the edge AB is defined in both
triangles but in opposite order. This reversal of order in the two
definitions is a direct consequence of the clockwise ordering rule.
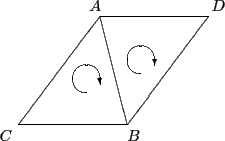
Figure 2
Two adjacent triangles in a surface
All the methods of construction described in this document obey this rule. A surface that does not follow this rule can still be operated on by Spicoli, but it is not considered a canonical surface and some results may be incorrect or ambiguous.
Spicoli stores triangle vertices as an integer array large enough to
hold GetNumTriangles() * 3 unsigned integers. Each integer is an
index into the vertex array explained in
Vertices. Listing
3 is a code fragment that
will retrieve a copy of the entire triangles array.
Listing 3: Example of retrieving the indices of all the triangles
OEUIntArray triangles = new OEUIntArray(surf.GetNumTriangles()*3);
surf.GetTriangles(triangles);
For direct access to the triangles array use
OESurface.GetTriangle. Listing
4 is a code fragment
that shows how to iterate over all the triangles of a surface.
Listing 4: Example of iterating over all triangles
OEUIntArray tri = new OEUIntArray(3);
for(int i=0; i < surf.GetNumTriangles(); ++i)
{
    surf.GetTriangle(i, tri);
}
Normal Vectors
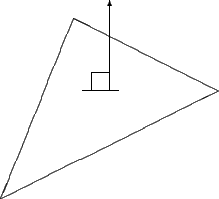
The emphasis on triangle vertex ordering is to support the notion of the triangle’s front and back. The front of the triangle is the side that the vertices appear ordered in a clockwise fashion. Surface normals can then be calculated to point out from the front of the triangle (and conversely from the back of the triangle).
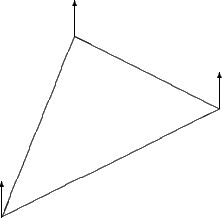
The OESurface also supports vertex normals since vertices are often easier to work with analytically. Vertex normals are calculated by averaging all of the face normals of triangles of which the vertex is a part. The following figures contrasts the differences between face and vertex normals respectively.
|
|
Figure 3 |
Figure 4 |
Face normals point out of perpendicular to the triangle |
Vertex normals are the average of the vertices face normals |
Vectors in Spicoli are represented by three floating point
values. Normal vectors are always of unit length. They can be
calculated and stored on a OESurface object by
invoking the free functions OECalculateNormals
and OECalculateFaceNormals for vertex and face
normals, respectively.
It is important to remember that the size of a normal array is
determined by whether it is a face or vertex normal. For example the
size of the vertex normal array is GetNumVertices() * 3
floats. While the size of the face normal array is
GetNumTriangles() * 3 floats.
Specific Data
Specific data is any information that can be derived from the surface alone but not from any one triangle or vertex. Currently these properties include the following:
- Curvature
(
float) Solvent accessibility of the vertex- Distance
(
float) The Euclidean distance to the vertex from another portion of the surface
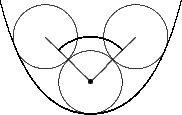
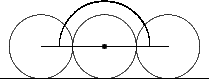
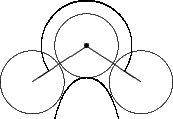
Curvature follows a pragmatic computational chemistry definition. It is a property of solvent molecules, represented as spheres, packed onto the surface. Figures 5, 6, and 7 demonstrate the two dimensional case of how solvent molecules are packed onto a surface. The first sphere is mapped adjacent to the vertex using the vertex’s normal. Two more spheres are then packed adjacent to the surface and the starting sphere. The angle between these two spheres is used to calculate the accessibility to solvent of the initial sphere using the following formula:
Where \(\theta\) is in radians. For this simple case the angle is also a measure of the surface curvature, hence the name. In three dimensions steradians are required to accomplish the same functional form:
Where \(\theta\) is in steradians. Therefore, a vertex’s “curvature” falls into a range with the following bounds:
- -100.0:
Solvent that is completely secluded within the surface
- 0.0:
Flat portion of the surface
- 100.0:
Solvent that is completely detached from the surface
|
|
|
Figure 5 |
Figure 6 |
Figure 7 |
Concave |
Flat |
Convex |
Distance is listed as specific data because it can be derived as the distance between different portions of the surface. This can be useful for measuring the thickness of a volume that is enclosed by a surface. Distances can also be measured to other arbitrary objects as well, such as molecules and other surfaces.
Associative Data
Associative data is not inherent from the first-class object definition of a surface. Instead, they are properties mapped onto the surface. Spicoli provides the following associative data arrays:
- Atoms
(
unsigned int) Atom index for the vertex- Color
(4
floatsor 4unsigned chars) Color of the vertex- Potential
(
float) Electrostatic potential at the vertex
To map chemical properties onto a surface it is useful to know which
atoms are responsible for portions of the surface. When a surface is
constructed from a molecule, a data array containing the corresponding
atom index for each vertex is created. An atom’s index can be obtained
from the OEAtomBase.GetIdx method and is unique
over the molecule. Refer to the OEChem manual for more information
about atom indices.
To display chemical properties it is often useful to render them as
either discrete colors or a spectrum of colors. The color data array
allows the user to set a color for every vertex in the surface. When
the surface is then read into a visualizer, such as Vida, the
properties can easily be interpreted. Every vertex has the associated
values: red, green, blue, and alpha. Alpha is the transparency of the
vertex. If any value is retrieved as a float, then that value will
range from 0 to 1 inclusive. If retrieved as an unsigned char, the
value will range from 0 to 255 inclusive.
Electrostatic potentials can be calculated and displayed on a surface. This can be done with current OpenEye tools such as Zap.
The potentials array is essentially an array of floats the user can use to record analytical data for each vertex.