OERenderShapeOverlap
Link |
Description |
|---|---|
render shape overlap |
|
render shape overlap into separate images |
void OERenderShapeOverlap(OEDepict::OEImageBase &image,
                          const OEShapeOverlapDisplay &odisp)
Renders the shape overlap between a reference and a fit molecule.
- image
The image on which the fit molecule is rendered along with the property map and the molecule surface of the reference molecule representing the shape overlap.
- odisp
The OEShapeOverlapDisplay object that holds the data necessary to depict the shape overlap between the reference and the fit molecules.
The following code snippet shows how to use the
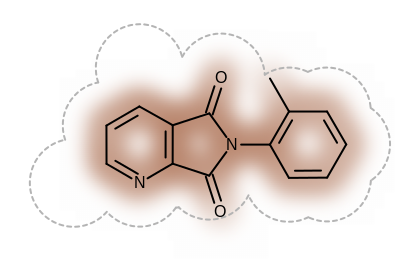
OERenderShapeOverlapfunction. The image created is shown in Table: Example of using the OERenderShapeOverlap function.OEColorForceField cff = new OEColorForceField(); cff.Init(OEColorFFType.ImplicitMillsDean); OEShapeQueryDisplay qdisp = new OEShapeQueryDisplay(refmol, cff); OEShapeOverlapDisplayOptions opts = new OEShapeOverlapDisplayOptions(); opts.SetTitleLocation(OETitleLocation.Hidden); OEPen arcpen = new OEPen(oechem.getOEGrey(), oechem.getOEGrey(), OEFill.Off, 2.0, OEStipple.ShortDash); opts.SetQuerySurfaceArcFxn(new OEDefaultArcFxn(arcpen)); OEShapeOverlapDisplay odisp = new OEShapeOverlapDisplay(qdisp, fitmol, opts); OEImage image = new OEImage(420.0, 280.0); oegrapheme.OERenderShapeOverlap(image, odisp);Note
The shape overlap between the reference and the fit molecule is visualized by using a property map (OE2DPropMap), i.e., a 2D grid, laid underneath the molecule structure, where the cells of the grid that are colored brown indicate good 3D shape overlap between the reference and the fit molecules. Additionally, clashes between the molecular graph of the fit molecule and 2D molecule surface of the reference structure imply shape mismatch in 3D.
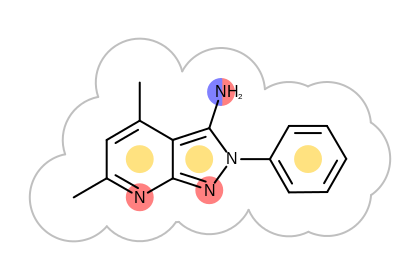
Example of using the OERenderShapeOverlap function (A) reference molecule (shape query)
(B) fit molecule


shape query depicted by the OERenderShapeQuery function
shape overlap depicted by the OERenderShapeOverlap function
Warning
When calling the
OERenderShapeOverlapfunction no overlay is performed to maximize the color overlap between the reference and the fit molecule, i.e., the function simply calculates the shape overlap using the given 3D coordinates.
void OERenderShapeOverlap(OEDepict::OEImageBase& molimage,
                          OEDepict::OEImageBase& overlapimage,
                          const OEShapeOverlapDisplay& odisp);
Renders the shape overlap between a reference and a fit molecule into to separate images.
- molimage
The image on which the fit molecule is rendered along with the surface of the reference molecule.
- overlapimage
The image on which the property map is rendered representing the shape overlap.
- odisp
The OEShapeOverlapDisplay object that holds the data necessary to depict the shape overlap between the reference and the fit molecules.
Note
The background of the molecule image is transparent. By superimposing the two images (molecule image on top), the result would be as visualizing the shape overlay in one image.
See also
OERenderShapeQueryfunction
OERenderColorOverlapfunctionCode Example
Visualizing Shape and Color Overlap OpenEye Python Cookbook recipe