OEDrawBFactorMapLegend
bool OEDrawBFactorMapLegend(OEDepict::OEImageBase &image,
                           const OE2DActiveSiteDisplay &adisp)
Draws the color gradient that is used to visualize B-factor information of
an active site by the OERenderBFactorMap function.
- image
The image in which the color gradient is drawn.
- adisp
The OE2DActiveSiteDisplay object that holds the data necessary to depict the B-factor information of an active site.
Example:
// initailize OE2DActiveSiteDisplay

OEImage cgimage(300.0, 100.0);
OEDrawBFactorMapLegend(cgimage, adisp);
OEWriteImage("DrawBFactorMapLegend.svg", cgimage);
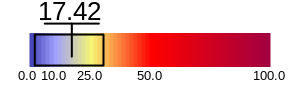
Example of using the OEDrawBFactorMapLegend function
See also
OERenderBFactorMapfunctionOEDrawColorGradientfunction
Code Example
Visualizing Protein-Ligand B-Factor OpenEye Python Cookbook recipe