OEDrawROCSScores
void OEDrawROCSScores(OEDepict::OEImageBase& image,
                      const std::vector<double>& scores)
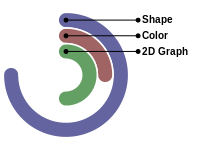
Renders the scores into a radial graph.
- image
The image on which the radial graph of the scores is drawn.
- scores
The vector of scores. The scores will expected in the following order - shape overlap score - color overlap score - 2D similarity score (optional)
Note
All scores are expected to be in the range of \([0.0, 1.0]\). This \([0.0, 1.0]\) range is transformed to \([0.0^{\circ} - 360.0^{\circ}]\) angles when representing the scores in the diagram.
image = oedepict.OEImage(200, 150)
scores = oechem.OEDoubleVector([0.75, 0.25, 0.50])
oegrapheme.OEDrawROCSScores(image, scores)
oedepict.OEWriteImage("DrawROCSScores.png", image)

Example of using the OEDrawROCSScores function
Code Example
Visualizing Shape and Color Overlap OpenEye Python Cookbook recipe