ROCSReport
Overview
RocsReport is a utility program that takes the hit molecule file generated by ROCS and creates a multi-page PDF document that visualizes the hit structures along with their score information. The layout of the generated report is depicted in Table: Example of a multi-page document generated by the rocs_report program
page 1 (front page) |
page 2 |
page 3 |
|---|---|---|
|
|
|
Report File
Front Page
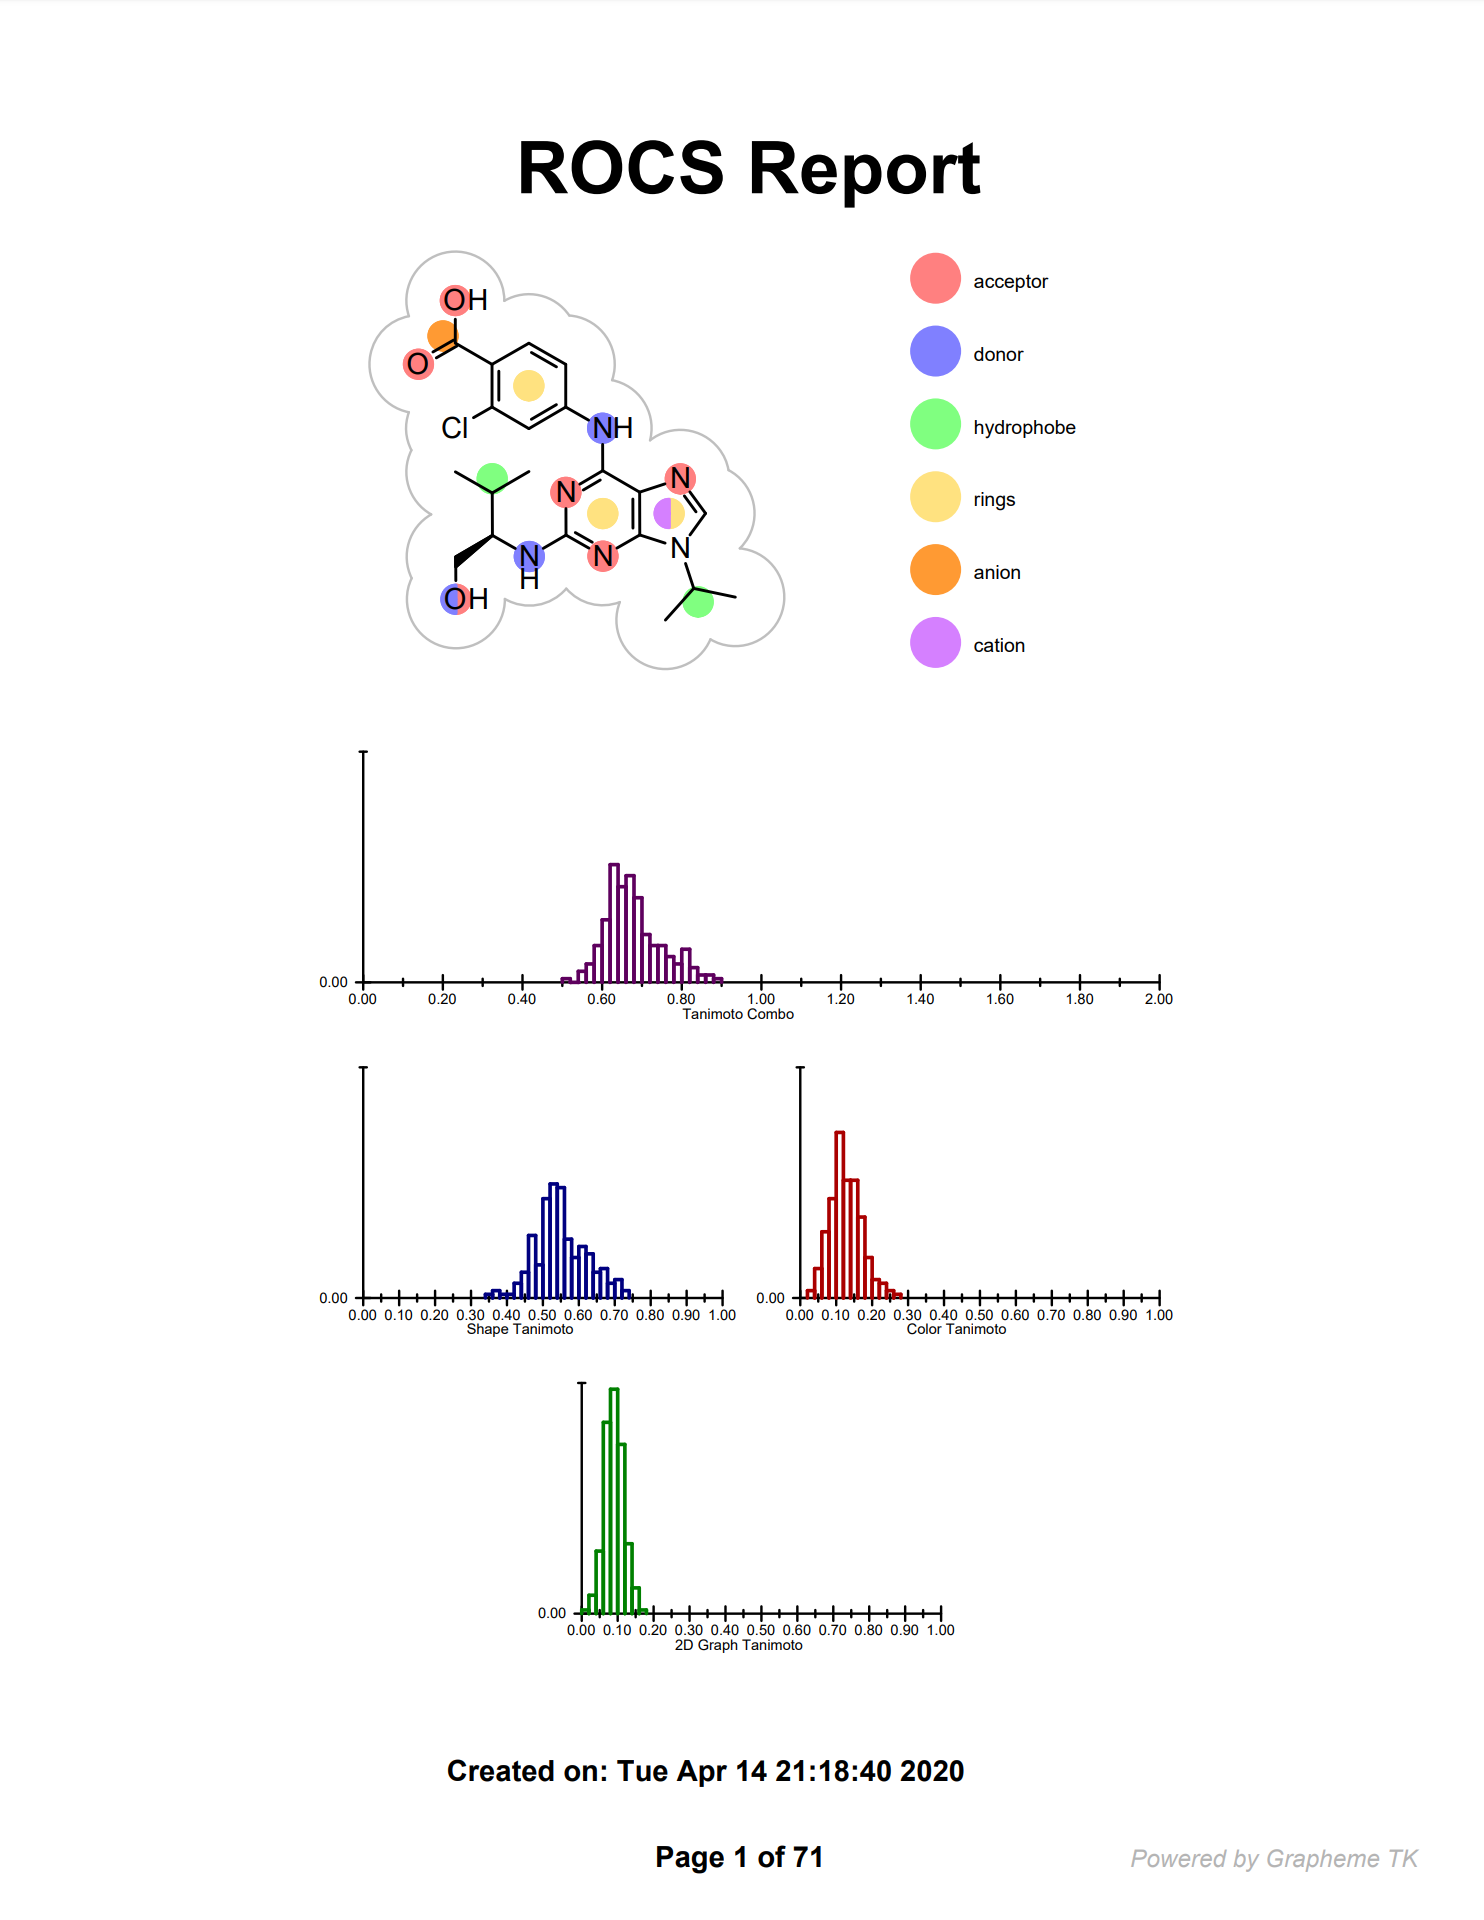
The front page of document summarizes information about the ROCS search:
It shows the 2D representation of the query molecule. (See Figure: Query in 2D). The 2D coordinates of the query displayed in the report are driven by 3D coordinates read from the input file. The atom colors of the 3D query are projected into the 2D molecular graph and visualized by filled circles. Each atom color type is associated with a color and the legend of the color atoms is display along the 2D query structure. The arcs around the query represents the 2D surface of the molecule. The 3D representation of same query along with its color atoms is shown in Figure: Query in 3D.
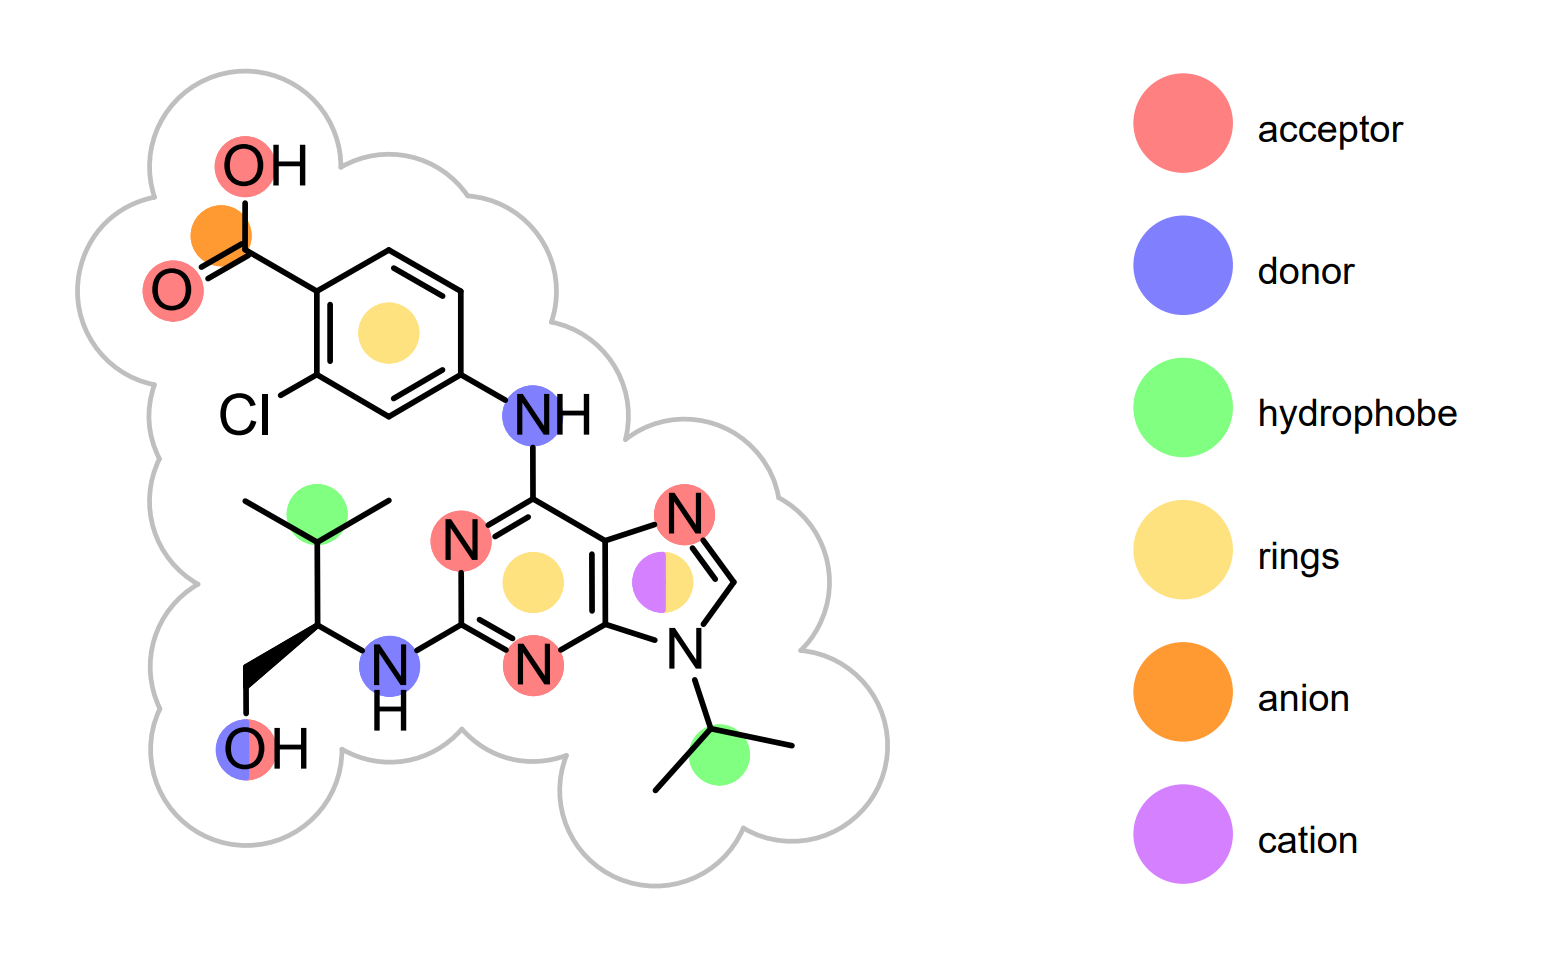
Query in 2D
Example of the 2D visualization of the query structure with color atoms on the front page of a ROCS report
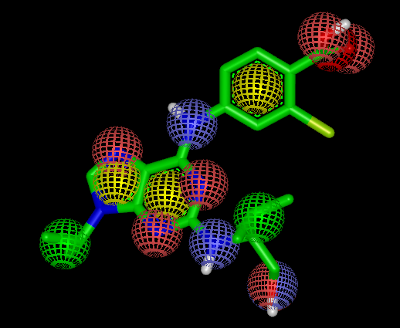
Query in 3D
Example of the 3D visualization of the query structure with color atoms in vROCS
See also
Color Features section
OERenderShapeQuery function in the Grapheme TK manual.
Warning
rocs_report currently cannot visualize ROCS outputs for multi-conformer queries.
The front page also displays the histogram of the score distribution of the input hit molecules for the following scores:
Tanimoto Combo score
Shape Tanimoto score
Color Tanimoto score
2D Similarity Tanimoto score
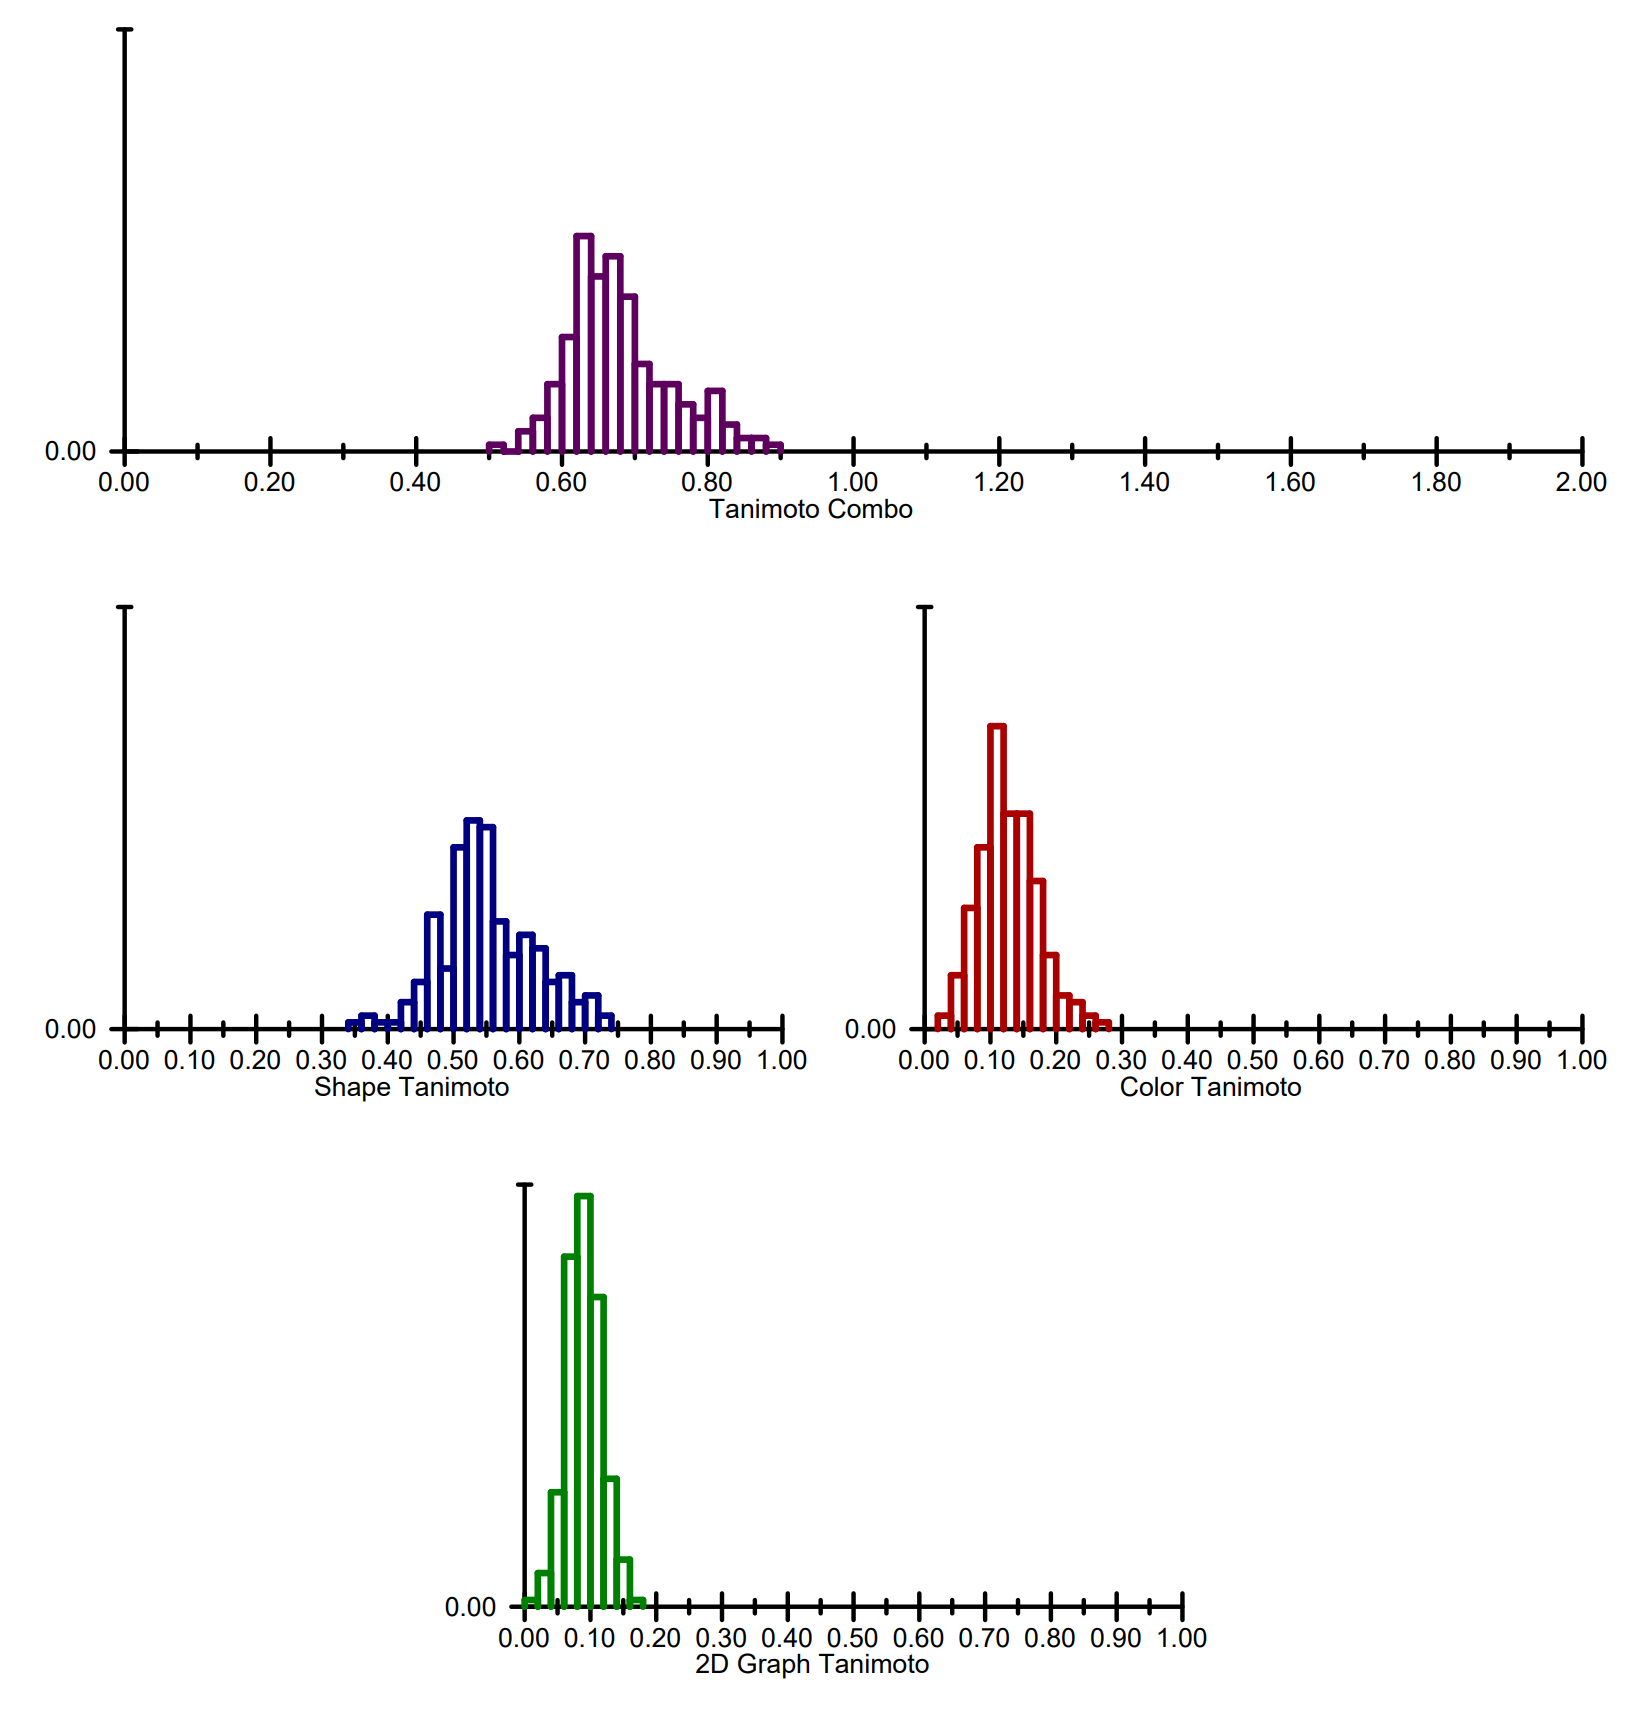
The histograms of the score distribution
The first three scores are calculated by ROCS and read from the input file. The 2D similarity scores are calculated on-the-fly by the rocs_report program using the tree fingerprints of the OEGraphSim TK ([GraphSim]).
Visualizing Shape and Color Overlays
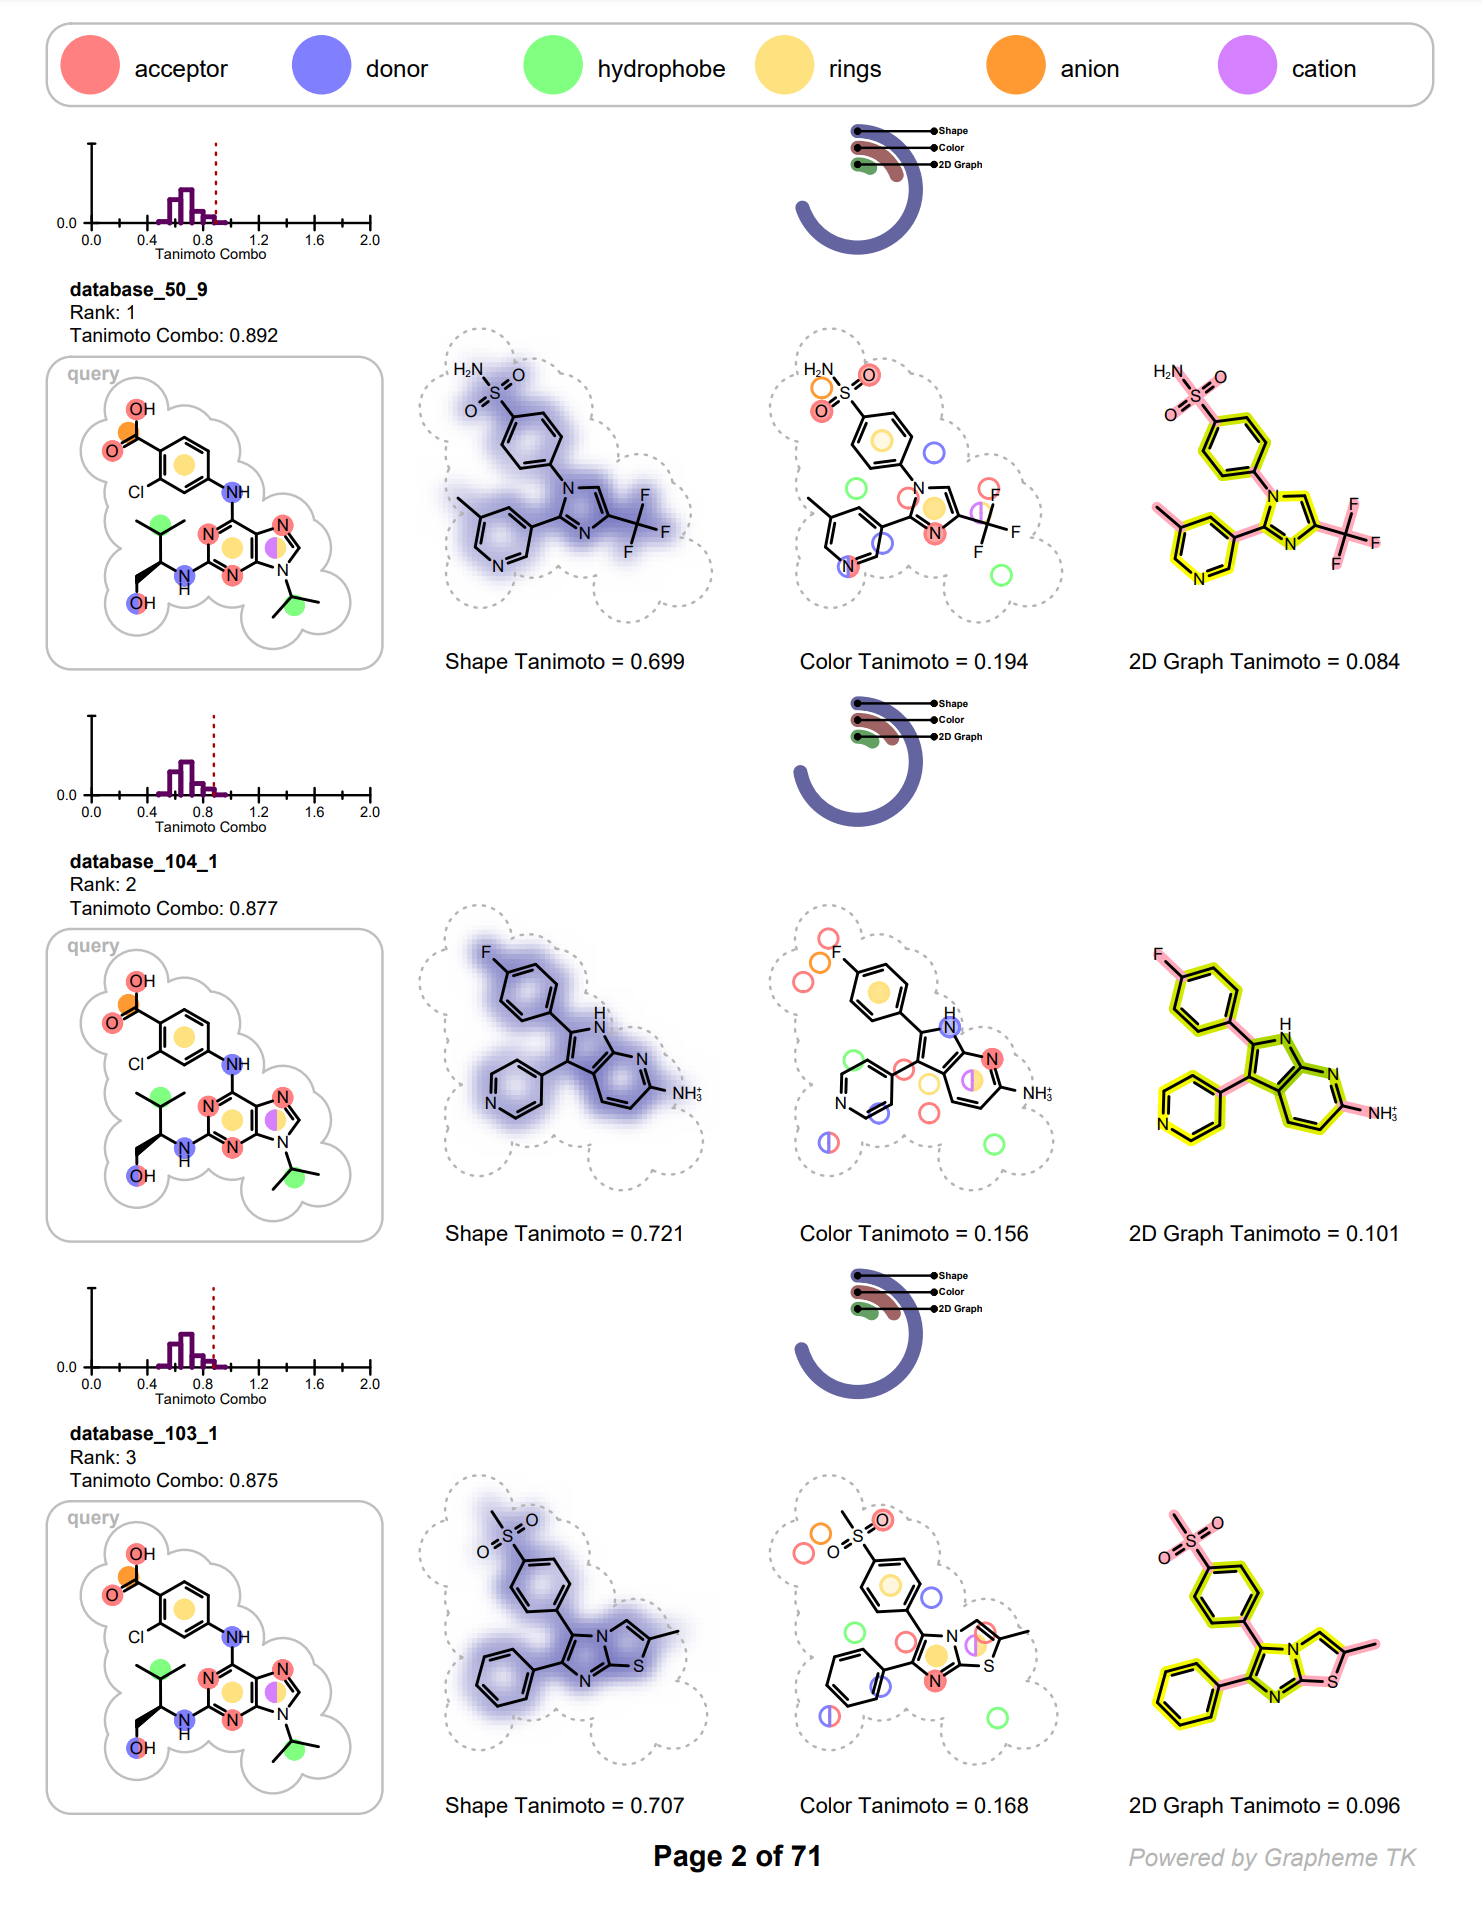
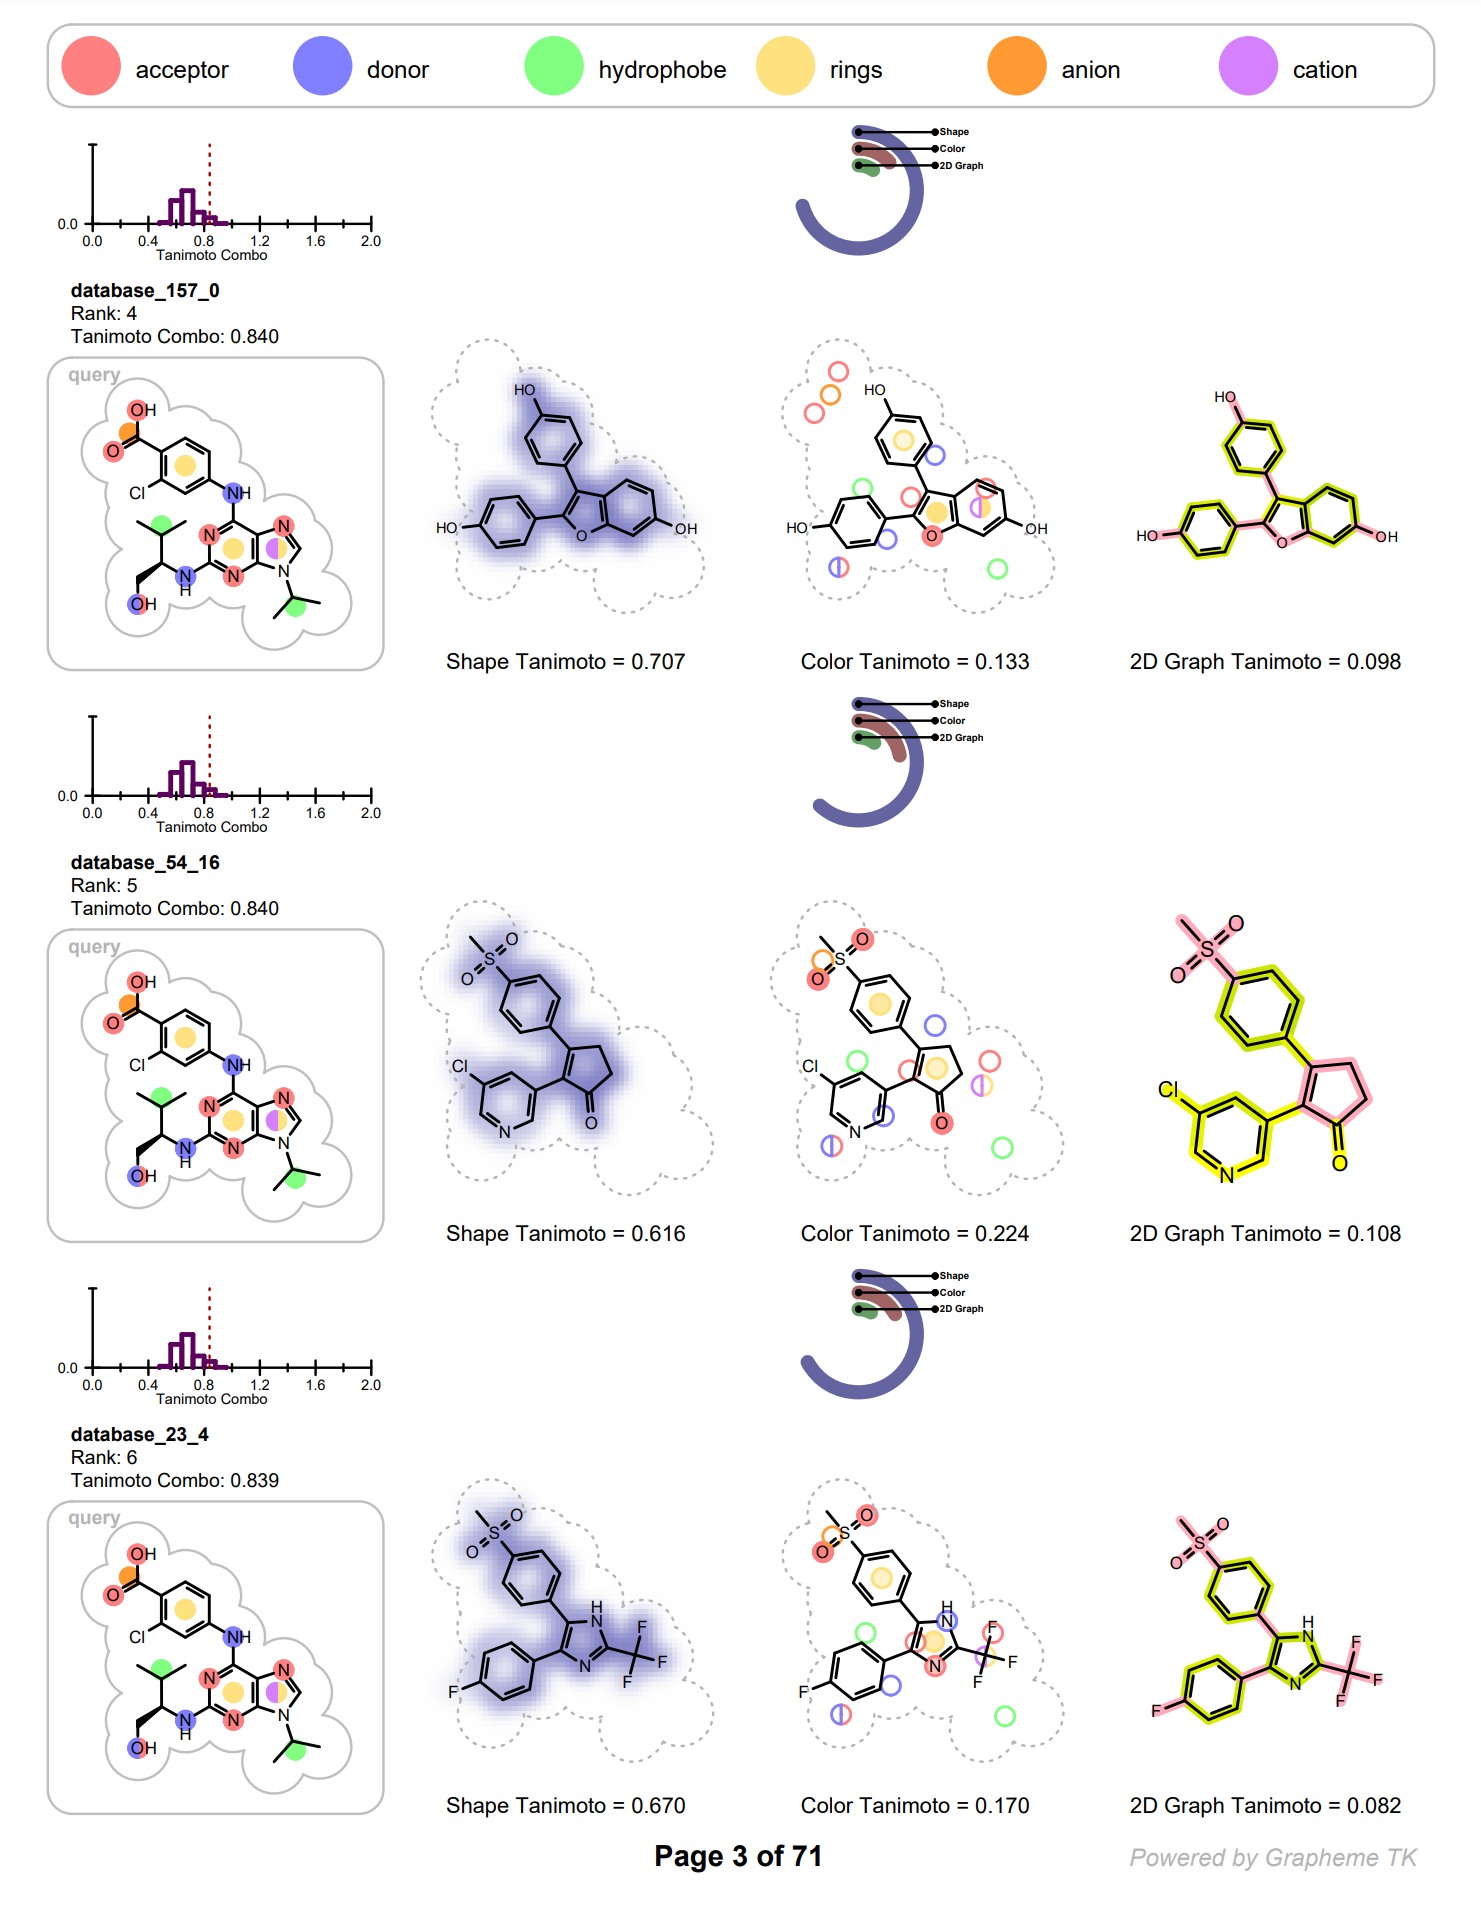
Each row on the following pages represents information of an individual hit structure read from the input file. See example in Figure: Example of the 2D visualization of a hit structure. The 2D coordinates and layout of the hit molecule are calculated based on the 3D alignment of the hit and the query structures. The corresponding 3D overlay between of the hit molecule and the query is show in Figure: Example of 3D overlay between the query and hit structure.
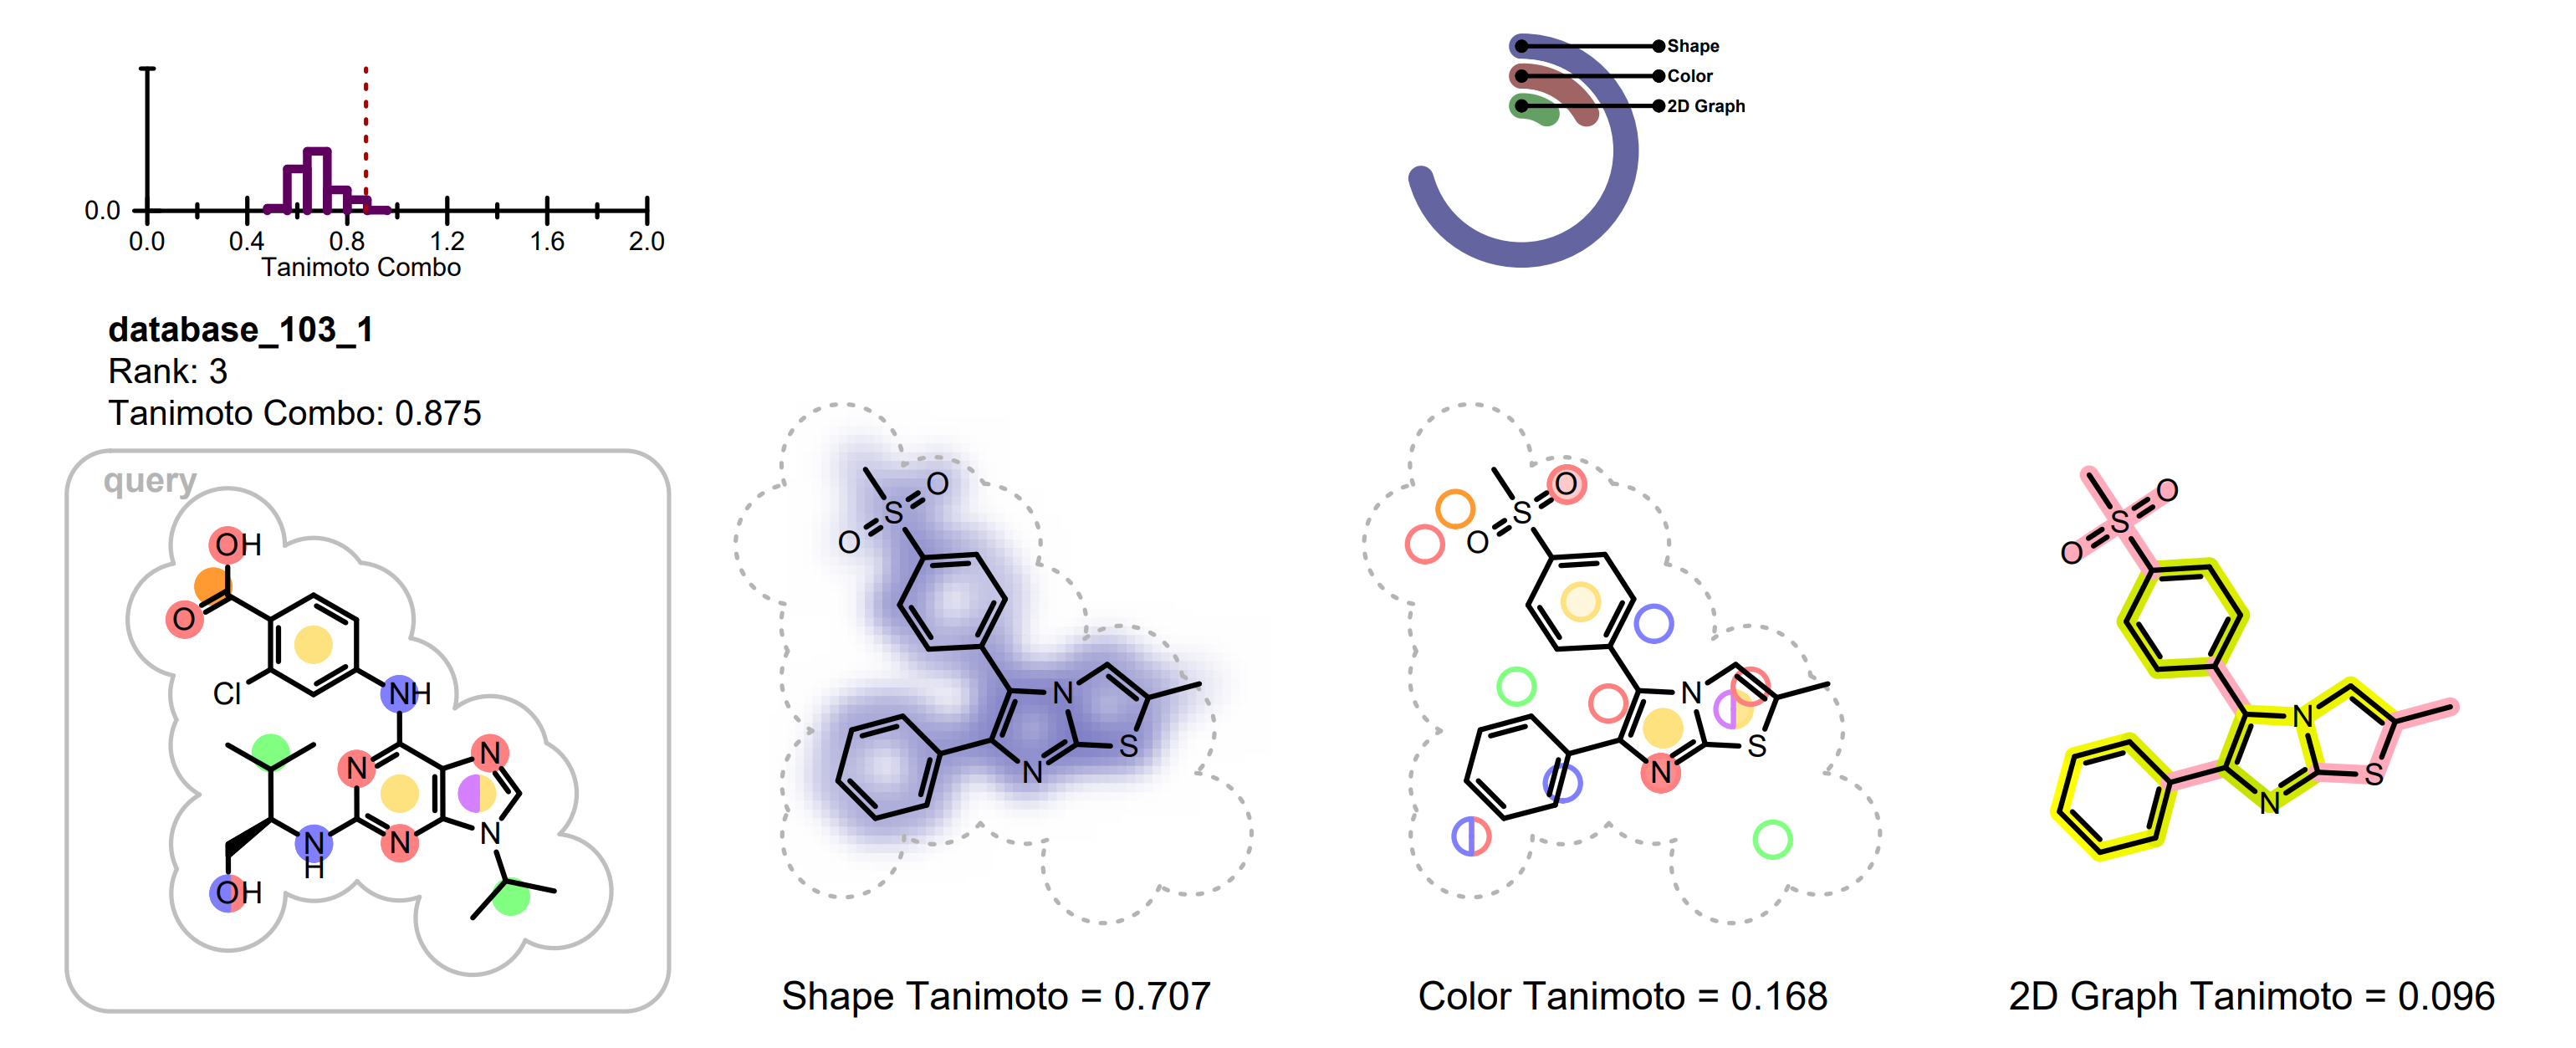
Example of the 2D visualization of a hit structure
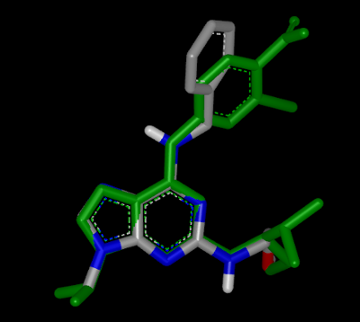
Example of 3D overlay between the query (colored by green) and hit structure (colored by atomic number)
In each row the query molecule among with distribution of the TanimotoCombo scores is depicted. On the histogram, the position of the score of the given hit is marked with a dotted red line (see Figure: Example of the 2D visualization of a hit structure).
The hit structure is depicted three times visualizing the following information:
shape overlap between the hit and the query
color atom overlap between the hit and the query
2D graph similarity between the hit and the query
The shape overlap between the hit and the query is visualized by using a property map, i.e. a 2D grid, laid underneath the molecule structure, where the cells of the grid that are colored blue indicate good 3D shape overlap between the query and the hit structure. Additionally, a clash between the hit structure and 2D molecule surface of the query structure indicates shape mismatch in 3D. (See Figure: Example of visualization of shape overlay).
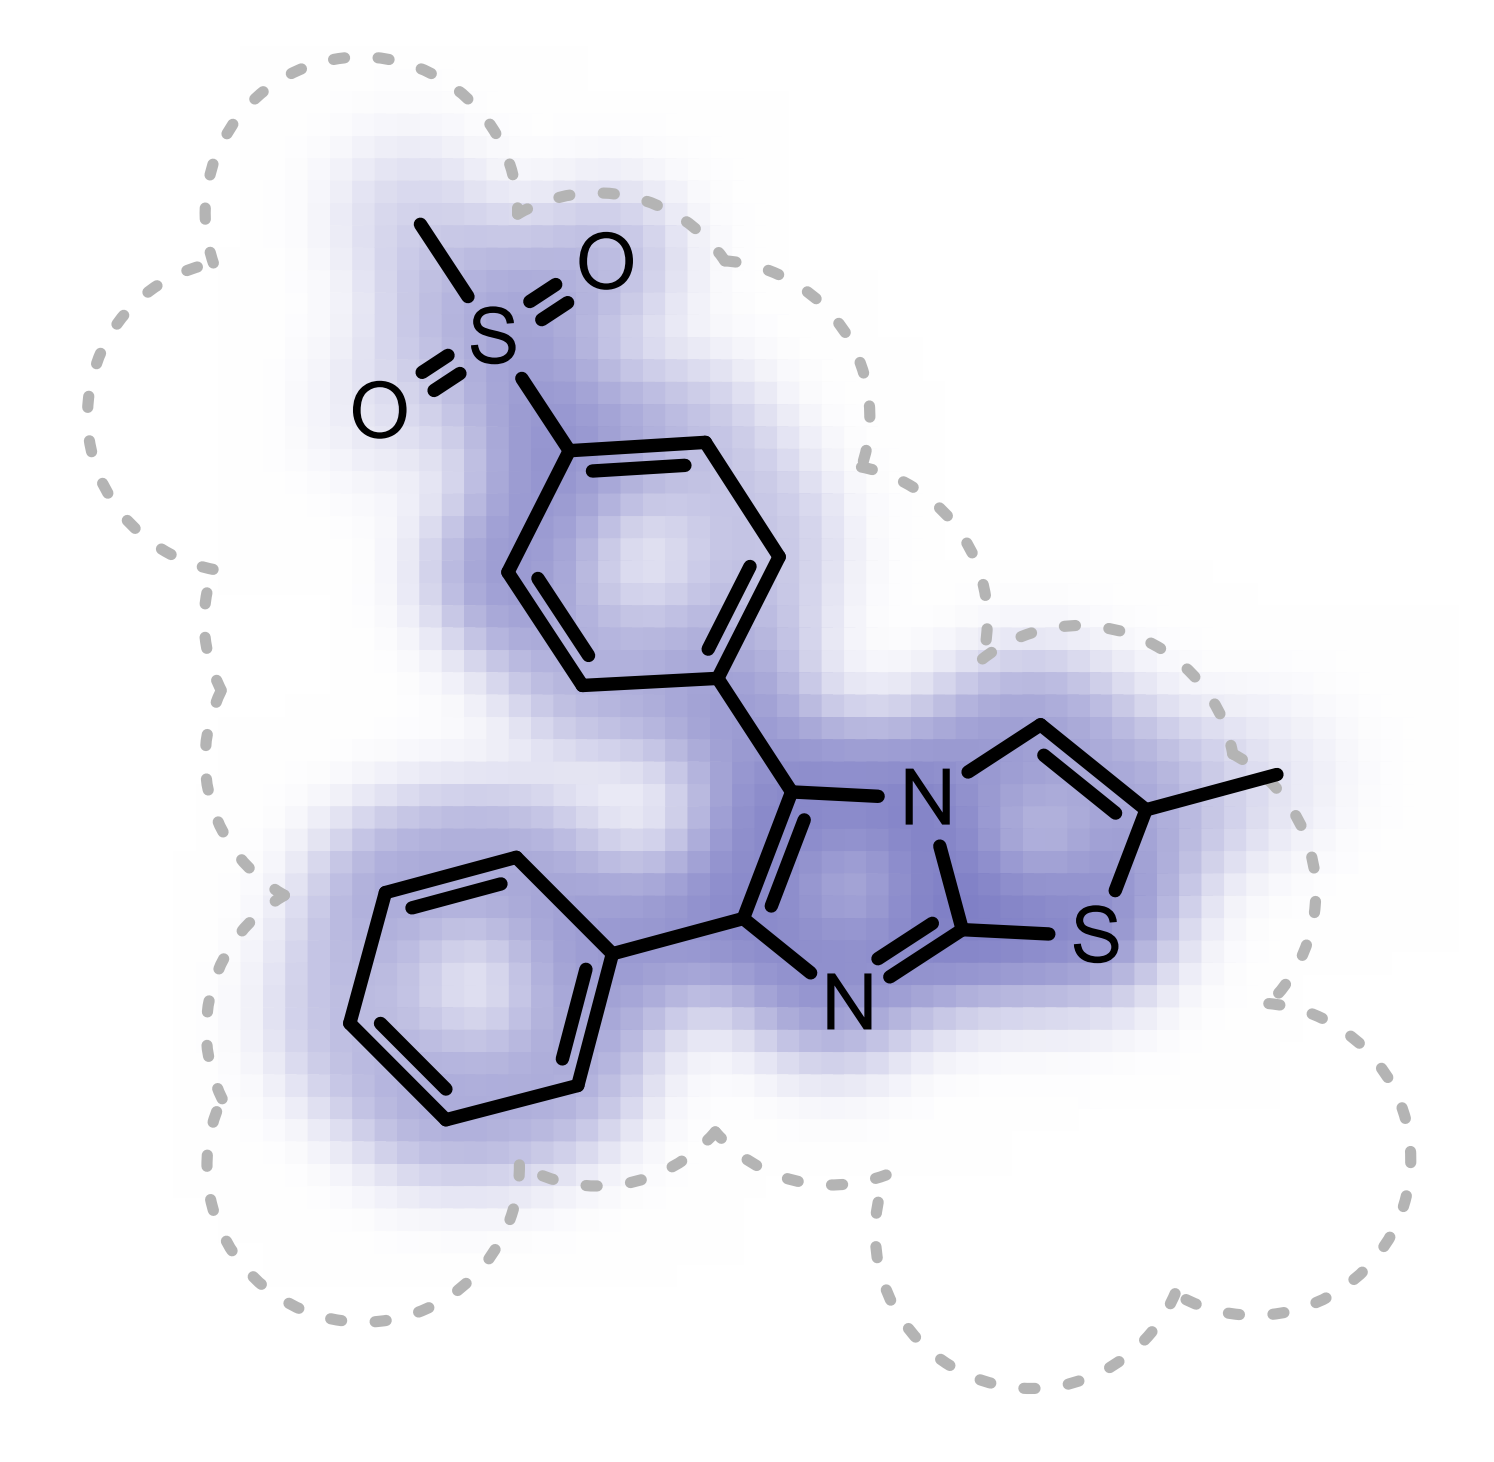
Example of visualization of shape overlay
See also
Shape Theory section
OERenderShapeQuery function in the Grapheme TK manual.
The color atom overlap between the hit and query are visualized with circles. Each circle corresponds to a color atom in the query molecule. The color of the circle indicates the fitness of the color atom match in 3D. The lighter the color, the smaller the overlap between the query and hit color atoms in 3D. Unfilled circles represent unmatched query color atoms. If there is a good color atom match exist for a query color atom in 3D, then the circle representing the color atom is positioned to the matching fit color atom in 2D.
(See Figure: Example of visualization of color atom match).
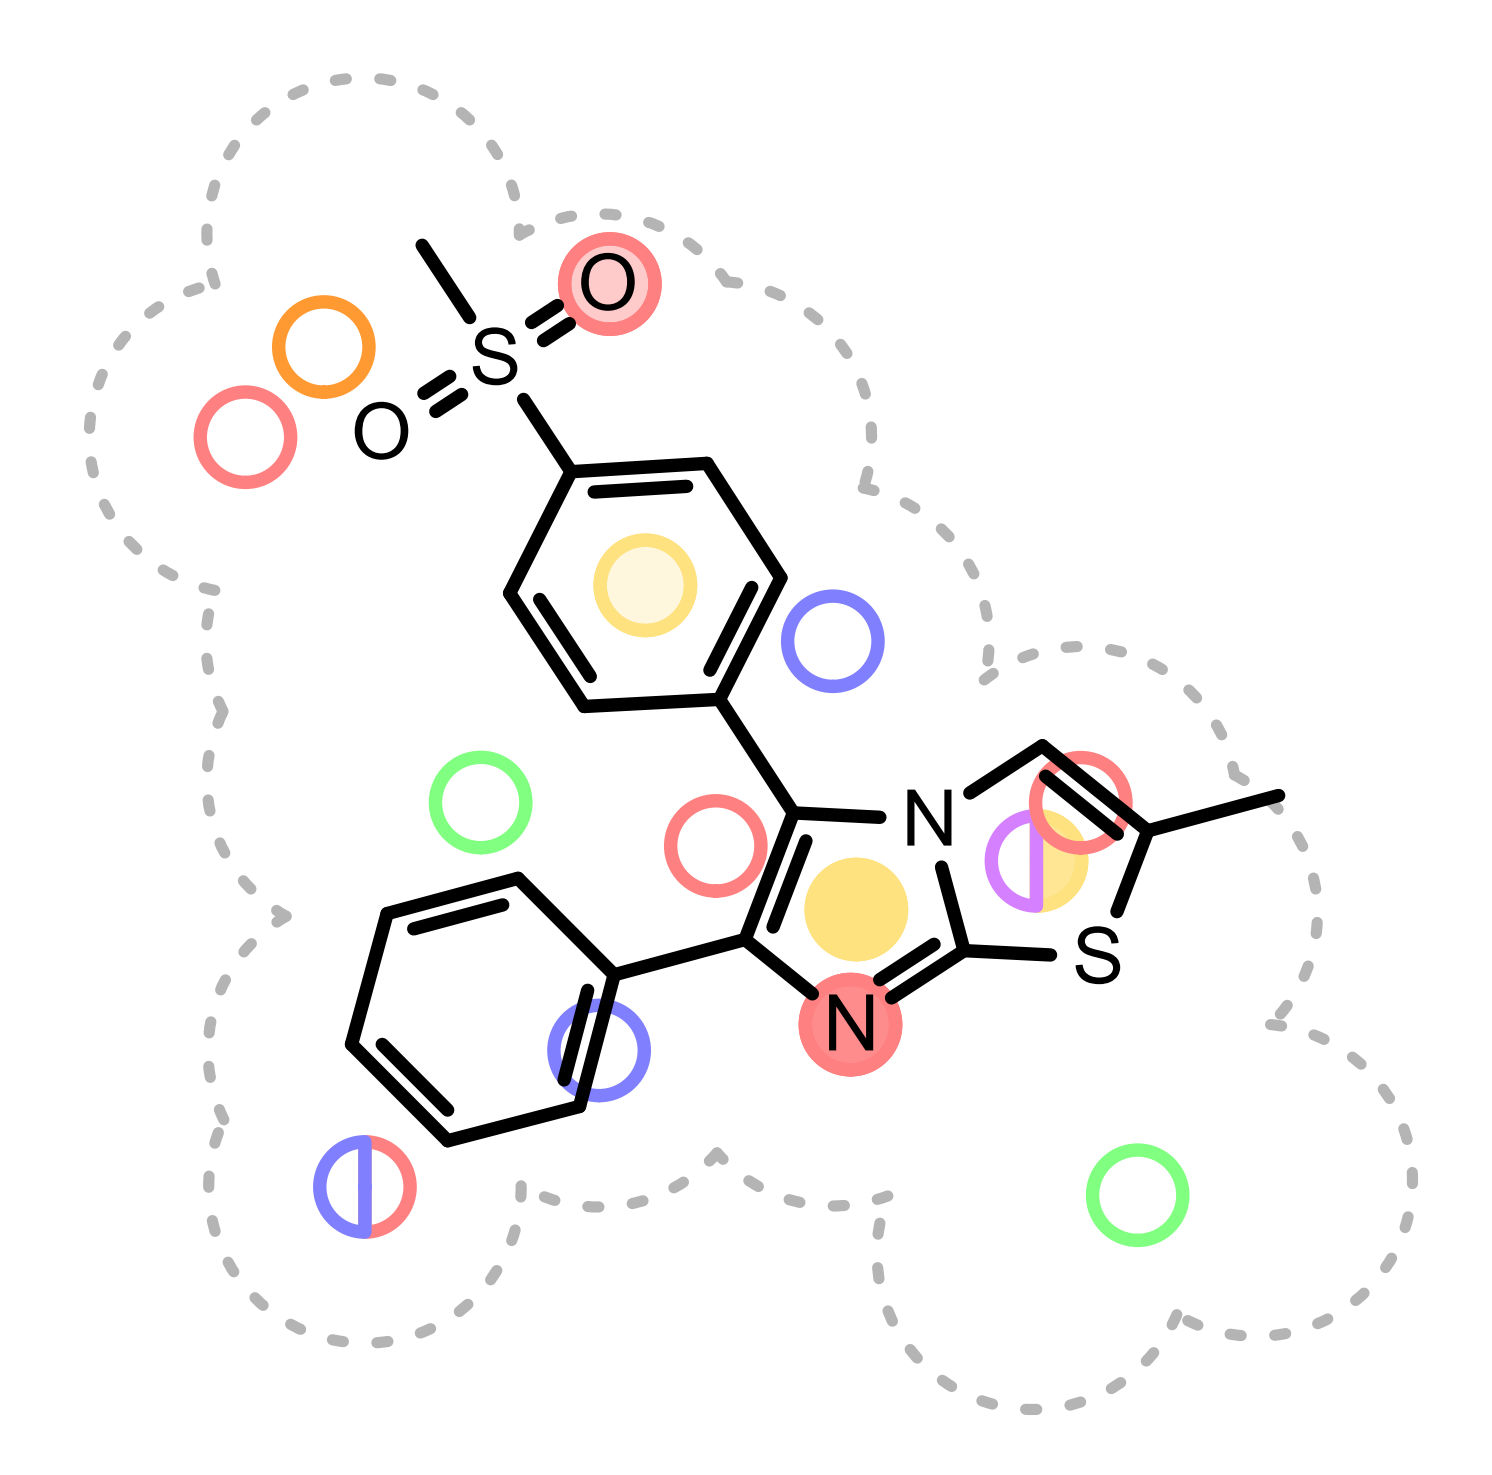
Example of visualization of color atom match
See also
Color Features section
OERenderShapeOverlap function in the Grapheme TK manual.
Visualizing 2D Graph Similarity
The 2D graph similarity is visualized by using a linear color gradient to highlight molecular similarity or dissimilarity between the hit and query structures. After calculating the 2D molecule similarity score, the bonds of the hit molecule are colored based on how frequently they occur in molecular fragments that can be also detected in the query structure. The color pink is used to highlight parts of the hit molecule that are 2D dissimilar to the query structure. Where there is 2D similarity detected between the hit and the query, the “yellow to dark green” color gradient is used to highlight the bonds and the color gets greener and darker with increasing similarity. (See Figure: Example of visualization of 2D fingerprint similarity). The calculation of 2D similarity score and similarity visualization use the tree fingerprint type implemented in the OEGraphSim toolkit.
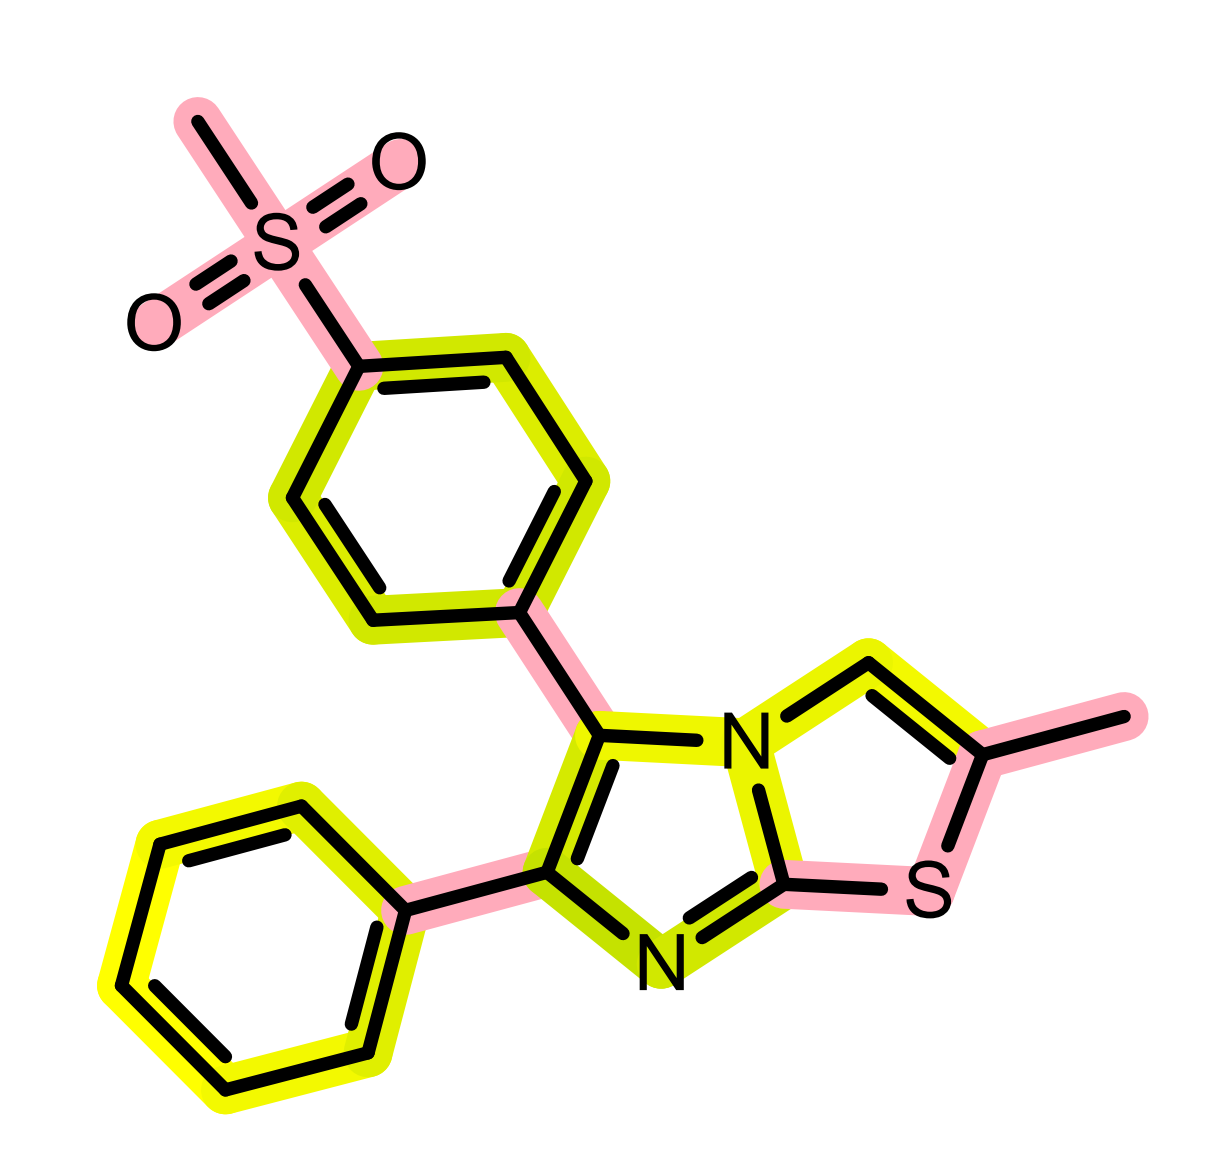
Example of visualization of 2D fingerprint similarity
The relevant score of the given hit structure is printed below the 2D molecular structure while the histogram of the score distribution is displayed above the 2D molecular structure. (see Figure: Example of the 2D visualization of a hit structure).
See also
The Python script that visualizes molecule similarity based on fingerprints can be downloaded from the
Command Line Help
A description of the command line interface can be obtained by executing rocs_report with the –help option.
prompt> rocs_report --help
will generate the following output:
Help functions:
  rocs_report --help simple      : Get a list of simple parameters
  rocs_report --help all         : Get a complete list of parameters
  rocs_report --help <parameter> : Get detailed help on a parameter
  rocs_report --help html        : Create an html help file for this program
Required Parameters
Optional Parameters
Input/Output Options
- -refmol <filename>
Reference i.e. query molecule. If omitted, the first molecule in “-in” is used as the reference. This parameter is not usually required since the ROCS hitlist includes the query molecule by default.
General Options
- -maxpages
Maximum number of results pages to output, including the title page. A value of 1 will only return the title page. Use 0 for no maximum.
[default = 0]
- -verbose
Triggers more messages
[default = true]