Drawing a Ligand-Protein Complex Surface
The previous chapter demonstrates how to draw and customize 2D
molecule surfaces.
Grapheme TK also provides a method that depicts a ligand-protein
complex in which the arcs of the 2D surface of the molecule are
annotated based on the distance between the accessible
surfaces of the ligand and the surrounding protein
(OEMakeAccessibleSurface).
Based on this calculation, the atoms of the ligand are
divided into four categories which are then inherited by the
corresponding arcs when the 2D molecule surface of the ligand is
drawn.
These four types are the following:
Solvent (OEDefaultSolventArcFxn)
A surface arc is depicted using the solvent style if the corresponding atom is accessible to a solvent. (See Figure: Example of the ‘solvent’ arc style)

Example of the ‘solvent’ arc style
Cavity (OEDefaultCavityArcFxn)
A surface arc is depicted using the cavity style if in the region of the corresponding atom, a cavity is detected between the ligand and the receptor molecule surfaces. The cavity is large enough to allow expanding the ligand in this region without bumping into the receptor. (See Figure: Example of the cavity arc style)
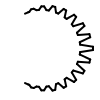
Example of the ‘cavity’ arc style
Void (OEDefaultVoidArcFxn)
A surface arc is depicted using the void style, if in the region of the corresponding atom a small interstice is detected between the ligand and the receptor molecule surfaces. (See Figure: OEDefaultBuriedArcFxn)
Example of the ‘void’ arc style
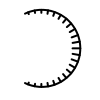
Buried (OEDefaultBuriedArcFxn)
A surface arc is depicted using the buried style, if in the region of the corresponding atom the ligand is tightly fit to the receptor. (See Figure: Example of the buried arc style)

Example of the ‘buried’ arc style
Note
Even though, Spicoli TK is used to generate the accessible surfaces of
the ligand and the receptor, no Spicoli TK license is required to call
the OEAddComplexSurfaceArcs function.
The following Listing 1 example show how
to display the surface of the ligand-protein complex.
After importing the ligand and the receptor structures, the
OEAddComplexSurfaceArcs function is called to
generate the accessible molecule surfaces (using Spicoli TK) and assign
the surface drawing styles (solvent, buried, void, or cavity)
for the atoms of the ligand.
These styles are the used to draw the arcs of the molecule surface
when the OEDraw2DSurface function is invoked.
The OEGetMoleculeSurfaceScale function is used
to reduce the scaling of the molecule in order to be able to fit
both the molecule diagram and the molecule surface into the image.
Listing 1: Example of complex surface drawing
void ImportMolecule(OEMolBase& mol, const std::string& filename)
{
  oemolistream ifs;
  if (!ifs.open(filename))
    OEThrow.Fatal("Unable to open %s for reading", filename.c_str());

  if (!OEReadMolecule(ifs, mol))
    OEThrow.Fatal("Unable to read molecule in %s", filename.c_str());

  OEAssignBondiVdWRadii(mol);
  OESuppressHydrogens(mol);
}

int main(int argc, char* argv[])
{
  if (argc != 3)
    OEThrow.Usage("%s <receptor> <ligand>", argv[0]);

  OEGraphMol receptor;
  ImportMolecule(receptor, argv[1]);
  OEGraphMol ligand;
  ImportMolecule(ligand, argv[2]);

  const unsigned width  = 450u;
  const unsigned height = 350u;

  OEAddComplexSurfaceArcs(ligand, receptor);

  OEPrepareDepictionFrom3D(ligand);
  OE2DMolDisplayOptions opts(width, height, OEScale::AutoScale);
  opts.SetScale(OEGetMoleculeSurfaceScale(ligand, opts));

  OE2DMolDisplay disp(ligand, opts);
  OEDraw2DSurface(disp);

  OERenderMolecule("DrawComplexSurface.png", disp);

  return 0;
}
The following snapshot (Figure: Dihydrofolate reductase)
displays the ligand of the 2w3a PDB complex in VIDA
with the accessible surface of the protein.
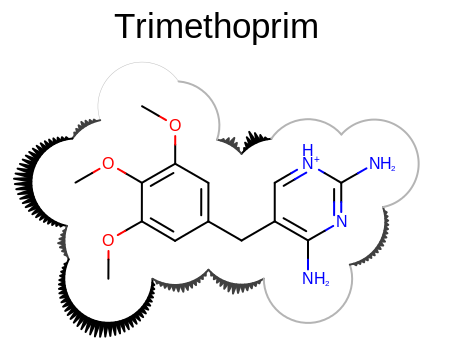
The image shown in the Figure: The Grapheme representation of the 2w3a complex
is created by Listing 1 code for the same
ligand-protein complex.
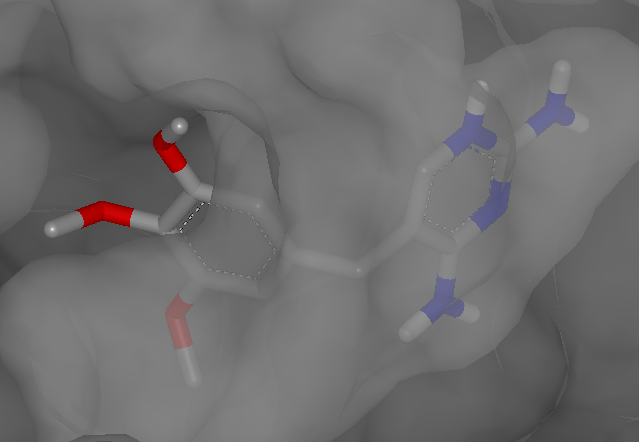
Dihydrofolate reductase complexed with trimethoprim in VIDA (PDB 2w3a)
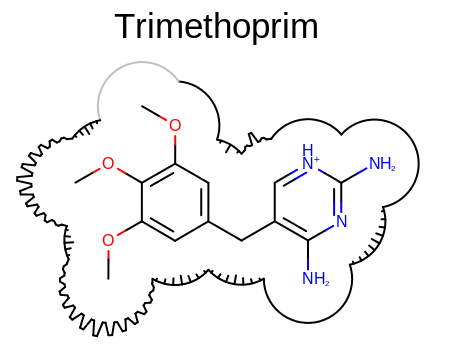
The Grapheme representation of the 2w3a complex
User-defined solvent and buried surface drawing styles can be
implemented by deriving from the
OESurfaceArcFxnBase base class.
Similarly, user-defined cavity and void surface drawing styles can be
implemented by deriving from the
OEComplexSurfaceArcFxnBase base class.
This later abstract class also stores the relative distance calculated
between the ligand and the receptor.
The following code snippet shows how to use this depth to emphasize
the volume of the cavity by adjusting the size of the spikes when
drawing the surface arcs using the OEDrawSunSurfaceArc
function.
void DrawSurfaceArc(OEImageBase& image, const double depth, const OESurfaceArc& arc, const OEPen& pen)
{
  const double edgeAngle = 5.0;
  const double patternAngle = 5.0;
  const double minPatternWidthRatio = 0.05;
  const double maxPatternWidthRatio = 0.10 * depth;
  const unsigned patternDirection = OEPatternDirection::Outside;
  OEDrawSunSurfaceArc(image, arc.GetCenter(), arc.GetBgnAngle(), arc.GetEndAngle(),
                      arc.GetRadius(), pen, edgeAngle,
                      patternDirection, patternAngle,
                      minPatternWidthRatio, maxPatternWidthRatio);
}

class SolventArcFxn : public OESurfaceArcFxnBase
{
public:
  SolventArcFxn() : OESurfaceArcFxnBase() {}
  bool operator()(OEImageBase& image, const OESurfaceArc& arc) const
  {
    OEPen pen(OELightGrey, OELightGrey);
    pen.SetLineWidth(0.5);
    OEDrawDefaultSurfaceArc(image, arc.GetCenter(), arc.GetBgnAngle(),
                            arc.GetEndAngle(), arc.GetRadius(), pen);
    return true;
  }
  OESurfaceArcFxnBase *CreateCopy() const { return new SolventArcFxn(*this); }
};

class BuriedArcFxn : public OESurfaceArcFxnBase
{
public:
  BuriedArcFxn() : OESurfaceArcFxnBase() {}
  bool operator()(OEImageBase& image, const OESurfaceArc& arc) const
  {
    OEPen pen(OEGrey, OEGrey);
    pen.SetLineWidth(2.0);
    OEDrawDefaultSurfaceArc(image, arc.GetCenter(), arc.GetBgnAngle(),
                            arc.GetEndAngle(), arc.GetRadius(), pen);
    return true;
  }
  OESurfaceArcFxnBase *CreateCopy() const { return new BuriedArcFxn(*this); }
};

class CavityArcFxn : public OEComplexSurfaceArcFxnBase
{
public:
  CavityArcFxn() : OEComplexSurfaceArcFxnBase()  { }
  bool operator()(OEImageBase& image, const OESurfaceArc& arc) const
  {
    OEPen pen(OEBlack, OEBlack);
    pen.SetLineWidth(2.0);
    DrawSurfaceArc(image, GetDepth(), arc, pen);
    return true;
  }
  OESurfaceArcFxnBase *CreateCopy() const { return new CavityArcFxn(*this); }
};

class VoidArcFxn : public OEComplexSurfaceArcFxnBase
{
public:
  VoidArcFxn() : OEComplexSurfaceArcFxnBase() {}
  bool operator()(OEImageBase& image, const OESurfaceArc& arc) const
  {
    OEPen pen(OEDarkGrey, OEDarkGrey);
    pen.SetLineWidth(2.0);
    DrawSurfaceArc(image, GetDepth(), arc, pen);
    return true;
  }
  OESurfaceArcFxnBase *CreateCopy() const { return new VoidArcFxn(*this); }
};
These arc drawing predicates then can be used to draw the surface of
the ligand-protein complex when calling the
OEAddComplexSurfaceArcs function.
The image created is shown in
Figure: Example of user-defined surface drawing.
const SolventArcFxn sfxn;
const BuriedArcFxn  bfxn;
const CavityArcFxn  cfxn;
const VoidArcFxn    vfxn;
OEAddComplexSurfaceArcs(ligand, receptor, sfxn, bfxn, cfxn, vfxn);
Example of user-defined surface drawing
See also
Surface Generation chapter in the Spicoli TK manual