Molecule Depiction
The previous chapter introduced how to create images and draw basic geometric elements (such as text, lines rectangles, etc.) Drawing these basic graphical elements provides a framework to construct more complex images such as molecular diagrams.
The molecule depiction is divided into two separate steps (see Figure: Process of Molecule Depiction ):
Generating 2D coordinates
Rendering molecule that involves
transforming and scaling coordinates in order to fit the molecule into an image with a specific width and height
setting atom and bond display properties based on depiction style
creating an image (such as drawing lines for bonds, drawing text for atomic labels)
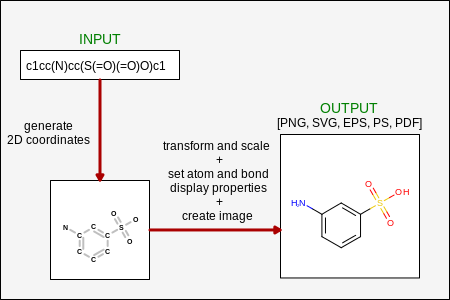
Process of molecule depiction
The next example (Listing 1) demonstrates
how easy is to depict a molecule using the OEDepict TK.
After creating a molecule (for example by parsing a SMILES string) the
image can be generated by calling two functions.
The
OEPrepareDepictionfunction prepares the molecule for depiction. This process may involve perceiving atom and bond stereo information and suppressing or adding hydrogens. It also calls theOEDepictCoordinatesfunction to generate the 2D coordinates of the molecule.The
OERenderMoleculefunction generates the image of the molecule using the default depiction styles and then writes the image into the given file.
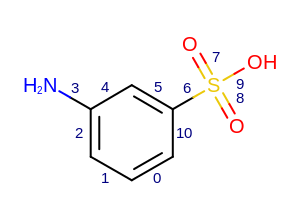
The image created by Listing 1
is shown in
Figure: Example of depicting a molecule.
Listing 1: Example of molecule depiction
public class DepictMolSimple {
    public static void main(String argv[]) {
        OEGraphMol mol = new OEGraphMol();
        oechem.OESmilesToMol(mol, "c1cc(N)cc(S(=O)(=O)O)c1 3-aminobenzenesulfonic acid");
        oedepict.OEPrepareDepiction(mol);
        oedepict.OERenderMolecule("DepictMolSimple.svg", mol);
    }
}
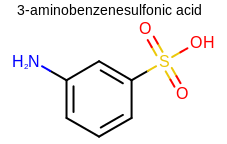
Example of molecule depiction
See also
OEPrepareDepictionfunctionOERenderMoleculefunction
Customizing Molecule Depiction
The previous example showed how to generate a molecule diagram with
default parameters.
OEDepict TK provides the ability to customize molecule depiction.
The Listing 2 example shows how to depict a
molecule width specific width and height parameters.
Listing 2: Example of depicting a molecule
public class DepictMolSize {
    public static void main(String argv[]) {
        OEGraphMol mol = new OEGraphMol();
        oechem.OESmilesToMol(mol, "c1cc(N)cc(S(=O)(=O)O)c1 3-aminobenzenesulfonic acid");
        oedepict.OEPrepareDepiction(mol);

        double width  = 300;
        double height = 300;
        double scale  = OEScale.AutoScale;
        OE2DMolDisplayOptions opts = new OE2DMolDisplayOptions(width, height, scale);
        OE2DMolDisplay disp = new OE2DMolDisplay(mol, opts);
        oedepict.OERenderMolecule("DepictMolSize.svg", disp);
    }
}
See also
OE2DMolDisplayOptions class
OE2DMolDisplay class
Apart from defining the dimensions of a depicted molecule, the
OE2DMolDisplayOptions class stores all properties
that determine how a molecule is depicted.
The following example shows how to set various depiction styles before
initializing the OE2DMolDisplay object.
The image created by Listing 3 is shown in
Figure: Example of customizing depiction style.
Listing 3: Example of customizing the depiction style
public class DepictMolStyle {
    public static void main(String argv[]) {
        OEGraphMol mol = new OEGraphMol();
        oechem.OESmilesToMol(mol, "c1cc(N)cc(S(=O)(=O)O)c1 3-aminobenzenesulfonic acid");
        oedepict.OEPrepareDepiction(mol);

        double width  = 200;
        double height = 200;
        double scale  = OEScale.AutoScale;
        OE2DMolDisplayOptions opts = new OE2DMolDisplayOptions(width, height, scale);

        opts.SetAromaticStyle(OEAromaticStyle.Circle);
        opts.SetAtomColorStyle(OEAtomColorStyle.BlackCPK);
        opts.SetTitleLocation(OETitleLocation.Bottom);

        OE2DMolDisplay disp = new OE2DMolDisplay(mol, opts);
        oedepict.OERenderMolecule("DepictMolStyle.svg", disp);
    }
}
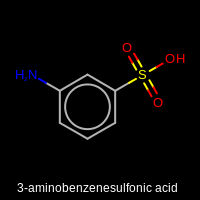
Example of customizing the depiction style
Apart from controlling the depiction style through the
OE2DMolDisplayOptions class, OEDepict TK also provides
access to manipulate individual atom and bond 2D display properties.
The OE2DMolDisplay.GetAtomDisplays method
returns an iterator over OE2DAtomDisplay objects
that store atom display information.
Similarly, the OE2DMolDisplay.GetBondDisplays method
returns an iterator over OE2DBondDisplay objects
that store bond display information.
The following example demonstrates how to change atom and bond display
properties and depict the graph of the molecule by ignoring atom
labels and setting bond display styles.
The image created by Listing 4 is shown in
Figure: Example of molecule graph depiction.
Listing 4: Example of molecule graph depiction
public class DepictMolGraph {
    public static void main(String argv[]) {
        OEGraphMol mol = new OEGraphMol();
        oechem.OESmilesToMol(mol, "c1cc(N)cc(S(=O)(=O)O)c1");
        oedepict.OEPrepareDepiction(mol);

        double width  = 200;
        double height = 200;
        double scale  = OEScale.AutoScale;
        OE2DMolDisplayOptions opts = new OE2DMolDisplayOptions(width, height, scale);

        opts.SetAtomColorStyle(OEAtomColorStyle.WhiteMonochrome);
        opts.SetTitleLocation(OETitleLocation.Hidden);
        opts.SetAtomColor(OEElemNo.C, oechem.getOEDarkGreen());
        OEPen pen = new OEPen(oechem.getOEBlack(), oechem.getOEBlack(), OEFill.On, 3.0);
        opts.SetDefaultBondPen(pen);

        OE2DMolDisplay disp = new OE2DMolDisplay(mol, opts);

        for (OE2DAtomDisplay adisp : disp.GetAtomDisplays()) {
            adisp.SetLabel("");
        }

        for (OE2DBondDisplay bdisp : disp.GetBondDisplays()) {
            bdisp.SetDisplayType(OEBondDisplayType.Single);
        }

        oedepict.OERenderMolecule("DepictMolGraph.svg", disp);
    }
}
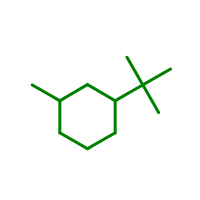
Example of molecule graph depiction
Hint
Even though OEDepict TK provides the ability to manipulate atom and bond display properties of after the OE2DMolDisplay object is constructed, it is highly recommended to set the depiction properties using the OE2DMolDisplayOptions class. Only by knowing all properties (such as labels, font styles and sizes etc.) in advance can one ensure the best depiction layout i.e. that the molecule diagram is rendered without any label clippings and the labels are displayed with the minimum number of overlaps.
See also
OE2DAtomDisplay class
OE2DBondDisplay class
Controlling the Size of Depicted Molecules
The dimensions of a depicted molecule are controlled by the width,
height and scale parameters of the OE2DMolDisplayOptions
that is used to initialized the OE2DMolDisplay object.
(See example in Listing 2)
See also
If the width and the height of the image is not specified (set to be
zero), then scaling value determine the dimensions of the image.
(See examples in Examples of image scaling).
The default scale is defined to be OEScale.Default
constant, and the image may be enlarged or shrunk by specifying a
floating point scaling value.
For example, the scaling OEScale.Default *
0.5 generates an image a half of the default size, and scaling
OEScale.Default * 1.5 generates an image one
and a half times the default.
OEScale::Default * 0.5 |
OEScale::Default |
OEScale::Default * 1.5 |
|---|---|---|

|

|
|
If an OE2DMolDisplayOptions object is initialized with zero width and / or height, then the real dimensions of the image can be accessed after creating an OE2DMolDisplay object.
double width  = 0.0;
double height = 0.0;
double scale  = 50.0;
OE2DMolDisplayOptions opts = new OE2DMolDisplayOptions(width, height, scale);
OE2DMolDisplay disp = new OE2DMolDisplay(mol, opts);
System.out.format("width  %.1f\n", disp.GetWidth());
System.out.format("height %.1f\n", disp.GetHeight());
System.out.format("scale  %.1f\n", disp.GetScale());
The output of the preceding snippet is the following:
width  137.0
height 181.0
scale  50.0
See also
OE2DMolDisplay.GetHeight method
OE2DMolDisplay.GetWidth method
OE2DMolDisplay.GetScale method
If both the width and the height of are specified, then
OEScale.AutoScale scaling indicates
that the molecule is scaled to maximally fit the given dimensions.
The specified width and height will not be altered, not even if the
given scaling would require it i.e if necessary the scaling will be
reduced in order to fit the molecule into the given dimension.
(See examples in Examples of image scaling).
OEScale::Default * 0.5 |
OEScale::Default |
OEScale::Default * 1.5 |
|---|---|---|
|
|
|
Note
Specifying a width and / or height larger than what is required by the scale, causes the molecule to float in the middle of the image of the requested size.
If only either the width or the height of the image is specified, then the unspecified dimension will be set based on the scaling and the specified width / height, respectively.
OEScale::Default, width = 250.0, height = 0.0 |
OEScale::Default, width = 0.0, height = 250.0 |
|---|---|

|

|
Molecule Depiction with Transparent Background
The following code snippet shows how to generate a molecule depiction with transparent
background.
First, the OEImage object, onto which the depiction is going to be rendered,
has to be constructed with the OETransparentColor
color.
Then the OERenderMolecule function has to be called with a
parameter that ensures that the background in not cleared prior to rendering the molecule.
double width  = 200;
double height = 200;
double scale  = OEScale.AutoScale;
OEImage image = new OEImage(width, height, oechem.getOETransparentColor());

OE2DMolDisplayOptions opts = new OE2DMolDisplayOptions(width, height, scale);
OE2DMolDisplay disp = new OE2DMolDisplay(mol, opts);

boolean clearbackground = true;
oedepict.OERenderMolecule("DepictMolTransparent.png", disp, !clearbackground);
Displaying Atom Properties
OEDepict TK provides ability the display atom properties as strings. When a OE2DMolDisplay object is created, the positions where atom properties can be displayed are calculated. (see Figure: Example of generating atom property positions.)
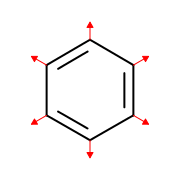
Example of generating atom property positions
The following example shows how to display the atom indices
by using the OEDisplayAtomIdx functor.
The font used to depict the atom property strings also can be
modified by using the
OE2DMolDisplayOptions.SetAtomPropLabelFont
method.
The image created by Listing 5 is shown in
Figure: Example of displaying atom indices.
Listing 5: Example of depicting atom indices
public class AtomPropIndex {
    public static void main(String argv[]) {
        OEGraphMol mol = new OEGraphMol();
        oechem.OESmilesToMol(mol, "c1cc(N)cc(S(=O)(=O)O)c1");
        oedepict.OEPrepareDepiction(mol);

        double width  = 300;
        double height = 200;
        double scale  = OEScale.AutoScale;

        OE2DMolDisplayOptions opts = new OE2DMolDisplayOptions(width, height, scale);

        opts.SetAtomPropertyFunctor(new OEDisplayAtomIdx());
        opts.SetAtomPropLabelFont(new OEFont(oechem.getOEDarkGreen()));

        OE2DMolDisplay disp = new OE2DMolDisplay(mol, opts);
        oedepict.OERenderMolecule("AtomPropIndex.svg", disp);
    }
}
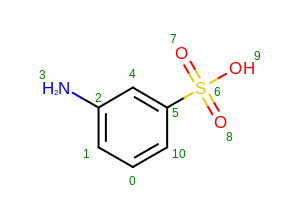
Example of displaying atom indices
Hint
It is recommended to use the OE2DMolDisplayOptions.SetAtomPropertyFunctor
method to define the atom property labels when the OE2DMolDisplay
object is constructed.
All labels displayed on the molecule diagram have to be known in advance in order to be
able to minimize the number of label clashes and clippings when calculating
the positions of the atom property labels.
See also
OEDepict TK provides the following built-in atom property functors:
OEDisplayAtomIdx class
OEDisplayAtomMapIdx class
OEDisplayNoAtomProp class
In order to display user-defined atom properties, the functor that is
passed to the
OE2DMolDisplayOptions.SetAtomPropertyFunctor
method has to be derived from the OEDisplayAtomPropBase
abstract base class.
The Listing 6 example shows
how to implement a user-defined functor that marks aromatic atoms.
The image created by Listing 6 is shown in
Figure: Example of displaying user-defined atom properties.
Listing 6: Example of depicting user-defined atom properties
public class AtomPropUser {
    private static class LabelAromaticAtoms extends OEDisplayAtomPropBase {
        public LabelAromaticAtoms() {}

        @Override
        public String constCall(OEAtomBase atom) {
            return (atom.IsAromatic() ? "(A)" : "");
        }

        @Override
        public OEDisplayAtomPropBase CreateCopy() {
            OEDisplayAtomPropBase copy = new LabelAromaticAtoms();
            copy.swigReleaseOwnership();
            return copy;
        }
    }

    public static void main(String argv[]) {
        OEGraphMol mol = new OEGraphMol();
        oechem.OESmilesToMol(mol, "c1cc(N)cc(S(=O)(=O)O)c1");
        oedepict.OEPrepareDepiction(mol);

        double width  = 300;
        double height = 200;
        double scale  = OEScale.AutoScale;

        OE2DMolDisplayOptions opts = new OE2DMolDisplayOptions(width, height, scale);

        LabelAromaticAtoms atomlabel = new LabelAromaticAtoms();
        opts.SetAtomPropertyFunctor(atomlabel);

        OE2DMolDisplay disp = new OE2DMolDisplay(mol, opts);
        oedepict.OERenderMolecule("AtomPropUser.svg", disp);
    }
}
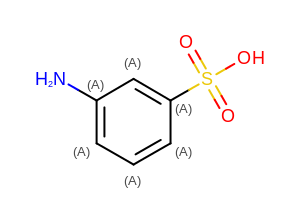
Example of displaying user-defined atom properties
See also
OEDisplayAtomPropBase class
Displaying Bond Properties
Similarly to atom properties, bond properties can be displayed as strings. (see Figure: Example of generating bond property positions.)
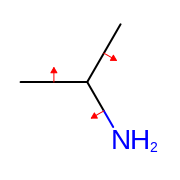
Example of generating bond property positions
The Listing 7 demonstrates how to
display bond indices by using the OEDisplayBondIdx functor.
The font used to depict the bond property strings can be
set by using the OE2DMolDisplayOptions.SetBondPropLabelFont
method.
The image created by Listing 7 is shown in
Figure: Example of displaying bond indices.
Listing 7: Example of depicting bond indices
public class BondPropIndex {
    public static void main(String argv[]) {
        OEGraphMol mol = new OEGraphMol();
        oechem.OESmilesToMol(mol, "c1cc(N)cc(S(=O)(=O)O)c1");
        oedepict.OEPrepareDepiction(mol);

        double width  = 300;
        double height = 200;
        double scale  = OEScale.AutoScale;

        OE2DMolDisplayOptions opts = new OE2DMolDisplayOptions(width, height, scale);

        opts.SetBondPropertyFunctor(new OEDisplayBondIdx());
        opts.SetBondPropLabelFont(new OEFont(oechem.getOEDarkBlue()));

        OE2DMolDisplay disp = new OE2DMolDisplay(mol, opts);
        oedepict.OERenderMolecule("BondPropIndex.svg", disp);
    }
}
Example of displaying bond indices
Hint
It is recommended to use the OE2DMolDisplayOptions.SetBondPropertyFunctor
method to define the bond property labels when the OE2DMolDisplay
object is constructed.
All labels displayed on the molecule diagram have to be known in advance in order to be
able to minimize the number of label clashes and clippings when calculating
the positions of the bond property labels.
See also
OEDepict TK provides the following built-in bond property functors:
OEDisplayBondIdx class
OEDisplayNoBondProp class
In order to display user-defined bond properties, the functor that is
passed to the
OE2DMolDisplayOptions.SetBondPropertyFunctor
method has to be derived from the OEDisplayBondPropBase
abstract base class.
The Listing 8 example shows how to implement a
user-defined functor that marks chain and ring bonds.
The image created by Listing 8 is shown in
Figure: Example of displaying user-defined bond properties.
Listing 8: Example of depicting user-defined bond properties
public class BondPropUser {
    private static class LabelRingChainBonds extends OEDisplayBondPropBase {
        public LabelRingChainBonds() {}

        @Override
        public String constCall(OEBondBase bond) {
            return (bond.IsInRing() ? "R" : "C");
        }

        @Override
        public OEDisplayBondPropBase CreateCopy() {
            OEDisplayBondPropBase copy = new LabelRingChainBonds();
            copy.swigReleaseOwnership();
            return copy;
        }
    }

    public static void main(String argv[]) {
        OEGraphMol mol = new OEGraphMol();
        oechem.OESmilesToMol(mol, "c1cc(N)cc(S(=O)(=O)O)c1");
        oedepict.OEPrepareDepiction(mol);

        double width  = 300;
        double height = 200;
        double scale  = OEScale.AutoScale;

        OE2DMolDisplayOptions opts = new OE2DMolDisplayOptions(width, height, scale);

        LabelRingChainBonds bondlabel = new LabelRingChainBonds();
        opts.SetBondPropertyFunctor(bondlabel);

        OE2DMolDisplay disp = new OE2DMolDisplay(mol, opts);
        oedepict.OERenderMolecule("BondPropUser.svg", disp);
    }
}
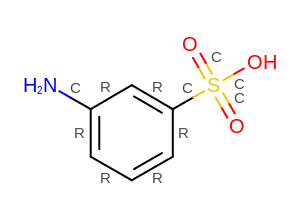
Example of displaying user-defined bond properties
See also
OEDisplayBondPropBase class
Hiding Atoms and Bonds
OEDepict TK provides ability the suppress the display of specific atom and bonds. When a OE2DMolDisplay object is created, the visibility of every atom is evaluated. Bonds with both atom endpoints visible are also displayed. (see Figure: Example of hiding a portion of a structure.)
The following example shows how to selectively display only
a portion of the structure by using a custom class derived from
the OEUnaryAtomPred functor.
The images created by Listing 9 is shown in
Figure: Example of hiding a portion of a structure.
Hint
It is recommended to use the OE2DMolDisplayOptions.SetAtomVisibilityFunctor
method to identify the visible atoms when the OE2DMolDisplay
object is constructed. All objects displayed on the molecule diagram have to be known in advance in order to be
able to correctly size and scale the molecule.
Listing 9: Example of selectively displaying atoms
public class AtomVisibility {

    static class OEAtomVisibilityShowRxnRole extends OEUnaryAtomPred {
        private int rxnrole = OERxnRole.None;

        public OEAtomVisibilityShowRxnRole(int role) { rxnrole = role; }

        @Override
        public boolean constCall(OEAtomBase atom) {
            if (rxnrole == OERxnRole.None) {
                    return true;
            }
            return (rxnrole == atom.GetRxnRole());
        }

        @Override
        public OEUnaryAtomPred CreateCopy() {
            OEUnaryAtomPred copy = new OEAtomVisibilityShowRxnRole(rxnrole);
            copy.swigReleaseOwnership();
            return copy;
        }
    }

    public static void main(String argv[]) {
        if (argv.length != 2) {
            oechem.OEThrow.Usage("AtomVisibility <rxnfile> <imagefile>");
        }
        oemolistream ifs = new oemolistream(argv[0]);

        OEGraphMol mol = new OEGraphMol();
        if (!oechem.OEReadRxnFile(ifs,mol)) {
            oechem.OEThrow.Fatal("error reading rxnfile");
        }
        ifs.close();

        oedepict.OEPrepareDepiction(mol);

        OEImage image = new OEImage(900, 100);

        int rows = 1;
        int cols = 3;
        OEImageGrid grid = new OEImageGrid(image, rows, cols);

        OE2DMolDisplayOptions opts = new OE2DMolDisplayOptions(grid.GetCellWidth(), grid.GetCellHeight(), OEScale.AutoScale);

        OEImageBase cell = grid.GetCell(1,1);
        mol.SetTitle("Reaction display");
        OEUnaryAtomPred allatoms = new OEIsTrueAtom(); // explicitly set the default
        opts.SetAtomVisibilityFunctor(allatoms);
        OE2DMolDisplay disp = new OE2DMolDisplay(mol, opts);
        double rxnscale = disp.GetScale();
        oedepict.OERenderMolecule(cell, disp);

        cell = grid.GetCell(1,2);
        mol.SetTitle("Reactant display");
        OEAtomVisibilityShowRxnRole showreacs = new OEAtomVisibilityShowRxnRole(OERxnRole.Reactant);
        opts.SetAtomVisibilityFunctor(showreacs);
        opts.SetScale(rxnscale);
        disp = new OE2DMolDisplay(mol, opts);
        oedepict.OERenderMolecule(cell, disp);

        cell = grid.GetCell(1,3);
        mol.SetTitle("Product display");
        OEAtomVisibilityShowRxnRole showprods = new OEAtomVisibilityShowRxnRole(OERxnRole.Product);
        opts.SetAtomVisibilityFunctor(showprods);
        opts.SetScale(rxnscale);
        disp = new OE2DMolDisplay(mol, opts);
        oedepict.OERenderMolecule(cell, disp);

        oedepict.OEWriteImage(argv[1], image);
    }
}
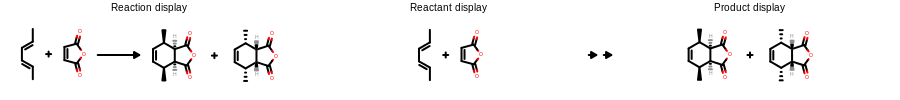
Example of hiding a portion of a structure
Configuring Molecule Display
OEDepict TK provides a mechanism to generate a standard interface that
allows configuration of molecule displays.
By calling the OEConfigureImageOptions function,
“-height” and “width” parameters are added to the interface
(OEInterface), at run-time the value of these
parameters can be obtained by calling the
OEGetImageHeight and
OEGetImageWidth functions, respectively.
(See the standard interface displayed when calling the
Listing 10 example
with the “–help” parameter)
The OEConfigure2DMolDisplayOptions function
generates an interface that allows setting of various molecule display
options (such as aromatic style, atom and bond coloring etc.)
The OE2DMolDisplayOptions object, that stores
properties determine the molecule depiction style, can initialized
based on to the command line parameters by calling the
OESetup2DMolDisplayOptions function.
Listing 10: Example of configuring mol display
public class DepictMolConfigure {
    static String InterfaceData =
            "!CATEGORY \"input/output options :\"\n" +
                    "\n" +
                    "  !PARAMETER -in\n" +
                    "    !ALIAS -i\n" +
                    "    !TYPE string\n" +
                    "    !REQUIRED true\n" +
                    "    !BRIEF Input filename\n" +
                    "  !END\n" +
                    "\n" +
                    "  !PARAMETER -out\n" +
                    "    !ALIAS -o\n" +
                    "    !TYPE string\n" +
                    "    !REQUIRED true\n" +
                    "    !BRIEF Output filename\n" +
                    "  !END\n" +
                    "\n" +
                    "!END\n";

    public static void main(String argv[]) {
        OEInterface itf = new OEInterface();
        // import configuration file
        oechem.OEConfigure(itf, InterfaceData);
        // add configuration for image size and display options
        oedepict.OEConfigureImageOptions(itf);
        oedepict.OEConfigure2DMolDisplayOptions(itf);

        if (!oechem.OEParseCommandLine(itf, argv, "DepictMolConfigure")) {
            oechem.OEThrow.Fatal("Unable to interpret command line!");
        }

        String ifname = itf.GetString("-in");
        String ofname = itf.GetString("-out");

        oemolistream ifs = new oemolistream(ifname);
        OEGraphMol mol = new OEGraphMol();
        oechem.OEReadMolecule(ifs, mol);
        ifs.close();
        oedepict.OEPrepareDepiction(mol);

        double width  = oedepict.OEGetImageWidth (itf);
        double height = oedepict.OEGetImageHeight(itf);
        double scale  = OEScale.AutoScale;
        OE2DMolDisplayOptions opts = new OE2DMolDisplayOptions(width, height, scale);
        // set up display options from command line parameters
        oedepict.OESetup2DMolDisplayOptions(opts, itf);

        OE2DMolDisplay disp = new OE2DMolDisplay(mol, opts);
        oedepict.OERenderMolecule(ofname, disp);
        return;
    }
}
prompt> java DepictMolConfigure --help
will generate the following standard interface:
Simple parameter list
    image options
      -height : Height of output image
      -width : Width of output image

    input/output
      -in : Input filename
      -out : Output filename

    molecule display options
      -aromstyle : Aromatic ring display style
      -atomcolor : Atom coloring style
      -atomprop : Atom property display
      -atomstereostyle : Atom stereo display style
      -bondcolor : Bond coloring style
      -bondprop : Bond property display
      -bondstereostyle : Bond stereo display style
      -hydrstyle : Hydrogen display style
      -linewidth : Default bond line width
      -protgroupdisp : Protective group display style
      -scale : Scaling of the depicted molecule
      -superdisp : Super atom display style
      -titleloc : Location of the molecule title
See also
OEInterface class in the OEChem TK manual
OEDepict Examples chapter
OEDepict TK provides the following high-level functions to build standard interface of depiction applications:
Function name |
Builds standard interface for .. |
|---|---|
molecule depiction style |
|
highlighting |
|
image grid |
|
image |
|
multi-page image |
|
preparing molecules for 2D depiction |
|
multi-page report |