Depicting BFactor
A program that depicts the B-factor of a ligand and its environment.
See also
Visualizing Protein-Ligand B-Factor OpenEye Python Cookbook example
Visualizing Protein-Ligand B-Factor Map OpenEye Python Cookbook example
Command Line Interface
A description of the command line interface can be obtained by executing the program with the –help argument.
prompt> java BFactor2Img --help
will generate the following output:
[-complex] <input> [-out] <output pdf>

Simple parameter list
    -height : Height of output image
    -width : Width of output image

    SplitMolComplex options :
      -ligandname : Ligand name

    input/output options
      -complex : Input filename of the protein complex
      -out : Output filename

    molecule display options
      -aromstyle : Aromatic ring display style
Code
Download code
BFactor2Img.java
and
BFactor2Img.txt
interface file
See also
OESplitMolComplexfunction in OEChem TKOENearestNbrs class in OEChem TK
OEPrepareDepictionFrom3DfunctionOESurfaceArcFxnBase class and
OEDraw2DSurfacefunctionOEAtomGlyphBase class and
OEAddGlyphfunction
Examples
prompt> java BFactor2Img -complex 1MEH.pdb -ligandname MOA -out MOA.png
will generate the following output:
Average BFactor of the complex = +32.721
Minimum BFactor of the ligand and its environment = +21.500
Maximum BFactor of the ligand and its environment = +72.060
and the image shown in Figure: Example of depicting the BFactor of MOA and its environment.
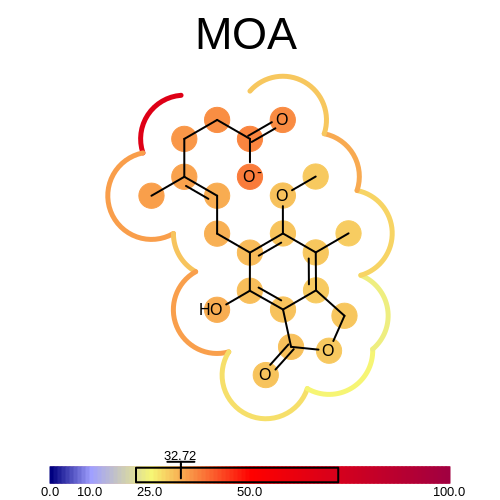
Example of depicting the BFactor of MOA and its environment
prompt> java BFactor2Img -complex 1LEE.pdb -ligandname R36 -out R36.png
will generate the following output:
Average BFactor of the complex = +23.754
Minimum BFactor of the ligand and its environment = +6.040
Maximum BFactor of the ligand and its environment = +32.050
and the image shown in Figure: Example of depicting the BFactor of R36 and its environment.
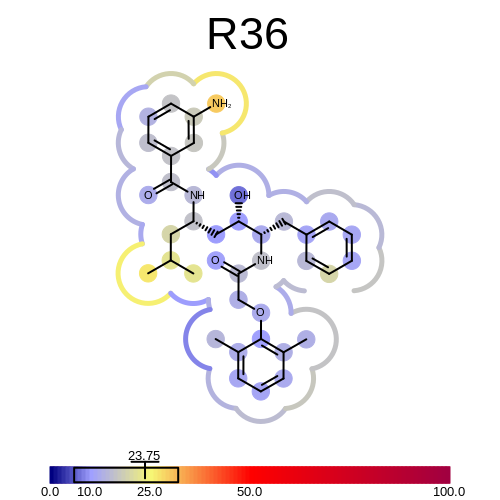
Example of depicting the BFactor of R36 and its environment