Depicting Atom Contributions of XLogP
Problem
You want to depict the contribution of each atom to the total XLogP on your molecule diagram. See example in Figure 1.

Figure 1. Example of depicting the atom contributions of XLogP
Ingredients
|

Download
Download code
See also the Usage (xlogp2img) and Usage (xlogp2pdf) subsections.
Solution
The code snippet below shows how to calculate the total XLogP of a molecule along with the atom contributions by calling the OEGetXLogP function. Each atom contribution is then attached to the relevant atom as generic data with the given tag.
1 2 3 4 5 6 7 8 9 10 11 12 13 14 15 16 17 18 | def set_atom_properties(mol, tag):
"""
Attaches the XLogP atom contribution to each atom with the given tag.
:type mol: oechem.OEMolBase
:type tag: string
"""
oequacpac.OERemoveFormalCharge(mol)
avals = oechem.OEFloatArray(mol.GetMaxAtomIdx())
logp = oemolprop.OEGetXLogP(mol, avals)
mol.SetTitle(mol.GetTitle() + " -- OEXLogP = %.2f" % logp)
for atom in mol.GetAtoms():
val = avals[atom.GetIdx()]
atom.SetData(tag, val)
|
The depict_molecule_xlogp function below shows how to project the atom contributions of the total XLogP into a 2D molecular diagram using the OE2DPropMap class. After constructing the OE2DMolDisplay object to depict a molecule, an OE2DPropMap object is initialized and its properties are set that determine how the data is going to be visualized (lines 19-22). For example in this case the negative color xlogp atom contributions are going to be represented by dark green, while the positive values are visualized by using dark purple.
When the OE2DPropMap.Render method is called with same tag that was used in the set_atom_properties function, the properties that were attached to the atoms as generic data are retrieved and a 2D grid is generated underneath the molecular diagram. The OELinearColorGradient object that is used to assign colors to the cells of the grid is also rendered based on the option set by the OE2DPropMap.SetLegendLocation method . You can see the result in Figure 1.
1 2 3 4 5 6 7 8 9 10 11 12 13 14 15 16 17 18 19 20 21 22 23 24 25 | def depict_molecule_xlogp(image, mol, opts):
"""
Generates an image of a molecule depicting the atom contribution of XLogP.
:type image oedepict.OEImageBase
:type mol: list[oechem.OEMolBase]
:type opts: oedepict.OE2DMolDiplayOptions
"""
scale = oegrapheme.OEGetMoleculeSurfaceScale(mol, opts)
opts.SetScale(scale)
stag = "XLogP"
itag = oechem.OEGetTag(stag)
set_atom_properties(mol, itag)
disp = oedepict.OE2DMolDisplay(mol, opts)
propmap = oegrapheme.OE2DPropMap(opts.GetBackgroundColor())
propmap.SetNegativeColor(oechem.OEDarkGreen)
propmap.SetPositiveColor(oechem.OEDarkPurple)
propmap.SetLegendLocation(oegrapheme.OELegendLocation_Left)
propmap.Render(disp, stag)
oedepict.OERenderMolecule(image, disp)
|
Hint
You can easily adapt this example to visualize other atom properties by writing your own set_atom_properties function.
Usage (xlogp2img)
Usage
The following commands will generate the image shown in Figure 1.
prompt > echo "SCCNC(=O)c2ccc3c(c2)sc(n3)NC(=O)NCC"  > molecule.ism
prompt > python3 xlogp2img.py molecule.ism xlogp.png
Command Line Parameters
Simple parameter list
    -height : Height of output image
    -width : Width of output image

    molecule display options :
      -aromstyle : Aromatic ring display style

    input/output options
      -in : Input molecule filename
      -out : Output filename of the generated image
Discussion
The example above shows how to visualize the atom contributions for a single molecule, however you might want to visualize the XLogP data for a set of molecules. In this case the set_atom_properties function not only attaches the XLogP contributions to the relevant atom, but also calculates the minimum and maximum atom contributions for the whole molecule set.
1 2 3 4 5 6 7 8 9 10 11 12 13 14 15 16 17 18 19 20 21 22 23 | def set_atom_properties(mol, tag, minvalue, maxvalue):
"""
Attaches the XLogP atom contribution to each atom with the given tag.
:type mol: oechem.OEMolBase
:type datatag: string
:type minvalue: float
:type maxvalue: float
"""
oequacpac.OERemoveFormalCharge(mol)
avals = oechem.OEFloatArray(mol.GetMaxAtomIdx())
logp = oemolprop.OEGetXLogP(mol, avals)
mol.SetTitle(mol.GetTitle() + " -- OEXLogP = %.2f" % logp)
for atom in mol.GetAtoms():
val = avals[atom.GetIdx()]
atom.SetData(tag, val)
minvalue = min(minvalue, val)
maxvalue = max(maxvalue, val)
return minvalue, maxvalue
|
These minimum and maximum values are used to initialize the value range of the linear color gradient of the property map (see lines 27-28 of the depict_molecules_xlogp function below). Each molecule, along with its property map, is then rendered into a cell of an OEReport object. The OEReport class is a layout manager allowing generation of multi-page images in a convenient way. You can see the generated multi-page PDF in Table 1. While the value range of the color gradients depicted alongside the molecules represents the range for the whole set, the black box rendered on each color gradient represents the minimum and maximum XLogP atom contributions for the corresponding molecule.
1 2 3 4 5 6 7 8 9 10 11 12 13 14 15 16 17 18 19 20 21 22 23 24 25 26 27 28 29 30 31 32 33 34 35 36 | def depict_molecules_xlogp(report, mollist, opts):
"""
Generates a report of molecules depicting the atom contribution of XLogP.
:type report: oedepict.OEReport
:type mollist: list[oechem.OEMolBase]
:type opts: oedepict.OE2DMolDiplayOptions
"""
molscale = float("inf")
for mol in mollist:
molscale = min(molscale, oegrapheme.OEGetMoleculeSurfaceScale(mol, opts))
opts.SetScale(molscale)
stag = "XLogP"
itag = oechem.OEGetTag(stag)
minvalue = float("inf")
maxvalue = float("-inf")
for mol in mollist:
minvalue, maxvalue = set_atom_properties(mol, itag, minvalue, maxvalue)
propmap = oegrapheme.OE2DPropMap(opts.GetBackgroundColor())
propmap.SetNegativeColor(oechem.OEDarkGreen)
propmap.SetPositiveColor(oechem.OEDarkPurple)
propmap.SetLegendLocation(oegrapheme.OELegendLocation_Left)
propmap.SetMinValue(minvalue)
propmap.SetMaxValue(maxvalue)
for mol in mollist:
disp = oedepict.OE2DMolDisplay(mol, opts)
propmap.Render(disp, stag)
cell = report.NewCell()
oedepict.OERenderMolecule(cell, disp)
|
| page 1 | page 2 | page 3 |
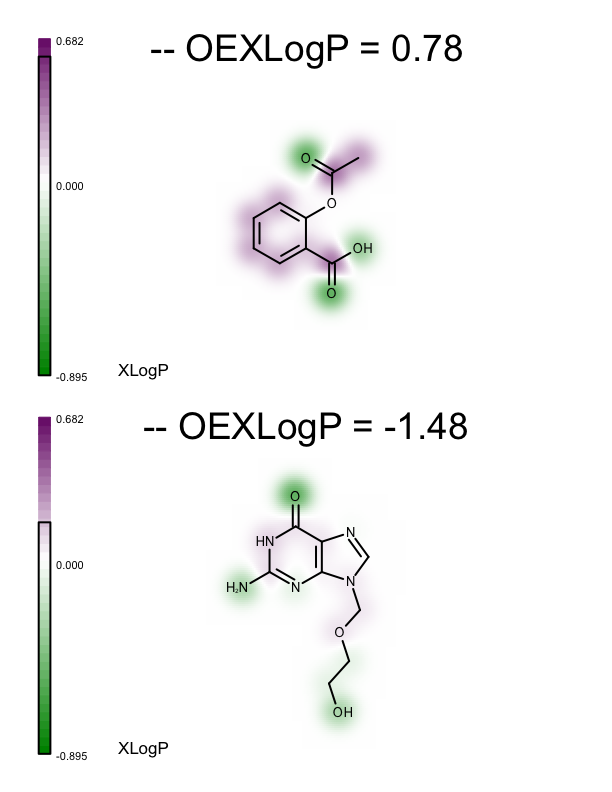
|
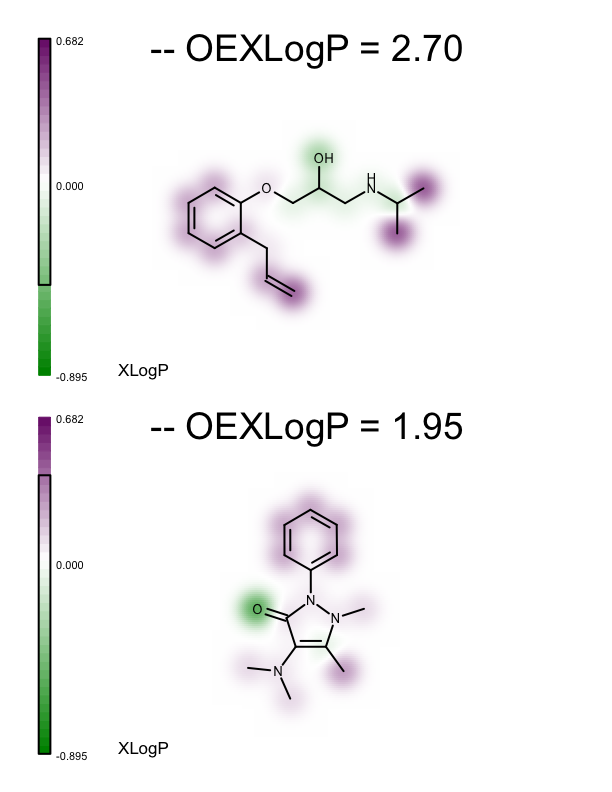
|
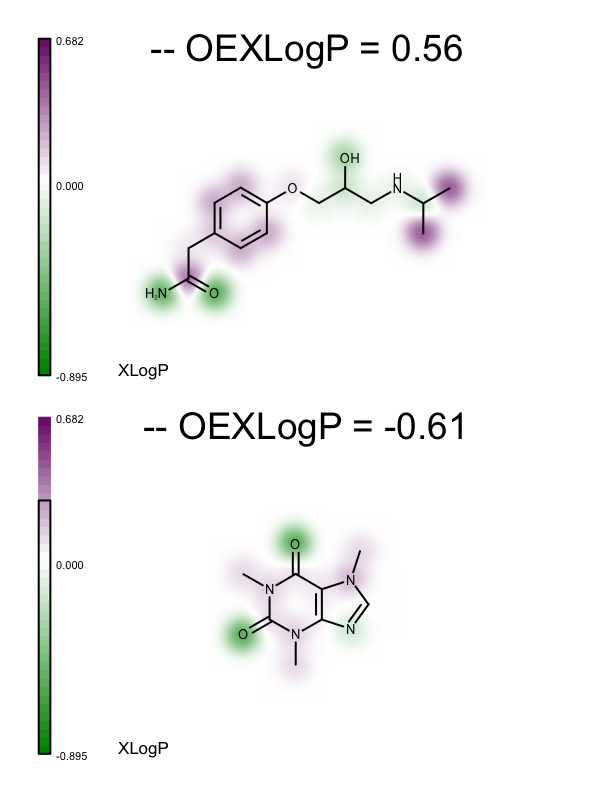
|
Usage (xlogp2pdf)
Usage
xlogp2pdf.py and supporting data examples.ism
The following command will generate the report shown in Table 1.
prompt > python3 xlogp2pdf.py molecules.ism xlogp.pdf
Command Line Parameters
Simple parameter list
    molecule display options :
      -aromstyle : Aromatic ring display style

    report options
      -pagebypage : Write individual numbered separate pages

    report options :
      -colsperpage : Number of columns per page
      -pageheight : Page height
      -pageorientation : Page orientation
      -pagesize : Page size
      -pagewidth : Page width
      -rowsperpage : Number of rows per page

    input/output options
      -in : Input molecule filename
      -out : Output filename of the generated image
See also in OEDepict TK manual
Theory
- Molecule Depiction chapter
- Multi Page Reports section
API
- OE2DMolDisplay class
- OE2DMolDisplayOptions class
- OEImage class
- OERenderMolecule function
- OEReport class