Depicting CSV or SDF in PDF
Problem
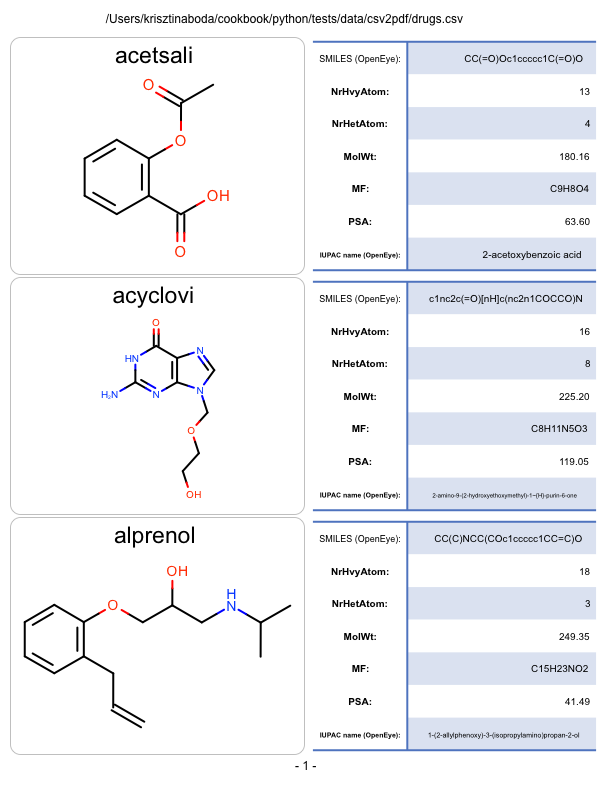
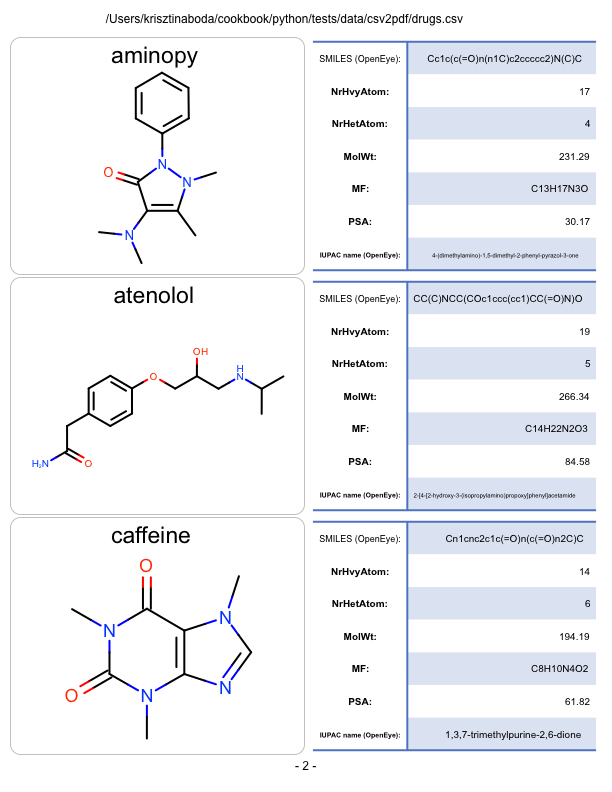
You want to depict molecules along with their associated data read from a CSV file in a multi-page PDF file. See example in drugs.pdf and in Table 1.
| page 1 | page 2 |
|
|
Ingredients
|

Solution
The CSV file format is a text file format containing comma-separated values. In OEChem TK this file format is implemented to enable data exchange with a wide variety of other software. Each line of a CSV file stores data for a molecule that is represented by a SMILES string.
See also
- CSV File Format section of the OEChem TK documentation about the layout of the CSV file format.
When reading a CSV file, the fields of the file are attached to each molecule as SD data. This data can be accessed by the OEGetSDDataIter function that returns an iterator over all the SD data (tag - value) pairs of a molecule. The CollectDataTags function iterates over a list of molecules and returns the unique tags of the data attached to the molecules.
1 2 3 4 5 6 7 8 9 | def CollectDataTags(mollist):
tags = []
for mol in mollist:
for dp in oechem.OEGetSDDataIter(mol):
if not dp.GetTag() in tags:
tags.append(dp.GetTag())
return tags
|
The DepictMoleculesWithData function takes a list of molecules read from a CSV file along with the data tags returned by the CollectDataTags function. Each molecule and its corresponding data is rendered into adjacent cells of an OEReport object (lines 3-16). The OEReport class is a layout manager allowing generation of multi-page images in a convenient way. After rendering the molecules, the input filename is rendered into page headers (lines 22-27) while the page number is rendered at the bottom of each page (lines 31-36).
1 2 3 4 5 6 7 8 9 10 11 12 13 14 15 16 17 18 19 20 21 22 23 24 25 26 27 28 29 30 31 32 33 34 | def DepictMoleculesWithData(report, mollist, iname, tags, opts):
for mol in mollist:
# render molecule
cell = report.NewCell()
oedepict.OEPrepareDepiction(mol)
disp = oedepict.OE2DMolDisplay(mol, opts)
oedepict.OERenderMolecule(cell, disp)
oedepict.OEDrawCurvedBorder(cell, oedepict.OELightGreyPen, 10.0)
# render corresponding data
cell = report.NewCell()
RenderData(cell, mol, tags)
# add input filnename to headers
headerfont = oedepict.OEFont(oedepict.OEFontFamily_Default, oedepict.OEFontStyle_Default,
12, oedepict.OEAlignment_Center, oechem.OEBlack)
headerpos = oedepict.OE2DPoint(report.GetHeaderWidth() / 2.0, report.GetHeaderHeight() / 2.0)
for header in report.GetHeaders():
header.DrawText(headerpos, iname, headerfont)
# add page number to footers
footerfont = oedepict.OEFont(oedepict.OEFontFamily_Default, oedepict.OEFontStyle_Default,
12, oedepict.OEAlignment_Center, oechem.OEBlack)
footerpos = oedepict.OE2DPoint(report.GetFooterWidth() / 2.0, report.GetFooterHeight() / 2.0)
for pageidx, footer in enumerate(report.GetFooters()):
footer.DrawText(footerpos, "- %d -" % (pageidx + 1), footerfont)
|
The RenderData function shows how ease is to render the (tag - value) tuples using the OEImageTable class.
1 2 3 4 5 6 7 8 9 10 11 12 13 14 15 16 17 18 19 20 21 22 23 | def RenderData(image, mol, tags):
data = []
for tag in tags:
value = "N/A"
if oechem.OEHasSDData(mol, tag):
value = oechem.OEGetSDData(mol, tag)
data.append((tag, value))
nrdata = len(data)
tableopts = oedepict.OEImageTableOptions(nrdata, 2, oedepict.OEImageTableStyle_LightBlue)
tableopts.SetColumnWidths([10, 20])
tableopts.SetMargins(2.0)
tableopts.SetHeader(False)
tableopts.SetStubColumn(True)
table = oedepict.OEImageTable(image, tableopts)
for row, (tag, value) in enumerate(data):
cell = table.GetCell(row + 1, 1)
table.DrawText(cell, tag + ":")
cell = table.GetBodyCell(row + 1, 1)
table.DrawText(cell, value)
|
Download code
csv2pdf.py and drugs.csv supporting data file
Usage
Running the above command will generate the drugs.pdf multi-page pdf file.
prompt > python3 csv2pdf.py drugs.csv drugs.pdf
Discussion
Reading the columns of an CSV file into SD data fields, means that the OEChem TK provides a meta-data interchange between sdf files and CSV files. Consequently, the same Python script can be used to generate a pdf file reading an sdf file.
See also in OEChem TK manual
Theory
- SD Tagged Data Manipulation section
- CSV File Format section
API
- OEGetSDDataIter function
See also in OEDepict TK manual
Theory
- Molecule Depiction chapter
- Molecule Layout chapter
API
- OE2DMolDisplay class
- OE2DMolDisplayOptions class
- OEDrawBorder function
- OEFont class
- OEImage class
- OEImageTable class
- OEImageTableOptions class
- OEPrepareDepiction function
- OERenderMolecule function
- OEReport class