Depicting Activities of Molecules
Problem
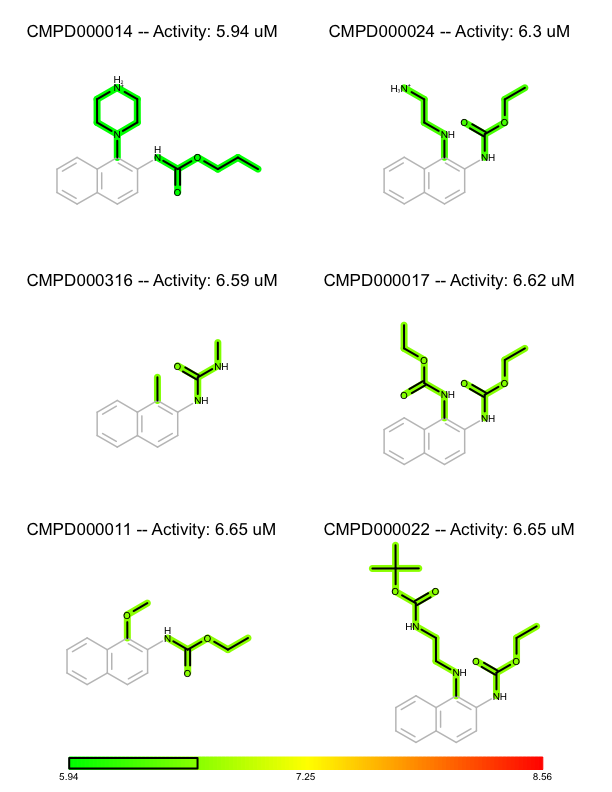
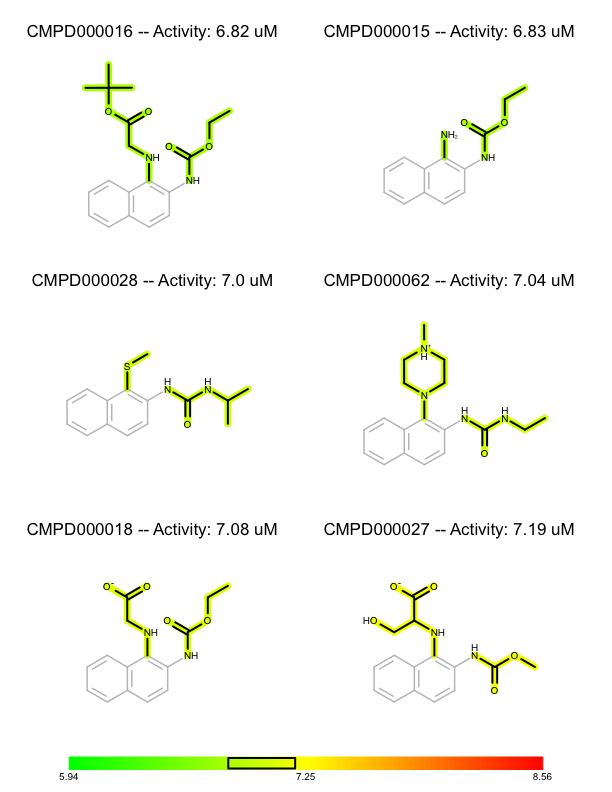
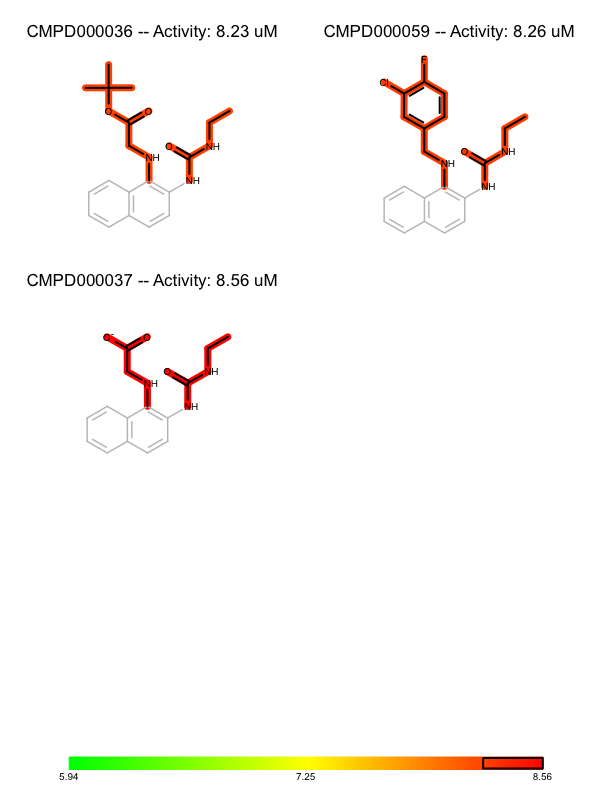
You want to organize and depict a set of molecules according to given activity data and common substructure. See the separate pages of a multi-page PDF in Table 1.
| page 1 | page 2 | .. | page 8 |
|
|
.. | 
|
Ingredients
|

Solution
First you have to import the molecules being depicted with their activity information. In this example the ImportMolecule functions reads the molecules and extracts the activity information attached to the molecule as SD data with the “activity” tag (line 14). (See example in the activity.sdf input file.) After converting the SD string to a floating point number the number is added to the title of the molecule in order to depict it later along with the molecule (line 17). Each imported molecule, along with its corresponding activity, is inserted into a list of (molecule, activity) tuples (line 18).
1 2 3 4 5 6 7 8 9 10 11 12 13 14 15 16 17 18 19 20 21 22 | def ImportMolecules(ifs, mollist):
if ifs.GetFormat() != oechem.OEFormat_SDF:
oechem.OEThrow.Fatal("The input file has to be an SDF file")
tag = "activity"
for mol in ifs.GetOEGraphMols():
id = mol.GetTitle()
if not oechem.OEHasSDData(mol, tag):
oechem.OEThrow.Warning("Non activity data found for molecule '%s'."
"Compound will be ignored." % id)
else:
activitystr = oechem.OEGetSDData(mol, tag)
try:
activity = float(activitystr)
mol.SetTitle("%s -- Activity: %s uM" % (id, activitystr))
mollist.append((oechem.OEGraphMol(mol), activity))
except ValueError:
oechem.OEThrow.Warning("Non-numeric activity data '%s' found for molecule '%s'."
"Compound will be ignored." % (activitystr, id))
|
The DepictMoleculesWithActivity function, that takes the following parameters, shows how to depict the molecules along with their activities.
- report
- An OEReport object which is a layout manager that allows generation of multi-page images.
- mollist
- A list of (molecule, activity) tuples that are constructed by the ImportMolecule function above.
- coresubs
- An OESubSearch object that is constructed from a SMARTS pattern that defines the common core substructure of the molecules.
- opts
- An OE2DMolDisplayOptions object that defines the style of the molecule depiction.
First, the activity numbers are extracted from the list of (molecule, activity) tuples in order to find the minimum and maximum activity number of the dataset (lines 3-5). These number are used to construct a color gradient (lines 7-9) that will be used to color the molecules by their activity. The molecules are then sorted in decreasing order of their activities (lines 11). This will be the order in which they are rendered.
Before rendering a substructure search is performed to find the common core substructure of the molecule. The match returned by the substructure search is used to align the molecule by this common core (line 19), Then the bonds of the common core are highlighted by calling the FadeCoreSubstructure function (line 26), while the bonds that are not in the common core are highlighted by the activity of the molecule by calling the HighlightByActivity function (line 27). After rendering the molecules, the color gradient is depicted in the footer of each page (lines 34-47) along with a box that indicates the range of the activities of the molecule in each page.
1 2 3 4 5 6 7 8 9 10 11 12 13 14 15 16 17 18 19 20 21 22 23 24 25 26 27 28 29 30 31 32 33 34 35 36 37 38 39 40 41 42 43 44 45 46 47 48 | def DepictMoleculesWithActivity(report, mollist, coresubs, opts):
activities = [activity for mol, activity in mollist]
minactivity = min(activities)
maxactivity = max(activities)
midvalue = (minactivity + maxactivity) / 2.0
colorg = oechem.OELinearColorGradient(oechem.OEColorStop(midvalue, oechem.OEYellow))
colorg.AddStop(oechem.OEColorStop(maxactivity, oechem.OERed))
colorg.AddStop(oechem.OEColorStop(minactivity, oechem.OEGreen))
sortedmollist = sorted(mollist, key=itemgetter(1))
for mol, activity in sortedmollist:
unique = True
match = None
for mi in coresubs.Match(mol, unique):
match = mi
oedepict.OEPrepareAlignedDepiction(mol, coresubs.GetPattern(), match)
break
cell = report.NewCell()
disp = oedepict.OE2DMolDisplay(mol, opts)
if match is not None:
FadeCoreSubstructure(disp, match)
HighlightByActivity(disp, match, activity, colorg)
oedepict.OERenderMolecule(cell, disp)
cellsperpage = report.NumRowsPerPage() * report.NumColsPerPage()
opts = oegrapheme.OEColorGradientDisplayOptions()
for pageidx, footer in enumerate(report.GetFooters()):
bgnidx = pageidx * cellsperpage
endidx = (pageidx + 1) * cellsperpage
pageactivities = [activity for mol, activity in sortedmollist[bgnidx:endidx]]
minpageactivities = min(pageactivities)
maxpageactivities = max(pageactivities)
opts.ClearMarkedValues()
if minpageactivities == maxpageactivities:
opts.AddMarkedValue(minpageactivities)
else:
opts.SetBoxRange(minpageactivities, maxpageactivities)
oegrapheme.OEDrawColorGradient(footer, colorg, opts)
|
The FadeCoreSubstructure function shows how to “fade” the bonds detected to be part of the core structure by using the OEHighlightByColor highlighting style.
1 2 3 4 5 6 | def FadeCoreSubstructure(disp, corematch):
bondpred = oechem.OEIsBondMember(corematch.GetTargetBonds())
lineWidthScale = 0.75
highlightstyle = oedepict.OEHighlightByColor(oechem.OEGrey, lineWidthScale)
oedepict.OEAddHighlighting(disp, highlightstyle, bondpred)
|
The HighlightByActivity function shows how to color the bonds not part of the core structure by the activity of the molecule by using the OEHighlightByStick highlighting style.
1 2 3 4 5 6 | def HighlightByActivity(disp, corematch, activity, colorg):
bondpred = oechem.OENotBond(oechem.OEIsBondMember(corematch.GetTargetBonds()))
color = colorg.GetColorAt(activity)
highlightstyle = oedepict.OEHighlightByStick(color)
oedepict.OEAddHighlighting(disp, highlightstyle, bondpred)
|
Download code
activity2pdf.py and supporting data set activity.sdf
Usage:
prompt > python3 activity2pdf.py -in activity.sdf -out activity.pdf -core "c1ccc2cc(ccc2c1)N"
See also in OEChem TK manual
Theory
- SD Tagged Data Manipulation section
API
- OEGetSDData function
- OEHasSDData function
- OELinearColorGradient class
- OEMatch class
- OESubSearch class
See also in OEDepict TK manual
Theory
- Highlighting chapter
- Molecule Alignment Based on Substructure Search section
- Multi Page Reports section
API
- OE2DMolDisplay class
- OE2DMolDisplayOptions class
- OEAddHighlighting function
- OEHighlightByColor class
- OEHighlightByStick class
- OEPrepareAlignedDepiction function
- OERenderMolecule function
- OEReport class
See also in GraphemeTM TK manual
API
- OEColorGradientDisplayOptions class
- OEDrawColorGradient function