Highlighting Fragments
Problem
You want to depict a molecule with highlighting of its fragments. See example in Table 1.
| OEGetFuncGroupFragments | OEGetRingChainFragments | OEGetRingLinkerSideChainFragments |
 |
 |
 |
Ingredients
|

Solution
The OEMedChem TK currently provides three ways to partition a molecule into fragments:
- OEGetRingChainFragments - fragments a molecule into ring and chain components.
- OEGetRingLinkerSideChainFragments - fragments a molecule into ring, linker and side-chain components as defined in [Bemis-1996] .
- OEGetFuncGroupFragments - fragments a molecule into ring and functional group components.
The depict_molecule_with_fragment_highlights function, that takes the following parameters, shows how to depict molecules with fragment highlighting.
- image
- An OEImage object which is a layout manager that allows generation of multi-page images.
- mol
- The molecule being fragmented.
- fragfunc
- The fragmentation function either OEGetRingChainFragments , OEGetRingLinkerSideChainFragments or OEGetFuncGroupFragments .
- opts
- An OE2DMolDisplayOptions object that defines the style of the molecule depiction.
First, the molecule is fragmented by invoking the ‘fragfunc’ fragmentation function (line 3). The fragmentation function partitions the molecule and returns an iterator over OEAtomBondSet objects each storing the atoms and bonds of a fragment. An OELinearColorGradient object is then created, based on the number of returned fragments (lines 6-8), and is used to highlight each fragment with a distinct color. After constructing the molecule display, the fragments are looped over and highlighted using the OEAddHighlighting function.
1 2 3 4 5 6 7 8 9 10 11 12 13 14 15 16 17 18 19 | def depict_molecule_with_fragment_highlights(image, mol, fragfunc, opts):
fraglist = [f for f in fragfunc(mol)]
nrfrags = len(fraglist)
colorg = oechem.OELinearColorGradient()
colorg.AddStop(oechem.OEColorStop(0, oechem.OEMediumYellow))
colorg.AddStop(oechem.OEColorStop(nrfrags, oechem.OEDarkBrown))
disp = oedepict.OE2DMolDisplay(mol, opts)
highlight = oedepict.OEHighlightByLasso(oechem.OEWhite)
highlight.SetConsiderAtomLabelBoundingBox(True)
for fidx, frag in enumerate(fraglist):
highlight.SetColor(colorg.GetColorAt(fidx))
oedepict.OEAddHighlighting(disp, highlight, frag)
oedepict.OERenderMolecule(image, disp)
|
Download code
Usage:
prompt > python3 frags2img.py -in molecule.ism -out fragments.png -fragtype ring-chain
Discussion
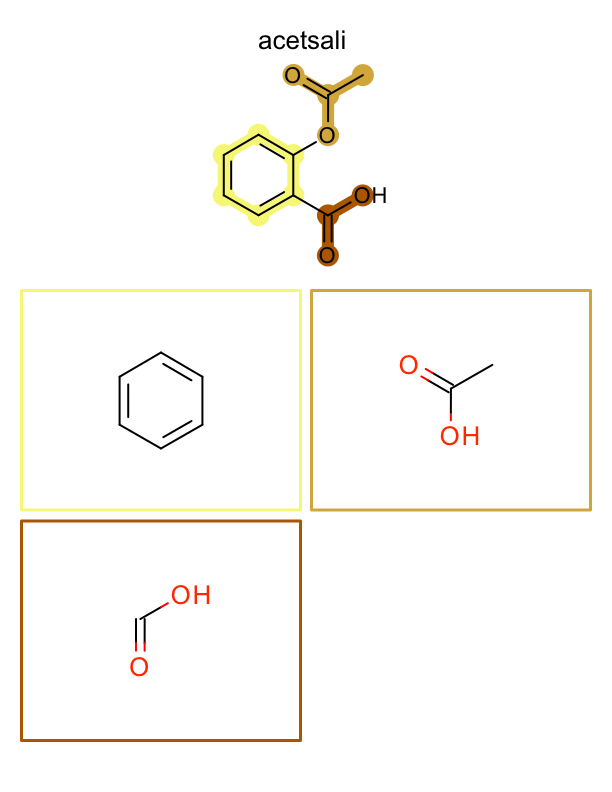
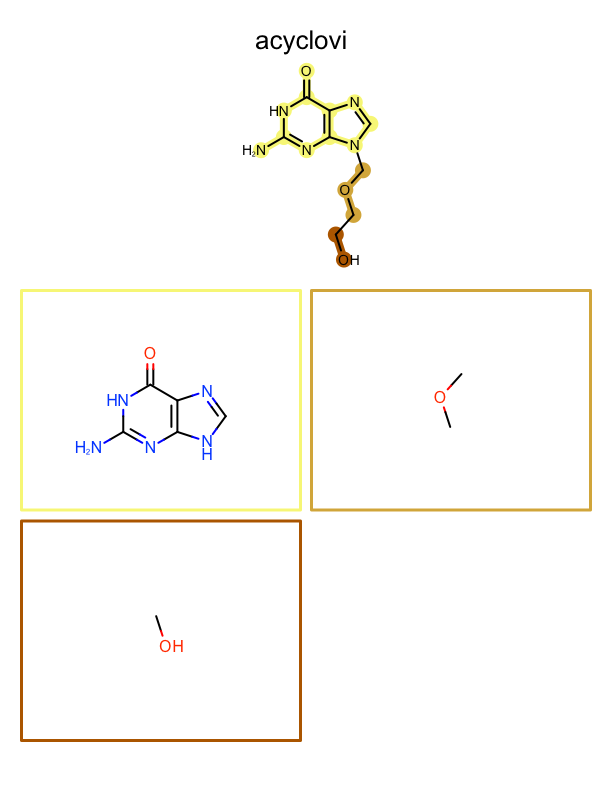
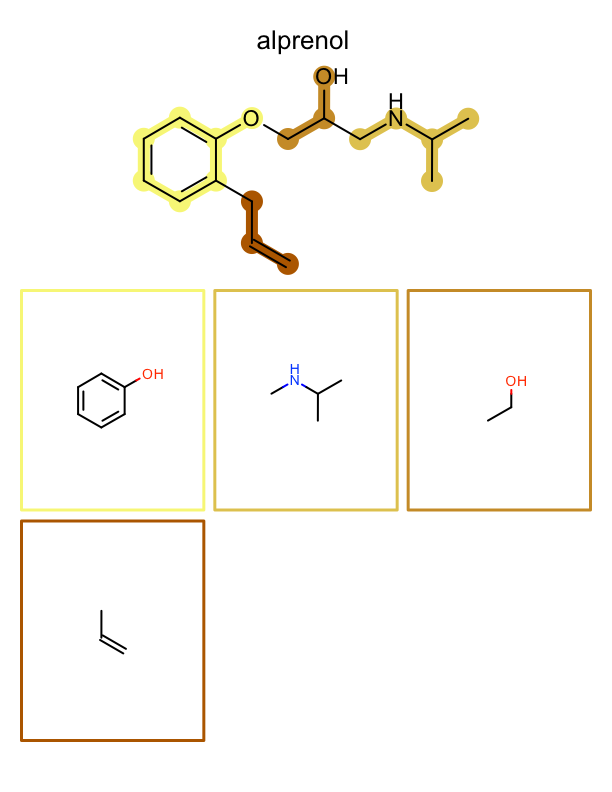
The example below generates a multi-page PDF document. At the top of each page an input molecule is rendered highlighting its fragments. These fragments are then depicted one by one on the page. See example in Figure: Example of depiction of molecules with their fragments.
1 2 3 4 5 6 7 8 9 10 11 12 13 14 15 16 17 18 19 20 21 22 23 24 25 26 27 28 29 30 31 32 33 34 35 36 37 38 39 40 41 42 43 44 45 46 47 48 49 50 51 52 53 54 55 56 57 58 59 60 61 62 63 64 | def DepictMoleculesWithFragments(report, mollist, fragfunc,
moldispopts, fragdispopts):
for mol in mollist:
body = report.NewBody()
oedepict.OEPrepareDepiction(mol)
header = report.GetHeader(report.NumPages())
# loop over input molecule and fragment
fragsets = [f for f in fragfunc(mol)]
fragmols = []
for fset in fragsets:
fragment = oechem.OEGraphMol()
fragpred = oechem.OEIsAtomMember(fset.GetAtoms())
adjustHCount = True
oechem.OESubsetMol(fragment, mol, fragpred, adjustHCount)
fragmols.append(oechem.OEGraphMol(fragment))
nrfrags = len(fragmols)
colorg = oechem.OELinearColorGradient(oechem.OEColorStop(0, oechem.OEYellowTint),
oechem.OEColorStop(nrfrags - 1, oechem.OEDarkOrange))
# render molecule with fragment highlights
cellwidth, cellheight = report.GetHeaderWidth(), report.GetHeaderHeight()
moldispopts.SetDimensions(cellwidth, cellheight, oedepict.OEScale_AutoScale)
disp = oedepict.OE2DMolDisplay(mol, moldispopts)
for fidx, fset in enumerate(fragsets):
color = colorg.GetColorAt(fidx)
oedepict.OEAddHighlighting(disp, color, oedepict.OEHighlightStyle_BallAndStick, fset)
oedepict.OERenderMolecule(header, disp)
# create fragment grid
rows = max(2, int(math.sqrt(nrfrags + 1)))
cols = max(2, int(nrfrags / rows) + 1)
grid = oedepict.OEImageGrid(body, rows, cols)
grid.SetCellGap(8.0)
cellwidth, cellheight = grid.GetCellWidth(), grid.GetCellHeight()
fragdispopts.SetDimensions(cellwidth, cellheight, oedepict.OEScale_AutoScale)
fragdispopts.SetTitleLocation(oedepict.OETitleLocation_Hidden)
# determine the scale factor to depict fragments with equal size
minscale = oedepict.OEGetMoleculeScale(mol, fragdispopts) * 1.25
for frag in fragmols:
minscale = min(minscale, oedepict.OEGetMoleculeScale(frag, fragdispopts))
fragdispopts.SetScale(minscale)
# render each fragments
for fidx, (cell, fmol) in enumerate(zip(grid.GetCells(), fragmols)):
oedepict.OEPrepareDepiction(fmol)
disp = oedepict.OE2DMolDisplay(fmol, fragdispopts)
oedepict.OERenderMolecule(cell, disp)
color = colorg.GetColorAt(fidx)
pen = oedepict.OEPen(oechem.OEWhite, color, oedepict.OEFill_Off, 3.0)
oedepict.OEDrawBorder(cell, pen)
|
Download code
Usage:
prompt > python3 frags2pdf.py -in molecules.ism -out fragments.pdf -fragtype func-group
| page 1 | page 2 | page 3 | .. |
|---|---|---|---|
|
|
|
.. |
See also in OEChem TK manual
Theory
- Predicates Functors chapter
API
- OEAtomBondSet class
- OEColorStop class
- OEIsAtomMember predicate
- OELinearColorGradient class
- OESubsetMol function
See also in OEMedChem TK manual
Theory
- Molecule Fragmentation chapter
API
- OEGetFuncGroupFragments function
- OEGetRingChainFragments function
- OEGetRingLinkerSideChainFragments function
See also in OEDepict TK manual
Theory
- Molecule Depiction chapter
- Highlighting chapter
API
- OE2DMolDisplay class
- OE2DMolDisplayOptions class
- OEAddHighlighting function
- OEGetMoleculeScale function
- OEImage class
- OEImageGrid class
- OEPrepareDepiction function
- OERenderMolecule function