OE2DPropMap
class OE2DPropMap
The OE2DPropMap class maps atom properties into a 2D grid and then blurs the image by using a Gaussian function. The points of the 2D grid are then colored using the OELinearColorGradient class that interpolates colors between a specified range.
See also
Depicting Property Maps chapter
Code Example
Visualizing Molecular Dipole Moment OpenEye Python Cookbook recipe
The OE2DPropMap class can be customized with the following properties:
Property
Get method
Set method
Corresponding namespace/class
legend font
legend font scale
legend location
maximum value
minimum value
negative color
positive color
radius ratio
grid resolution
Constructors
OE2DPropMap(backgroundColor: OEColor = OEColor(255, 255, 255)) -> OE2DPropMap
Default constructor.
OE2DPropMap(arg2: OE2DPropMap) -> OE2DPropMap
Copy constructor.
Render
Render(disp: OE2DMolDisplay, tagname: str) -> bool
Renders the property map into a molecule display.
- disp
The molecule display that holds the molecule for which the property map is calculated and on which the property map is drawn. The property map is drawn onto the below layer of the molecule display i.e., it appears underneath the molecular diagram.
- tagname
The generic data identifier that is used to retrieve the properties being depicted on the property map.
Render(image: OEImageBase, disp: OE2DMolDisplay, tagname: str) -> bool
Renders the property map into an image.
- image
The image on which the property map is drawn.
- disp
The molecule display that holds the molecule for which the property map is calculated.
- tagname
The generic data identifier that is used to retrieve the properties being depicted on the property map.
Render(disp: OE2DMolDisplay, refdisp: OE2DMolDisplay, tagname: str) -> bool
Renders the property map calculated for one display, onto another display.
- disp
The molecule display on which the property map is drawn. The property map is drawn onto the below layer of the molecule display i.e., it appears underneath the molecular diagram.
- refdisp
The molecule display that holds the molecule for which the property map is calculated.
- tagname
The generic data identifier that used to retrieve the properties being depicted on the property map.
GetLegendFont
GetLegendFont() -> OEFont
Returns the font that is used to render the title of the legend and the color stops of the linear color gradient.
See also
OE2DPropMap.SetLegendFontmethodOEFont class
GetLegendFontScale
GetLegendFontScale() -> float
Returns the multiplier that can be used to increase or decrease the size of the legend fonts.
See also
GetLegendLocation
GetLegendLocation() -> int
Returns the position of the legend.
The return value is taken from the
OELegendLocation namespace.
See also
OELegendLocationnamespace
GetMaxValue
GetMaxValue() -> float
Returns the maximum value that is used to construct the color gradient of the property map.
See also
OE2DPropMap.SetMaxValuemethod
GetMinValue
GetMinValue() -> float
Returns the minimum value that is used to construct the color gradient of the property map.
See also
OE2DPropMap.SetMinValuemethod
GetNegativeColor
GetNegativeColor() -> OEColor
Returns the color that is used to represent negative atom property values.
See also
OE2DPropMap.SetNegativeColormethodOEColor class
GetPositiveColor
GetPositiveColor() -> OEColor
Returns the color that is used to represent positive atom property values.
See also
OE2DPropMap.SetPositiveColormethodOEColor class
GetRadiusRatio
GetRadiusRatio() -> float
Returns he ratio that is used to scale the Gaussian radius.
See also
OE2DPropMap.SetRadiusRatiomethod
GetResolution
GetResolution() -> int
Returns the resolution of the property grid.
See also
OE2DPropMap.SetResolutionmethod
SetLegendFont
SetLegendFont(font: OEFont) -> None
Sets the font that is used to render the title of the legend and the color stops of the linear color gradient.
Note
The size of fonts of the legend also depends on
the scaling factor used to fit the linear color gradient into the
given dimensions and the multiplier set by the
OE2DPropMap.SetLegendFontScale
method.
Example (see Figure: Example of using the SetLegendFont method)
propmap = oegrapheme.OE2DPropMap()
font = oedepict.OEFont()
font.SetStyle(oedepict.OEFontStyle_Bold)
font.SetColor(oechem.OEDarkBlue)
propmap.SetLegendFont(font)
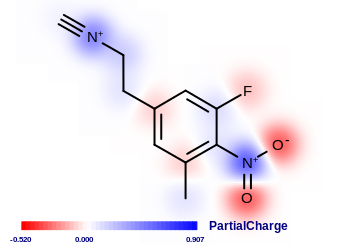
Example of using the SetLegendFont method
See also
OE2DPropMap.GetLegendFontmethodOEFont class
SetLegendFontScale
SetLegendFontScale(scale: float) -> None
Sets the multiplier that can be used to increase or decrease the size of the legend fonts.
- scale
This value has to be in the range of
[0.5, 2.0].
Example (see Figure: Example of using the SetLegendFontScale method)
propmap = oegrapheme.OE2DPropMap()
propmap.SetLegendFontScale(1.5)
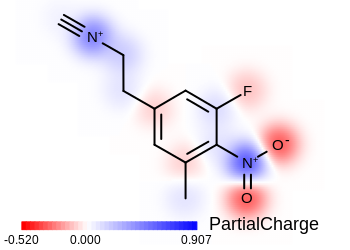
Example of using the SetLegendFontScale method
See also
SetLegendLocation
SetLegendLocation(loc: int) -> None
Sets the position of the legend.
- loc
This value has to be from the
OELegendLocationnamespace.
Example (see Figure: Example of using the SetLegendLocation method)
propmap = oegrapheme.OE2DPropMap()
propmap.SetLegendLocation(oegrapheme.OELegendLocation_Left)
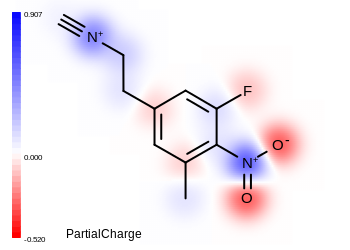
Example of using the SetLegendLocation method
See also
OELegendLocationnamespace
SetMaxValue
SetMaxValue(maxv: float) -> None
Sets the maximum value that is used to construct the
color gradient of the property map.
If no maximum value is specified prior to calling the
OE2DPropMap.Render method, then the
maximum value will be the largest atom property value.
Example (see Figure: Example of using the SetMaxValue method)
propmap = oegrapheme.OE2DPropMap()
propmap.SetMaxValue(0.0)
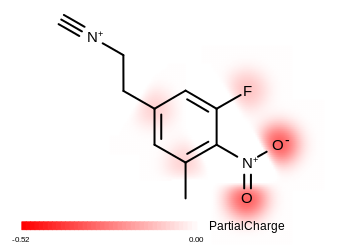
Example of using the SetMaxValue method
See also
OE2DPropMap.GetMaxValuemethod
SetMinValue
SetMinValue(minv: float) -> None
Sets the minimum value that is used to construct the
color gradient of the property map.
If no minimum value is specified prior to calling the
OE2DPropMap.Render method, then the
minimum value will be the smallest atom property value.
Example (see Figure: Example of using the SetMinValue method)
propmap = oegrapheme.OE2DPropMap()
propmap.SetMinValue(0.0)
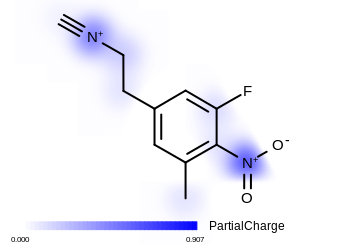
Example of using the SetMinValue method
See also
OE2DPropMap.GetMinValuemethod
SetNegativeColor
SetNegativeColor(color: OEColor) -> None
Sets the color that is used to represent negative atom property values.
Example (see Figure: Example of using the SetNegativeColor method)
propmap = oegrapheme.OE2DPropMap()
propmap.SetNegativeColor(oechem.OEDarkGreen)
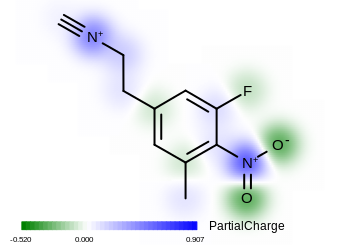
Example of using the SetNegativeColor method
See also
OE2DPropMap.GetNegativeColormethodOEColor class
SetPositiveColor
SetPositiveColor(color: OEColor) -> None
Sets the color that is used to represent positive atom property values.
Example (see Figure: Example of using the SetPositiveColor method)
propmap = oegrapheme.OE2DPropMap()
propmap.SetPositiveColor(oechem.OEDarkGreen)
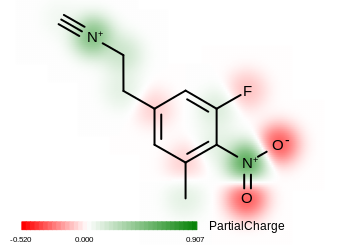
Example of using the SetPositiveColor method
See also
OE2DPropMap.GetPositiveColormethodOEColor class
SetRadiusRatio
SetRadiusRatio(ratio: float) -> None
Sets the ratio that is used to scale the Gaussian radius.
- ratio
This value has to be in the range of [0.5, 2.0].
Example (see Figure: Example of using the SetRadiusRatio method)
propmap = oegrapheme.OE2DPropMap()
propmap.SetRadiusRatio(0.75)
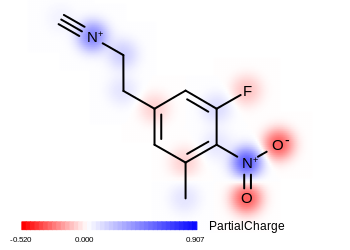
Example of using the SetRadiusRatio method
See also
OE2DPropMap.GetRadiusRatiomethod
SetResolution
SetResolution(resolution: int) -> None
Sets the resolution of the property grid.
- resolution
This value has to be in the range of [2, 20].
Example (see Figure: Example of using the SetResolution method)
propmap = oegrapheme.OE2DPropMap()
propmap.SetResolution(5)
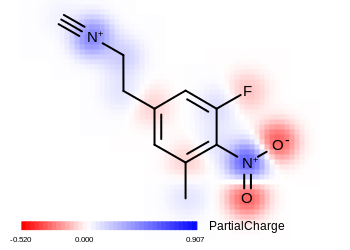
Example of using the SetResolution method
See also
OE2DPropMap.GetResolutionmethod.