Depicting Fragment Combinations
Problem
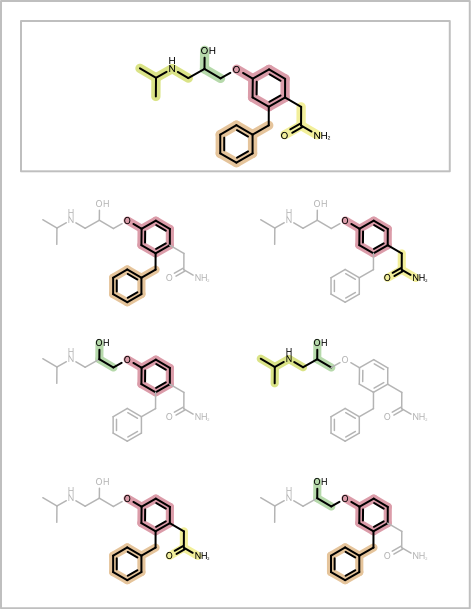
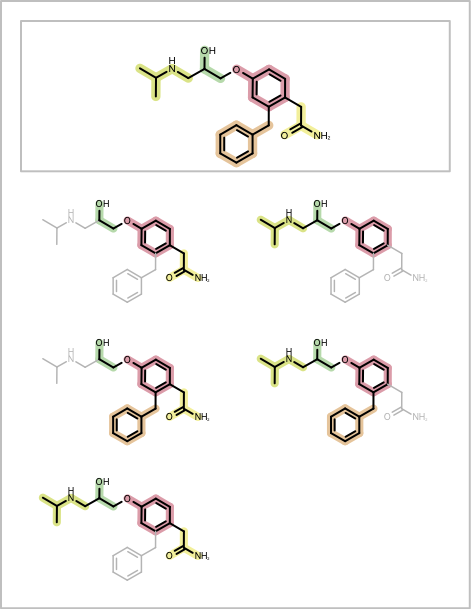
You want to depict fragment combinations generated by the algorithm described in the Enumerating Fragment Combinations. See example in Table 1.
| page 1 | page 2 |

|

|
Ingredients
|
Solution
The DepictMoleculeWithFragmentCombinations shows how to visualize fragment combinations returned by the GetFragmentAtomBondSetCombinations function. First a molecule is fragmented using one of the fragmentation functions described in the Enumerating Fragment Combinations section (see line 5 in the code below). Before enumerating the fragment combinations, an index is assigned to each bond of the molecule that indicates which fragment the bond belongs to (lines 9-13). Then a color list is created that is used by the ColorBondByFragmentIndex class to annotate the bonds based on their fragment index (lines 17-22). A highlighting style is also set up in order to fade part of the molecule that does not belong to a given fragment combination (lines 24-25). Then the GetFragmentAtomBondSetCombinations function is called that generates all adjacent fragment combinations and returns them as a list of OEAtomBondSet objects. Each fragment combination is then depicted in a separate cell of the report, by using highlighting and bond annotation (lines 33-47). Finally, in each page header the original molecule fragmentation is depicted (lines 51-59) .
1 2 3 4 5 6 7 8 9 10 11 12 13 14 15 16 17 18 19 20 21 22 23 24 25 26 27 28 29 30 31 32 33 34 35 36 37 38 39 40 41 42 43 44 45 46 47 48 49 50 51 52 53 54 55 56 57 58 59 60 | def DepictMoleculeWithFragmentCombinations(report, mol, fragfunc, opts):
# fragment molecule
frags = [f for f in fragfunc(mol)]
# assign fragment indexes
stag = "fragment idx"
itag = oechem.OEGetTag(stag)
for fidx, frag in enumerate(frags):
for bond in frag.GetBonds():
bond.SetData(itag, fidx)
# setup depiction styles
nrfrags = len(frags)
colors = [c for c in oechem.OEGetLightColors()]
if len(colors) < nrfrags:
colors = [c for c in oechem.OEGetColors(oechem.OEYellowTint, oechem.OEDarkOrange, nrfrags)]
bondglyph = ColorBondByFragmentIndex(colors, itag)
lineWidthScale = 0.75
fadehighlight = oedepict.OEHighlightByColor(oechem.OEGrey, lineWidthScale)
# generate adjacent fragment combination
fragcombs = GetFragmentAtomBondSetCombinations(mol, frags)
# depict each fragment combinations
for frag in fragcombs:
cell = report.NewCell()
disp = oedepict.OE2DMolDisplay(mol, opts)
fragatoms = oechem.OEIsAtomMember(frag.GetAtoms())
fragbonds = oechem.OEIsBondMember(frag.GetBonds())
notfragatoms = oechem.OENotAtom(fragatoms)
notfragbonds = oechem.OENotBond(fragbonds)
oedepict.OEAddHighlighting(disp, fadehighlight, notfragatoms, notfragbonds)
oegrapheme.OEAddGlyph(disp, bondglyph, fragbonds)
oedepict.OERenderMolecule(cell, disp)
# depict original fragmentation in each header
cellwidth, cellheight = report.GetHeaderWidth(), report.GetHeaderHeight()
opts.SetDimensions(cellwidth, cellheight, oedepict.OEScale_AutoScale)
opts.SetAtomColorStyle(oedepict.OEAtomColorStyle_WhiteMonochrome)
disp = oedepict.OE2DMolDisplay(mol, opts)
oegrapheme.OEAddGlyph(disp, bondglyph, oechem.IsTrueBond())
headerpen = oedepict.OEPen(oechem.OEWhite, oechem.OELightGrey, oedepict.OEFill_Off, 2.0)
for header in report.GetHeaders():
oedepict.OERenderMolecule(header, disp)
oedepict.OEDrawBorder(header, headerpen)
|
The ColorBondByFragmentIndex bond annotation class draws a “stick” underneath each bond (lines 20-24). The color of the “stick” is determined by the index attached to the bond as generic data (lines 17-18).
1 2 3 4 5 6 7 8 9 10 11 12 13 14 15 16 17 18 19 20 21 22 23 24 25 26 27 28 29 | class ColorBondByFragmentIndex(oegrapheme.OEBondGlyphBase):
def __init__(self, colorlist, tag):
oegrapheme.OEBondGlyphBase.__init__(self)
self.colorlist = colorlist
self.tag = tag
def RenderGlyph(self, disp, bond):
bdisp = disp.GetBondDisplay(bond)
if bdisp is None or not bdisp.IsVisible():
return False
if not bond.HasData(self.tag):
return False
linewidth = disp.GetScale() / 2.0
color = self.colorlist[bond.GetData(self.tag)]
pen = oedepict.OEPen(color, color, oedepict.OEFill_Off, linewidth)
adispB = disp.GetAtomDisplay(bond.GetBgn())
adispE = disp.GetAtomDisplay(bond.GetEnd())
layer = disp.GetLayer(oedepict.OELayerPosition_Below)
layer.DrawLine(adispB.GetCoords(), adispE.GetCoords(), pen)
return True
def ColorBondByFragmentIndex(self):
return ColorBondByFragmentIndex(self.colorlist, self.tag).__disown__()
|
Download code
The following will generate the multi-page PDF shown in Table 1.
Usage:
prompt > python3 enumfrags2pdf.py -in .ism -out enumfrags.pdf -fragtype funcgroup

CC(C)NCC(COc1ccc(c(c1)Cc2ccccc2)CC(=O)N)O
See also in OEChem TK manual
Theory
- Predicates Functors chapter
- Generic Data chapter
API
- OEAtomBondSet class
- OEColorStop class
- OEIsAtomMember predicate
- OEIsBondMember predicate
- OENotAtom predicate
- OENotBond predicate
- OELinearColorGradient class
See also in OEMedChem TK manual
Theory
- Molecule Fragmentation chapter
API
- OEGetFuncGroupFragments function
- OEGetRingChainFragments function
- OEGetRingLinkerSideChainFragments function
See also in OEDepict TK manual
Theory
- Molecule Depiction chapter
- Highlighting chapter
API
- OE2DMolDisplay class
- OEAddHighlighting function
- OEHighlightByColor class
- OERenderMolecule function
- OEReport class
See also in GraphemeTM TK manual
Theory
- Annotating Atoms and Bonds chapter
API
- OEAddGlyph function
- OEBondGlyphBase abstract base class
