Scalar Grids
A grid is a data container that holds a value at every point in a
three dimensional lattice. The simplest type of value to hold is a
floating point value. In OEChem TK, these are called
OEScalarGrids.
OEScalarGrids are inherently cubic.
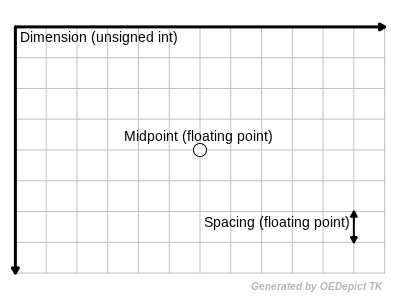
The following fundamental parameters define a grid:
- Dimension:
The number of grid points per axis
- Midpoint:
The center of the grid in Cartesian space
- Spacing:
The length between grid points

Fundamental Grid Parameters
Listing 1 demonstrates how to
construct a grid with
64 points in each direction, a midpoint at the origin, and a spacing
of 0.5 between each point in the grid.
Listing 1: Constructing a scalar grid
from openeye import oegrid

grid = oegrid.OEScalarGrid(64, 64, 64, 0.0, 0.0, 0.0, 0.5)
Note
The memory footprint of the grid is determined by the
dimensions. It is easy to create grids that are too large for
memory. For example, the grid in Listing 1
will consume \(64^3 * sizeof(float) = 1048576 bytes = 1 MB\) of
memory for this nominally sized grid.
Minimum and maximum
Every grid can have its maximum and minimum vales reported by GetXMax,
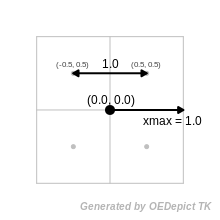
GetXMin etc. The image Grid coordinates shows a 2D representation
for simplicity. It shows 4 grid points centered at (0,0), with a
spacing of 1.0. Each grid point will have spatial coordinates
(0.5,0.5), (-0.5,0.5) etc. However each grid point lies at the center
of a pixel (or rather a voxel in 3D). Any property that falls into the
area (volume) of that grid point is mapped to that grid point. This
means that the maximum value of x is the extent of the grid, not just
the maximum value of the grid point coordinates. In this case that
value is 1.0.

Grid coordinates
Data Access
Grids provide three ways to index data inside the grid. They are ordered here by speed of access, i.e., grid elements perform simple pointer arithmetic where spatial coordinates require floating point computation.
- Grid Element:
Index into the underlying data array
- Grid Indices:
Unsigned integers less than the dimension for that axis
- Spatial Coordinates:
Cartesian coordinates of any point inside the grid, the grid will determine the closest grid point
Spatial Coordinates
Assuming grid is already filled with relevant values,
Listing 2 demonstrates
how to retrieve the grid value closest to the atoms in the molecule
mol.
Listing 2: Getting values associated with coordinates
for atom in mol.GetAtoms():
    x, y, z = mol.GetCoords(atom)
    if grid.IsInGrid(x, y, z):
        print("value = %.5f" % grid.GetValue(x, y, z))
Spatial coordinates can also be used to set data on the grid.
Listing 3 demonstrates
how to assign an atom’s partial charge to the grid point it is closest
to.
Listing 3: Setting values associated with coordinates
for atom in mol.GetAtoms():
    x, y, z = mol.GetCoords(atom)
    if grid.IsInGrid(x, y, z):
        grid.SetValue(x, y, z, atom.GetPartialCharge())
Note
In the preceding two code fragments bounds checking was explicitly
performed using the
IsInGrid
method. Accessing data outside the grid is undefined behavior
(usually a segmentation fault). However,
IsInGrid can become an
expensive operation if performed excessively. One way to avoid this
cost is to make sure your grid is big enough to enclose the object
being worked on. See
OEMakeGridFromCenterAndExtents for an example
of constructing a grid that covers the entire molecule to ensure no
spatial coordinate access is outside the bounds of the grid.
Grid Indices
Grid indices are faster than spatial coordinates because there is no
floating point arithmetic to perform. Grid indices make it easy to
iterate over the neighbors of any particular point in the
grid. Listing 4
demonstrates iterating over all 27 grid points adjacent to and
including the grid point given by the grid indices: ix, iy,
iz.
Listing 4: Iterating over neighbor points
x, y, z = mol.GetCoords(atom)

ix, iy, iz = grid.SpatialCoordToGridIdx(x, y, z)

# Make sure not to go past grid bounds
mini = max(ix - 1, 0)
minj = max(iy - 1, 0)
mink = max(iz - 1, 0)
maxi = min(ix + 2, grid.GetXDim())
maxj = min(iy + 2, grid.GetYDim())
maxk = min(iz + 2, grid.GetZDim())

for k in range(mink, maxk):
    for j in range(minj, maxj):
        for i in range(mini, maxi):
            print("value = %.5f" % grid.GetValue(i, j, k))
Grid Elements
Grid values are actually stored in a large one dimensional block of
memory. The fastest way to access all the data is to linearly scan
through memory. Listing 5
demonstrates how to square every value in the grid.
Listing 5: Squaring every grid value
for i in range(grid.GetSize()):
    val = grid.GetValue(i)
    grid.SetValue(i, val * val)
Input and Output
The following grid file formats are supported:
Grid File Type (or reader) |
File Extension(s) |
Description |
Read |
Write |
|---|---|---|---|---|
|
GRASP |
Yes |
Yes |
|
|
OpenEye Binary format |
Yes |
Yes |
|
|
OpenEye ASCII format |
Yes |
Yes |
|
|
CCP4 format |
Yes |
Yes |
|
|
XPLOR format |
Yes |
No |
|
|
MTZ crystallographic reflection format |
Yes |
No |
The ASCII format (.agd) was developed by OpenEye to allow for easy
integration with other software. The following is an example of the
ASCII output for a grid centered at the origin, 2 points along
each axis, a spacing of 0.5, and every value zero.
Title: Example Grid
Mid:     0.000000     0.000000     0.000000
Dim:      2      2      2
Spacing:     0.500000
Values:
0.000000e+00
0.000000e+00
0.000000e+00
0.000000e+00
0.000000e+00
0.000000e+00
0.000000e+00
0.000000e+00
Listing 6 is the code used to write the ASCII
format out. It is provided here to leave no doubt as to how to
inter-operate with the format.
Listing 6: Writing the ASCII format
from openeye import oegrid

grid = oegrid.OEScalarGrid(2, 2, 2, 0.0, 0.0, 0.0, 0.5)
grid.SetTitle("Simple Grid")

print("Title:", grid.GetTitle())

print("Mid: %12.6f %12.6f %12.6f" % grid.GetMid())

print("Dim: %6d %6d %6d" % grid.GetDim())

print("Spacing: %12.6f" % grid.GetSpacing())

print("Values:")
for iz in range(grid.GetZDim()):
    for iy in range(grid.GetYDim()):
        for ix in range(grid.GetXDim()):
            print("%-12.6e" % grid.GetValue(ix, iy, iz))
Grid as Generic Data
Grids can also be attached to molecules and then written out to
OEBinary (.oeb) files. A visualizer can then read in the
molecule and grid without any other means of making the association.
Listing 7
demonstrates how to attach a Gaussian grid to the molecule it was
created from.
The grid is attached to a molecule using the ‘generic data’ interface provided by the OEBase base class. This allows an arbitrary number of grids (or any type of data) to be attached to molecules. Since all grids also derive from OEBase generic data can be attached to grids as well allowing for arbitrarily complex data hierarchies.
Listing 7: Attaching a grid to a molecule
grid = oegrid.OEScalarGrid()
oegrid.OEMakeMolecularGaussianGrid(grid, mol, 0.5)

mol.SetData("Gaussian Grid", grid)

oechem.OEWriteMolecule(ofs, mol)
See also
Generic Data chapter