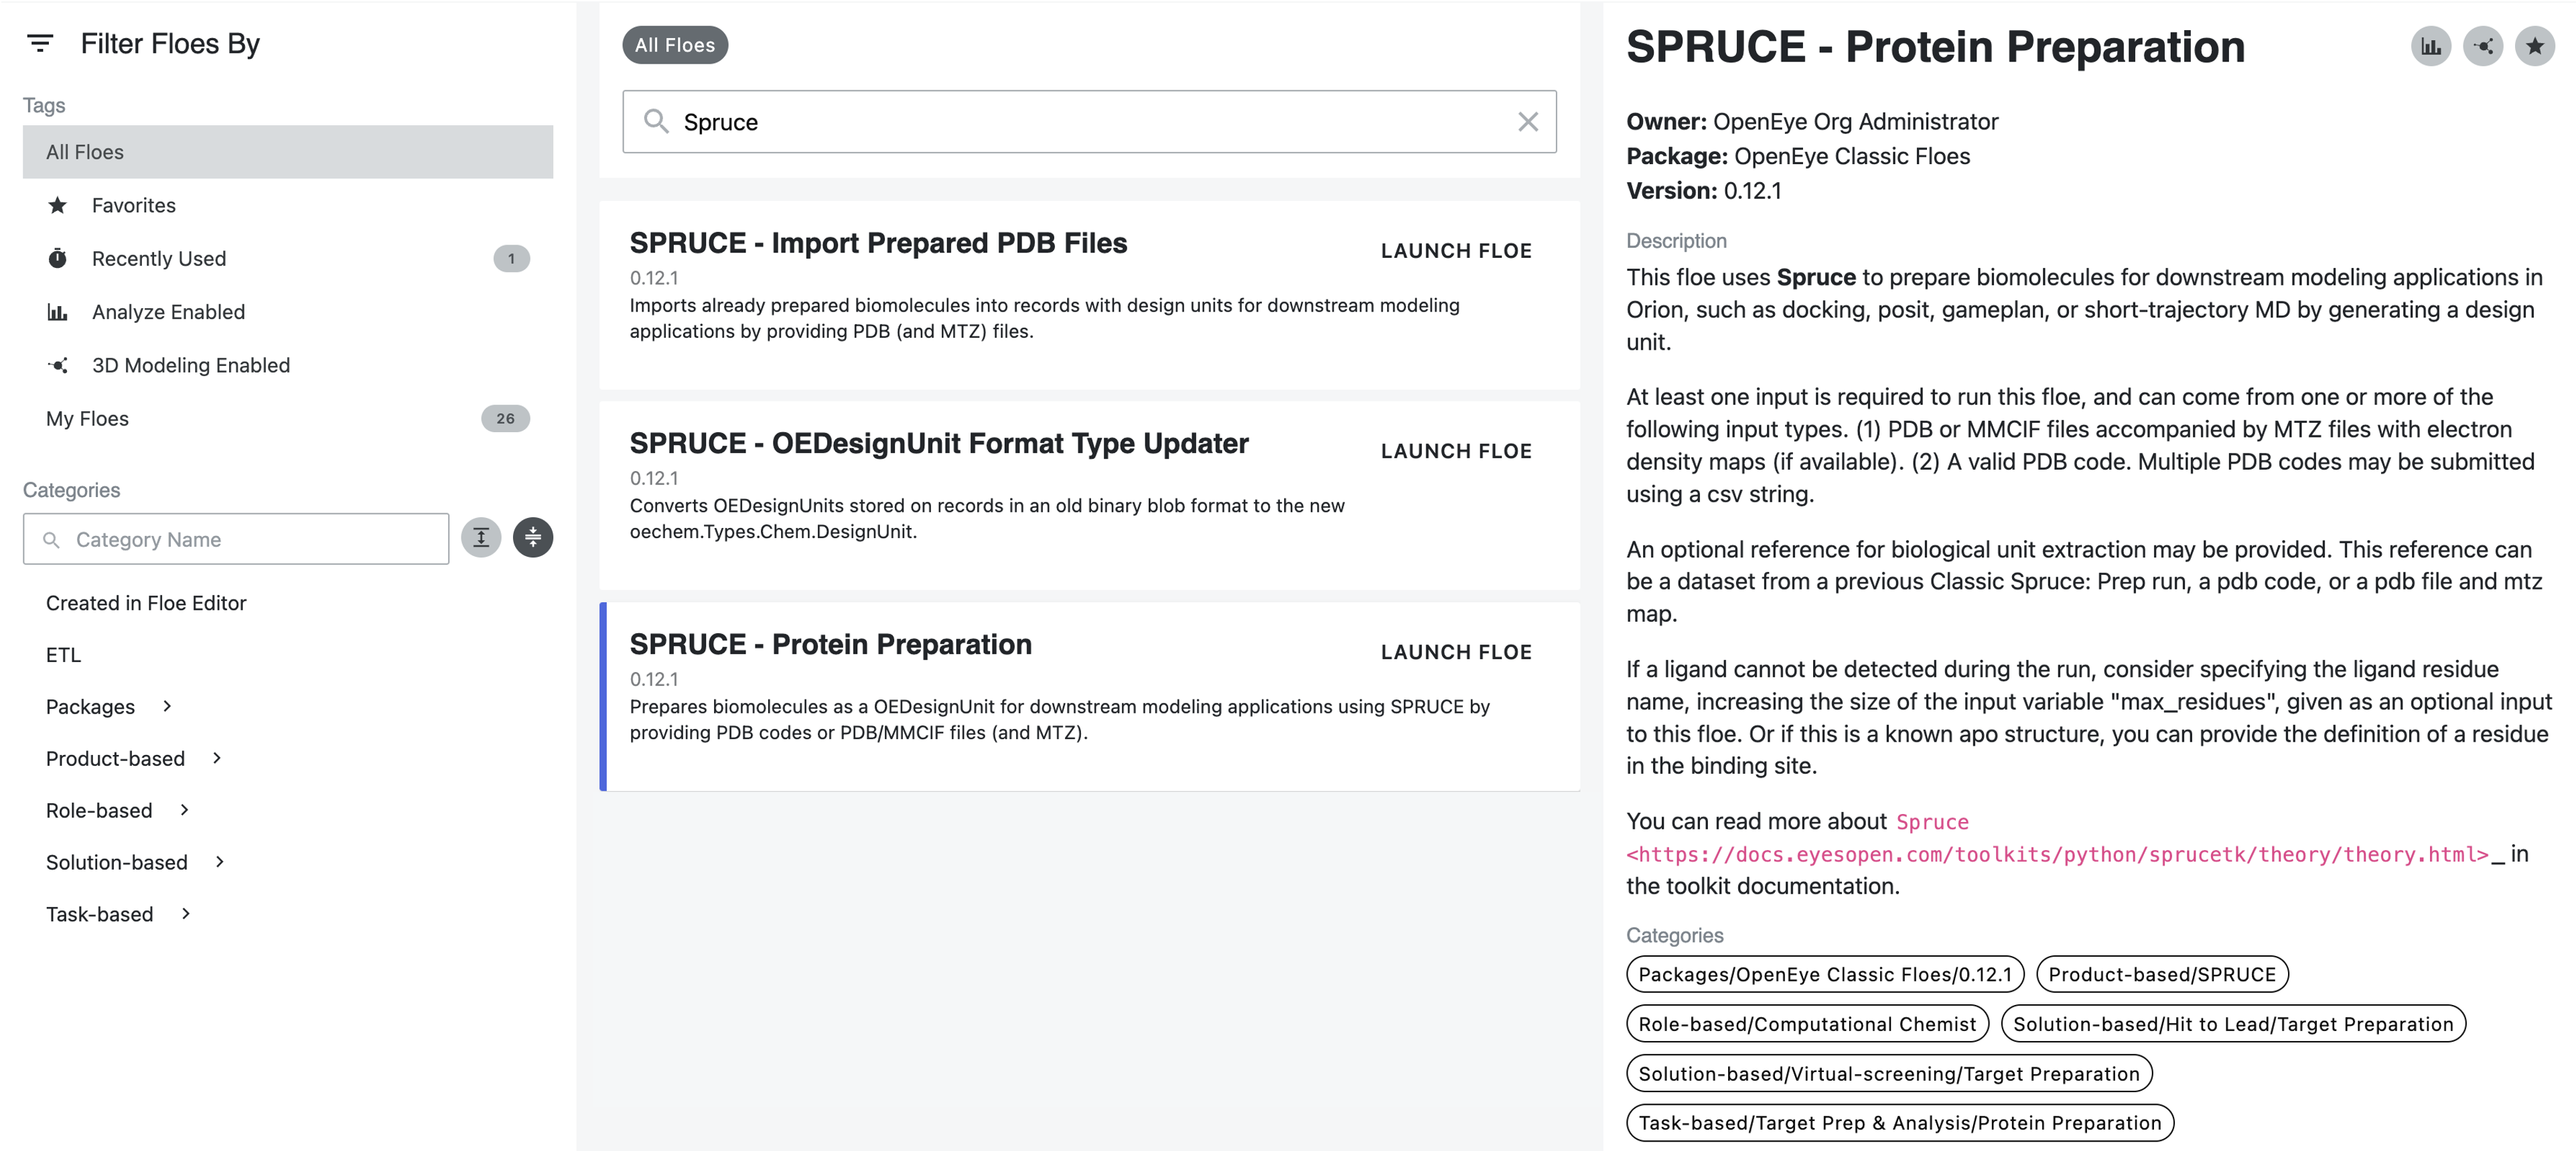
Spruce Prep Tutorial
The Spruce Protein Preparation Floe(s) use SPRUCE to prepare biomolecular systems for use in downstream modeling applications. The Floe generates a single or a set of prepared design units with associated depictions, e.g. to illustrate the protein-ligand binding site interactions, as well as the Iridium classification.
The preparation steps of the Floe include:
Expansion of the asymmetric unit to the biological unit (if necessary, e.g. if structure is from an X-ray crystallography experiment). The biological unit being what is known of believed to be the form the protein(s) take in-vivo or in-vitro.
Enumeration (default) or collapse of alternate locations
Building missing pieces, e.g. partial sidechains, modeling missing loops and tails, capping chain breaks
Placement and optimization of hydrogen atoms including tautomer enumeration of ligands and cofactors as well as evaluation of those tautomer states in the biomolecule structure
The protein and ligand are assigned partial charges (AmberFF99SB and AM1BCC, respectively) and the output dataset is ready for downstream structure-based modeling tasks.
Floes Used in the Tutorials
The floes used in this tutorial are documented here:
The two floes mentioned above are identical, except for the inputs. Both are shown below.
To run the Spruce Protein Preparation Floes, navigate to the Floe tab in Orion, then:
Select the “OpenEye Classic Floes” package in the dropdown list
Type “SPRUCE” in the search box.
Click either “SPRUCE - Protein Preparation from PDB Codes” or “SPRUCE - Protein Preparation from PDB Files” to open the Job Form.
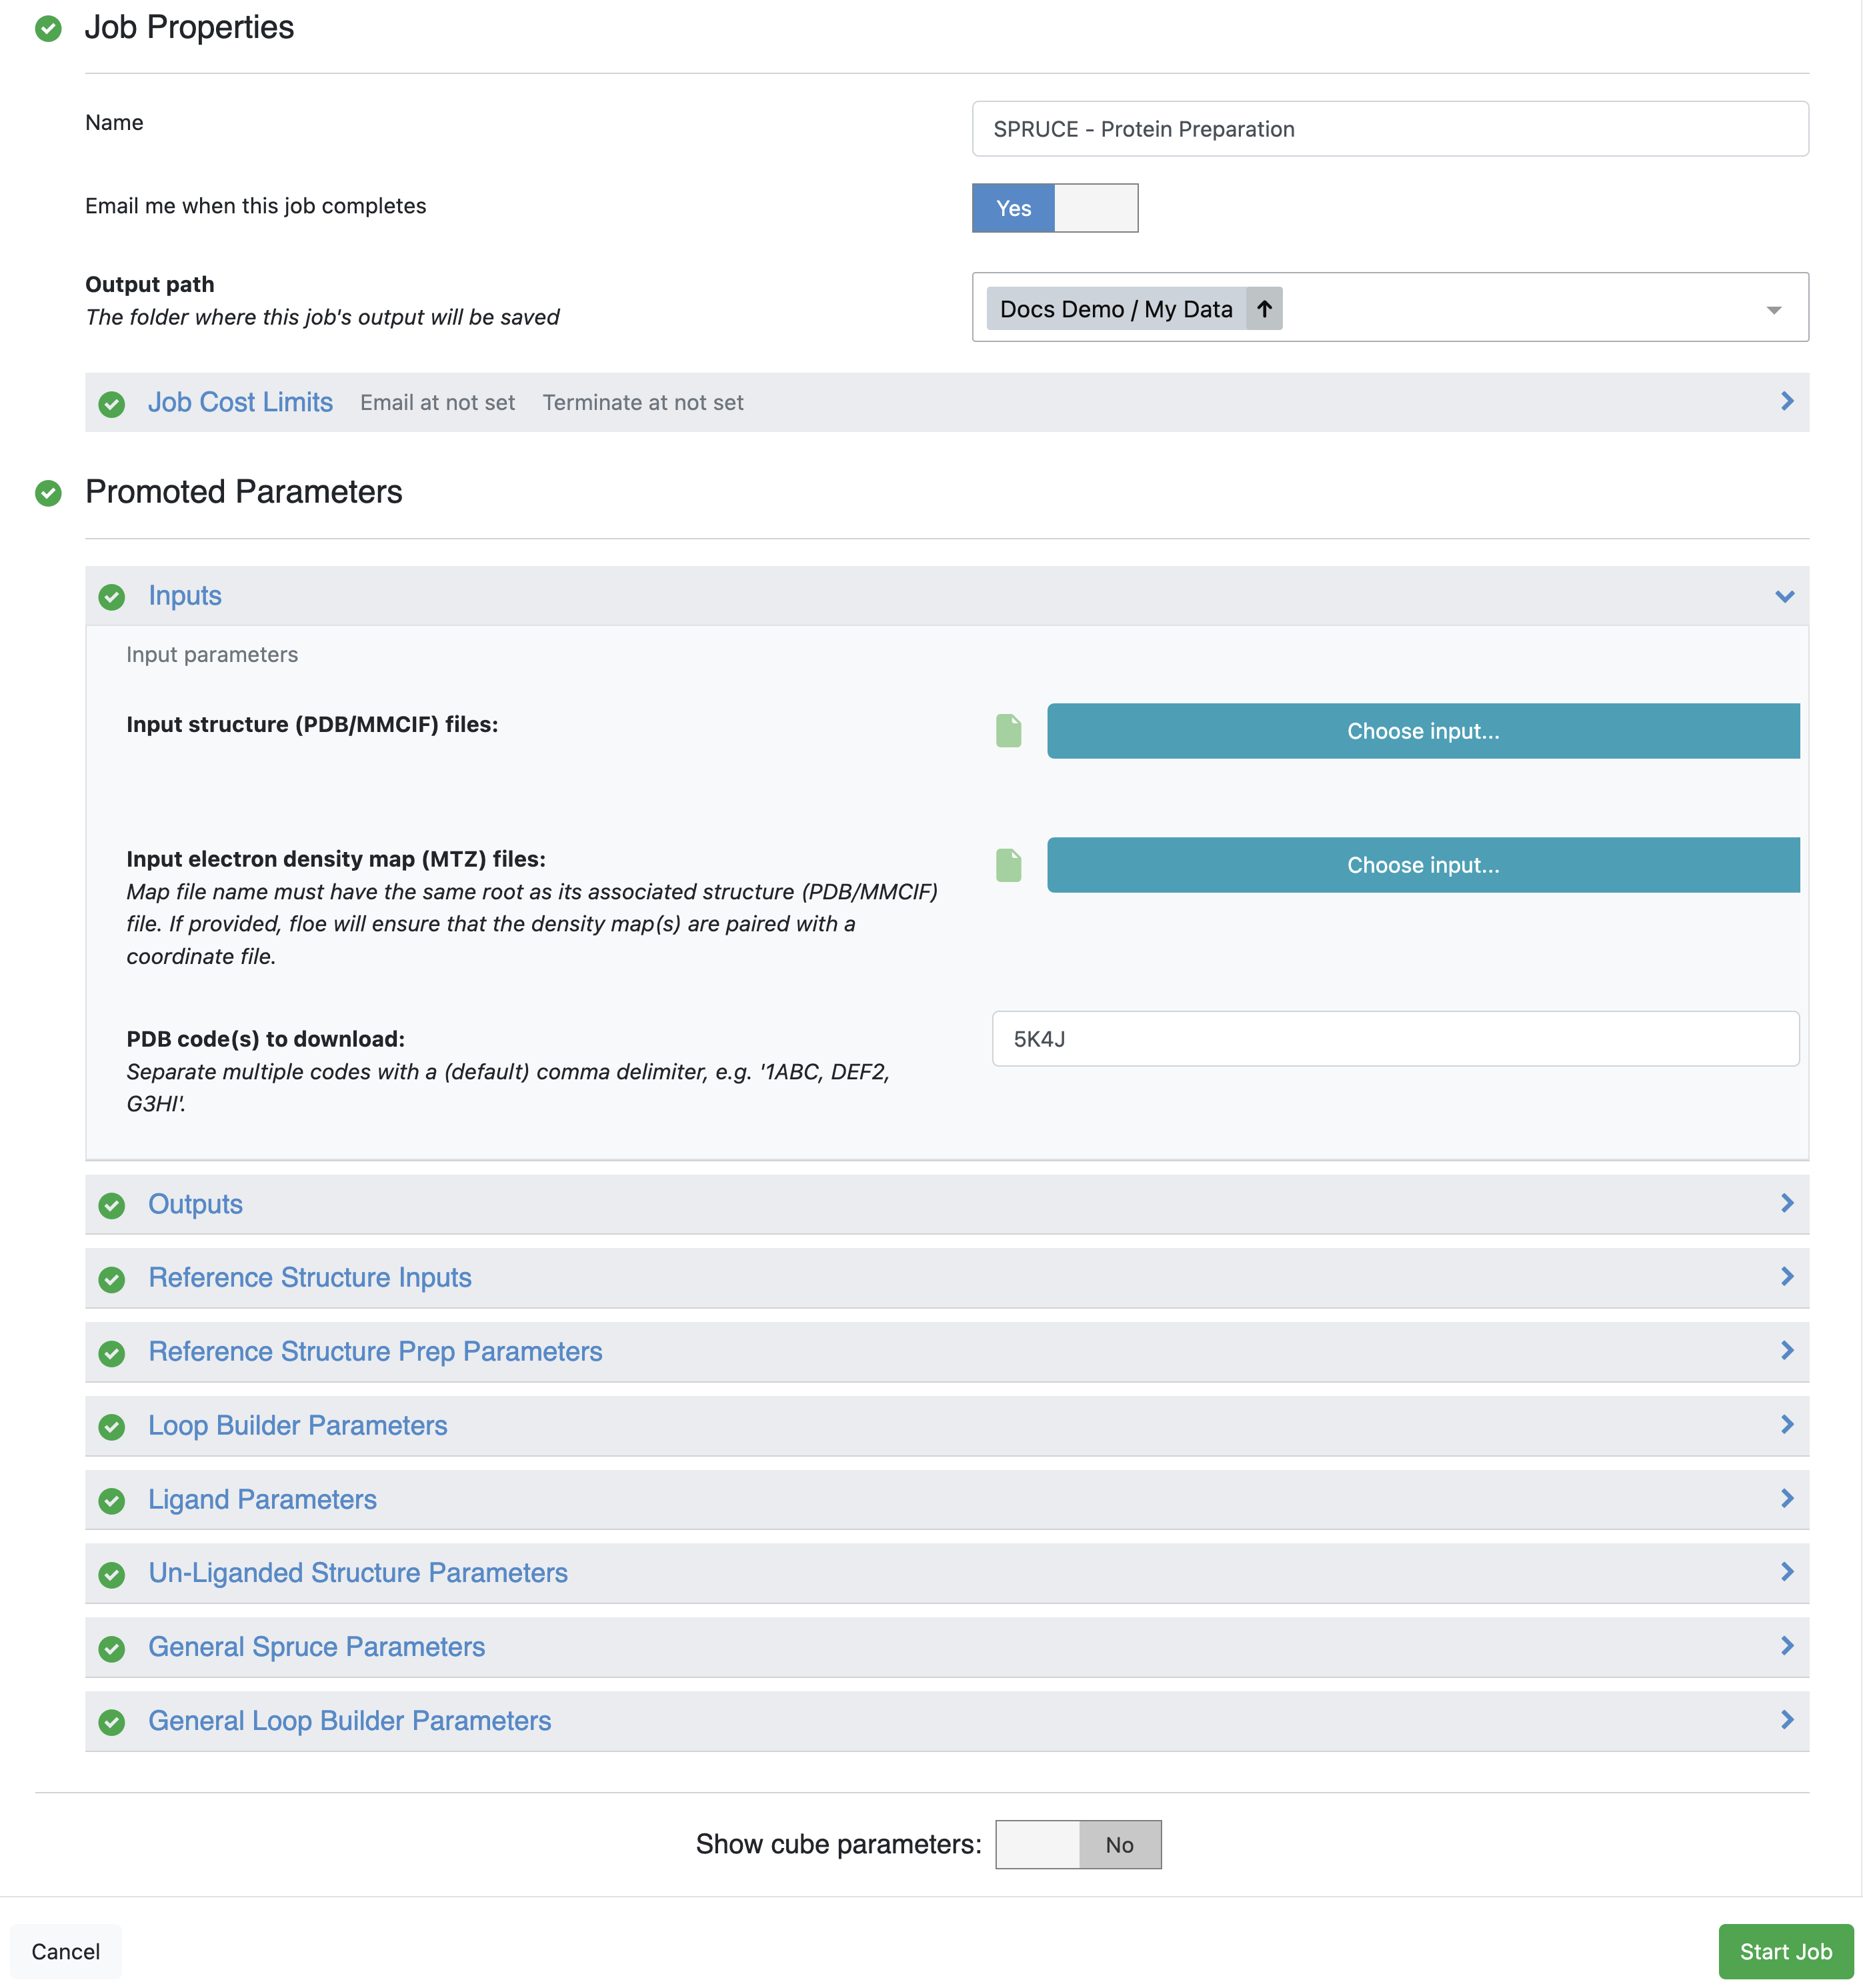
Run the Spruce Protein Preparation Floe(s)
The first floe takes a list of PDB codes and pulls the structures and their associated electron density maps (mtz files) from the PDB server hosted at the RCSB.
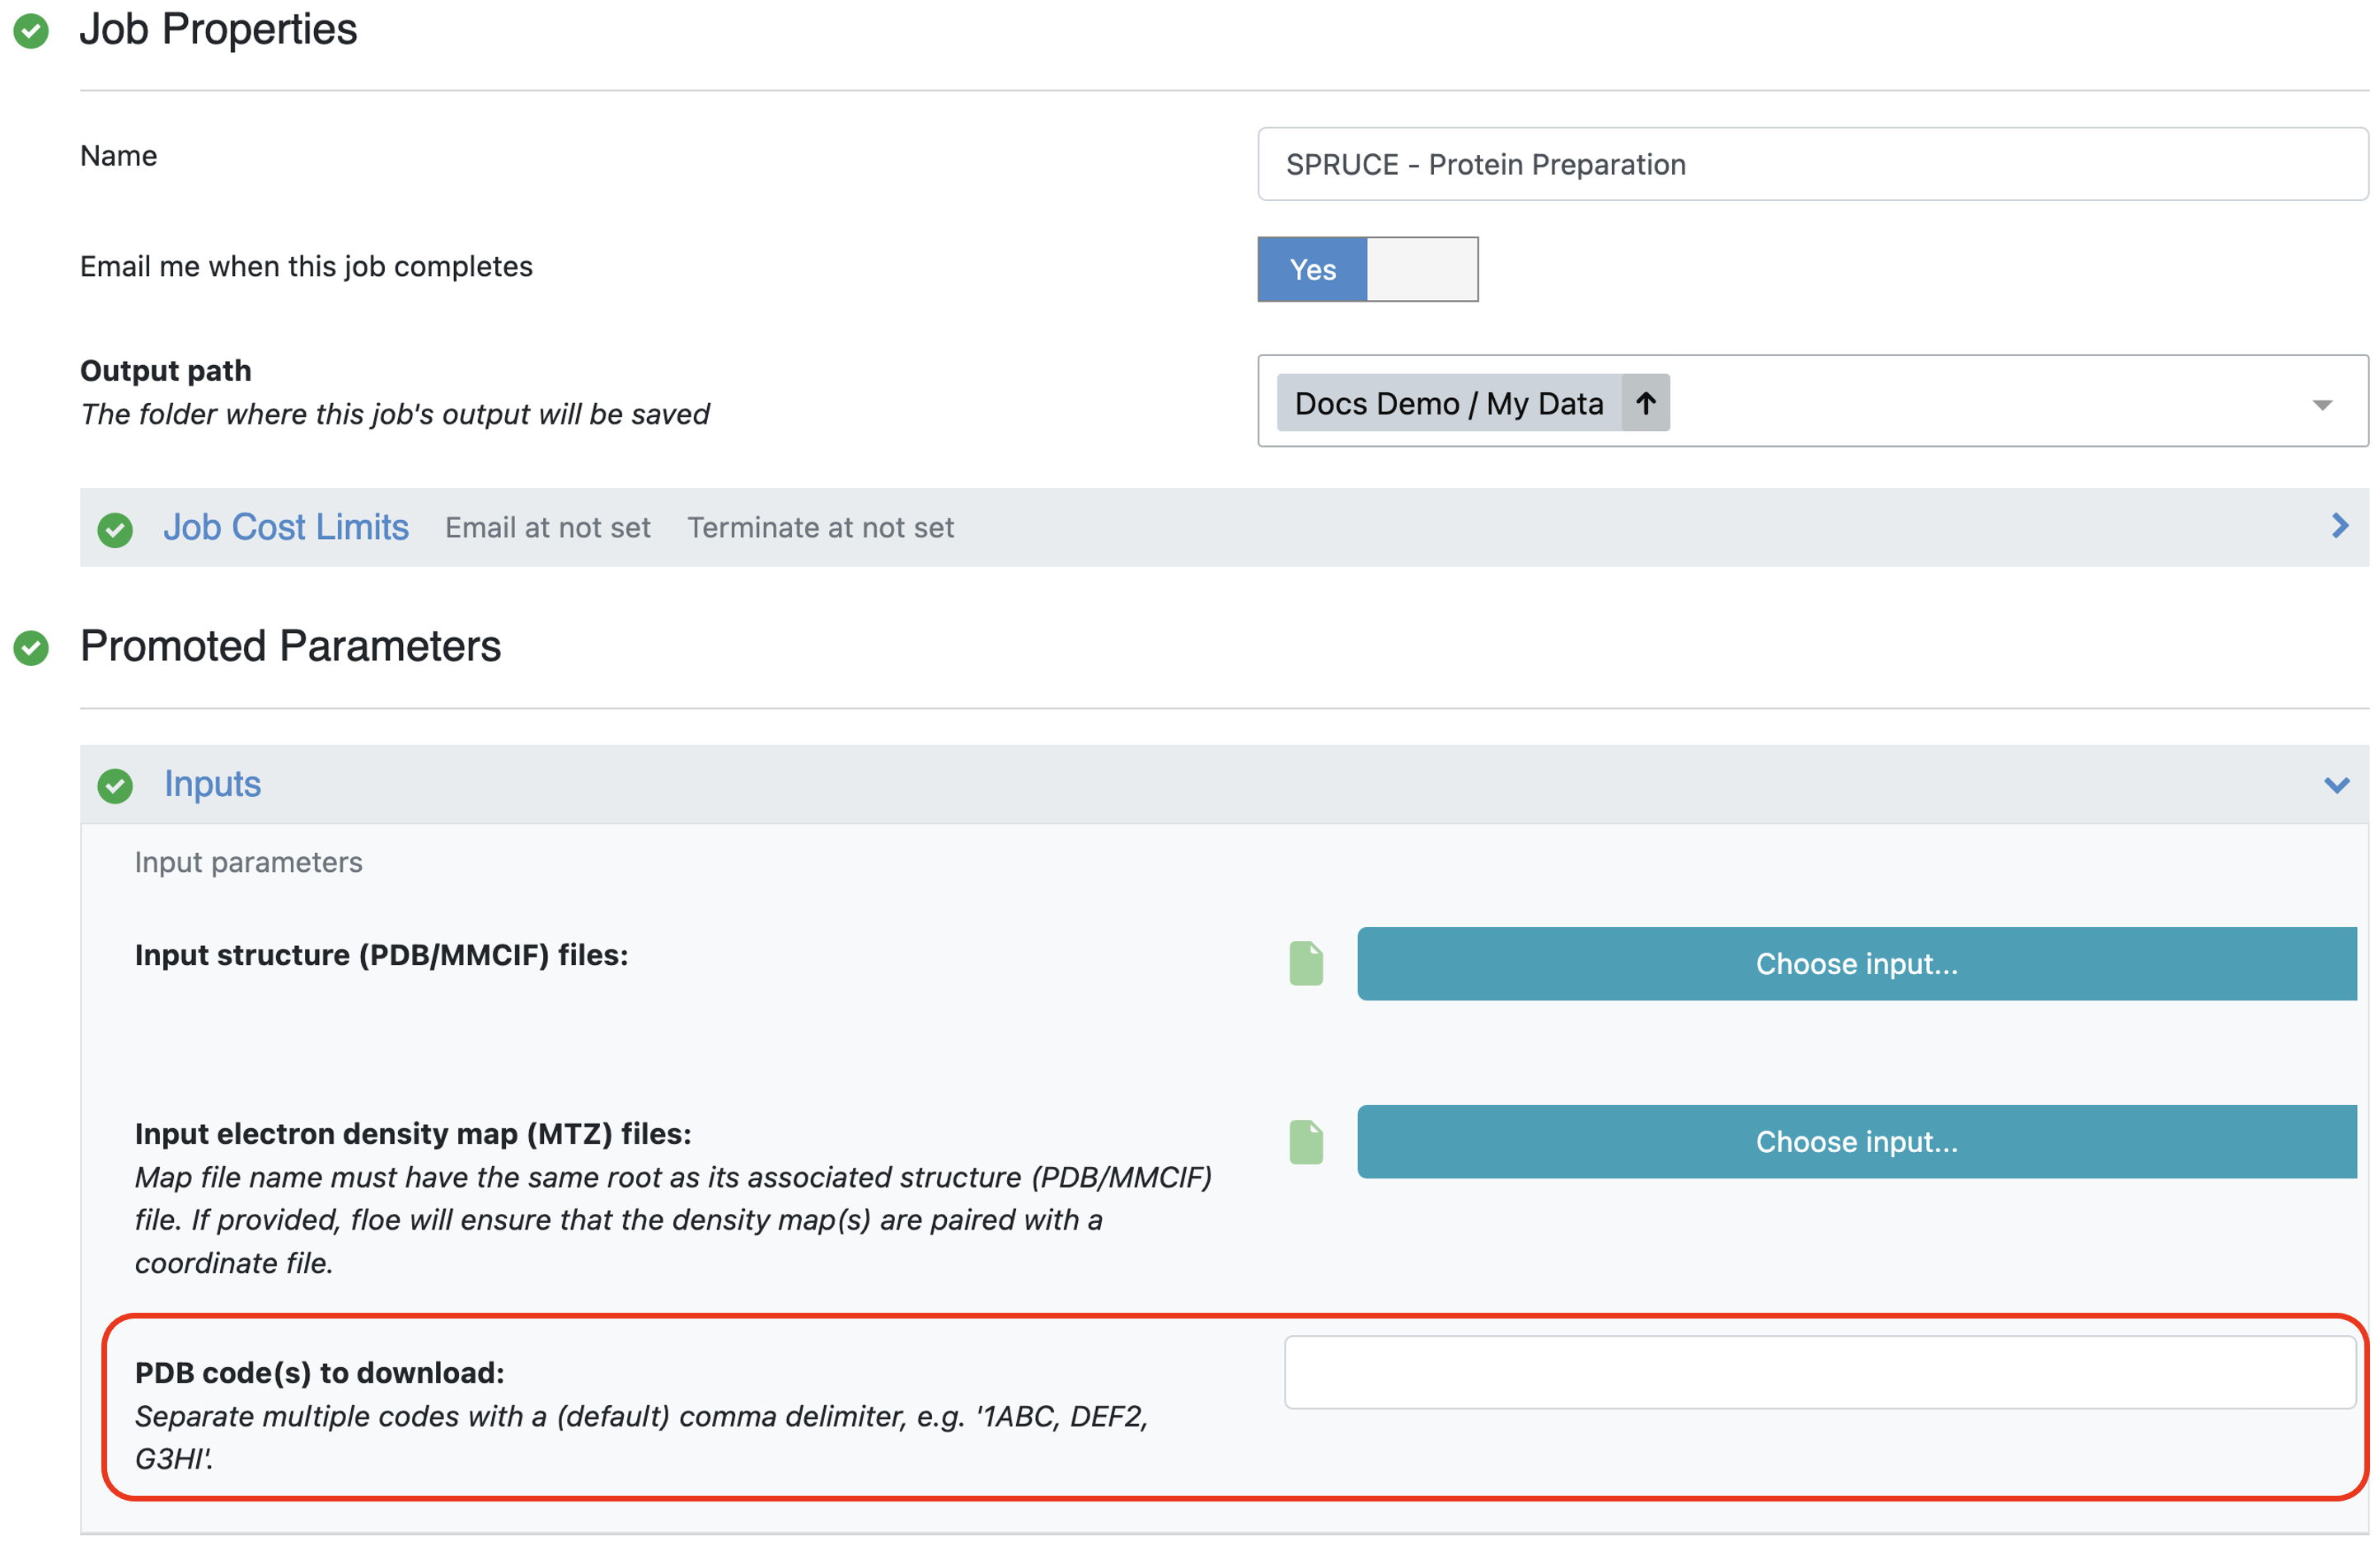
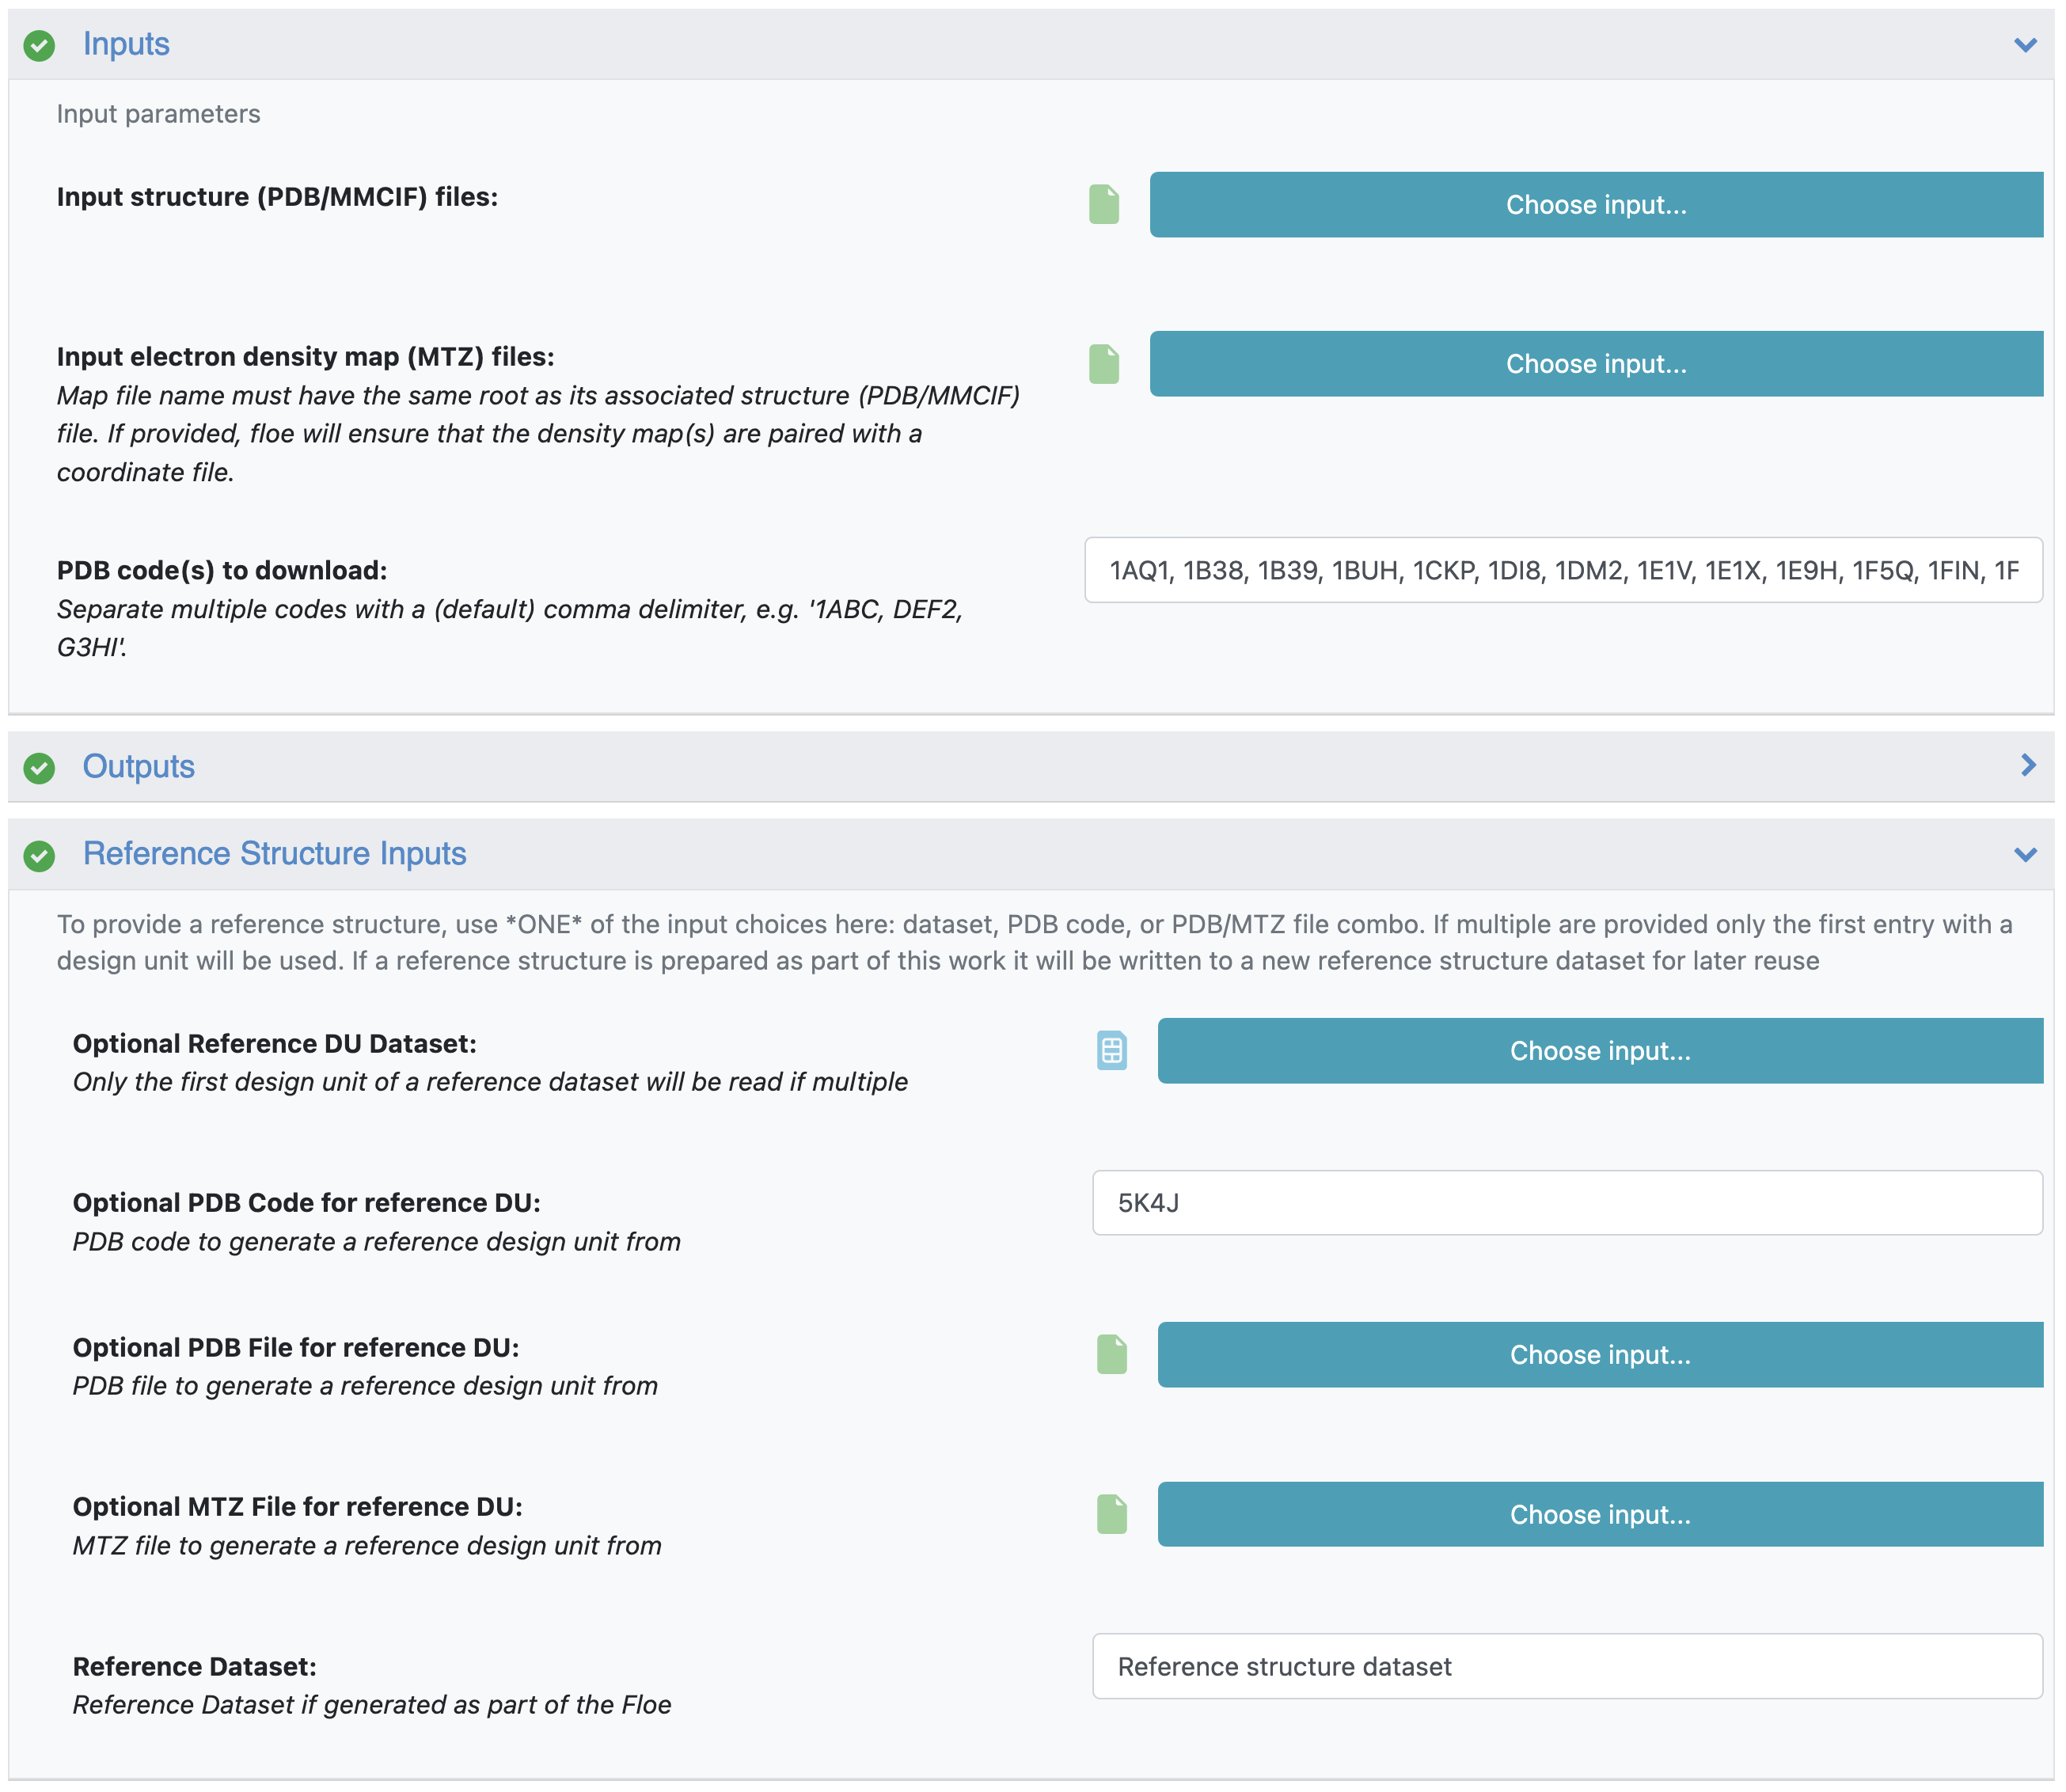
Provide PDB code(s) as input
The second floe accepts a list of PDB files. These can already be uploaded to Orion or can be uploaded as part of the job submission. We recommend providing the associated MTZ files to enable calculation of the Iridium classification, and to provide electron density grids for structure inspection after preparation.
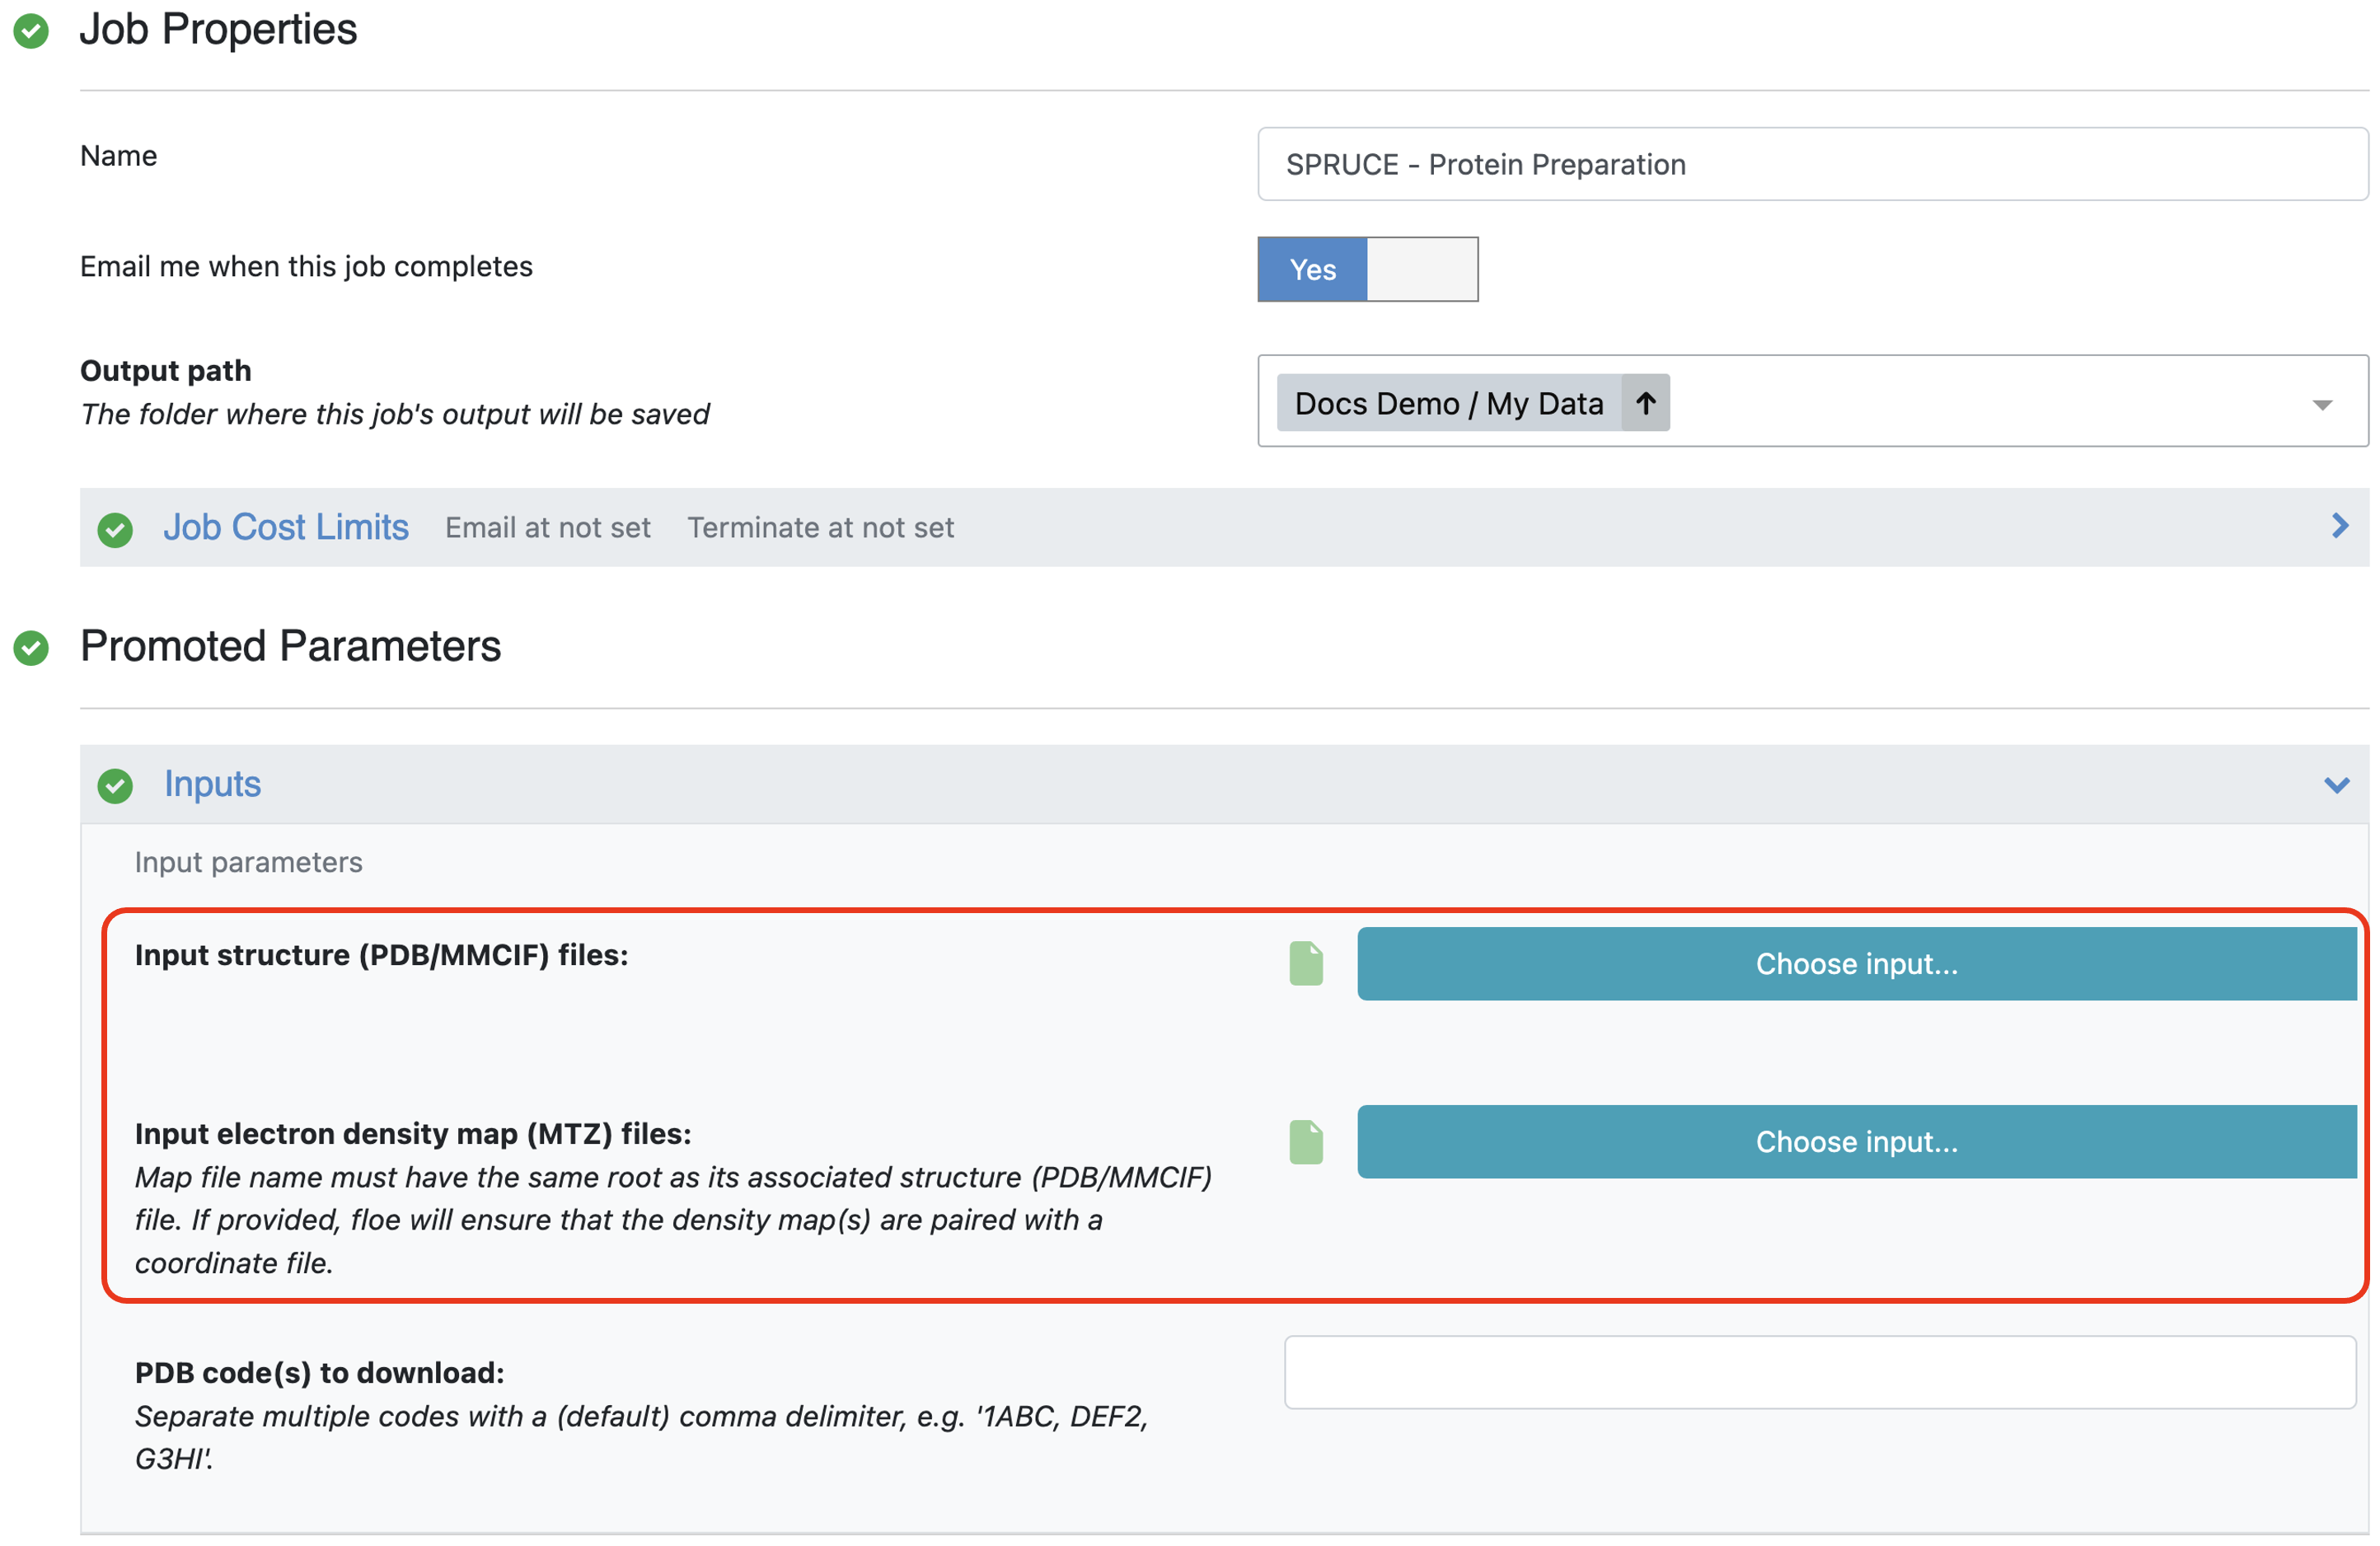
Provide PDB and MTZ file(s) as input
The files can be uploaded from a computer, pulled from a URL, or files already in Orion can be used.
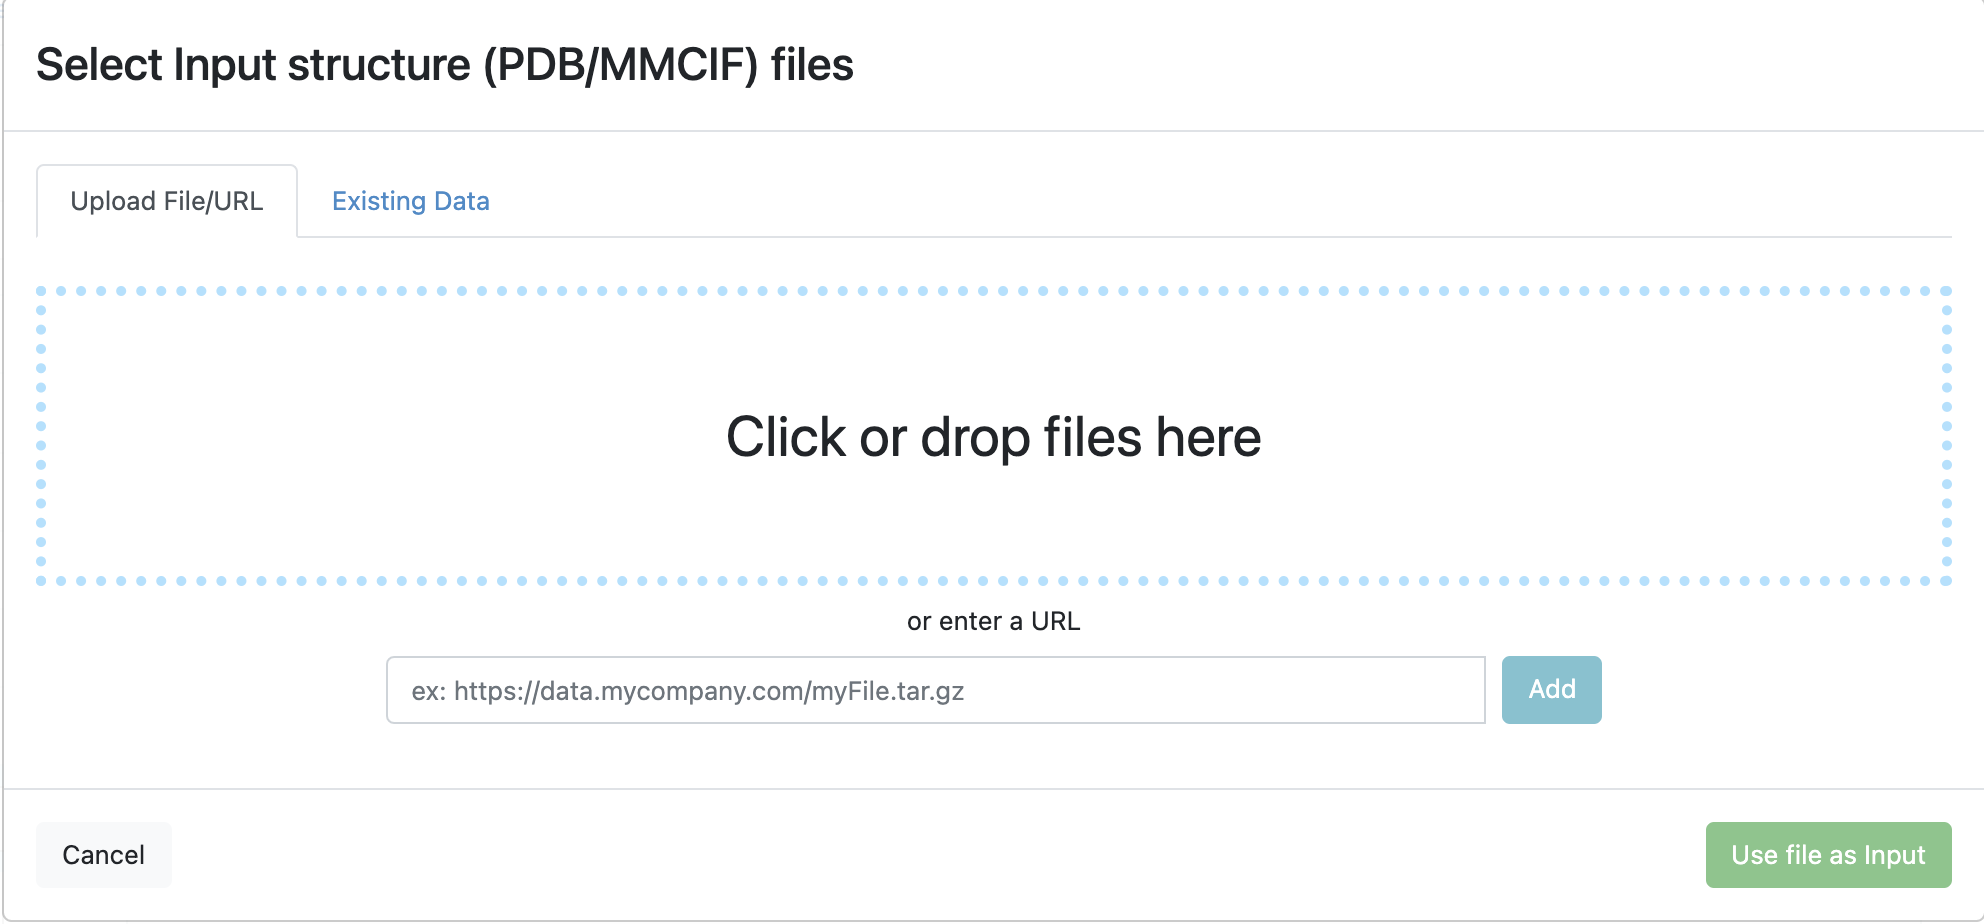
Files can be uploaded or existing files in Orion can be used
These are all the required inputs. The remaining inputs are optional and described in more detail in the FAQ and How To Guide.
Run the Protein Preparation Floes
An extracellular signal-regulated kinase 1/2 inhibitor (CDK2; PDB code is 5K4J) is used in the tutorials.
The protein and bound ligand can be prepared using the
SPRUCE - Protein Preparation from PDB Codes Floe.
Spruce Floe Parameters
The output dataset can be viewed in the analyze page or the 3D view. In this case, we will use this dataset as the reference design unit (DU) while preparing more structures of this same target.
Run the Protein Preparation Floes Using a Reference Design Unit
The 5K4J structure is based on the P24941 UniprotKB ID, we can use this ID to search the PDB: Results.
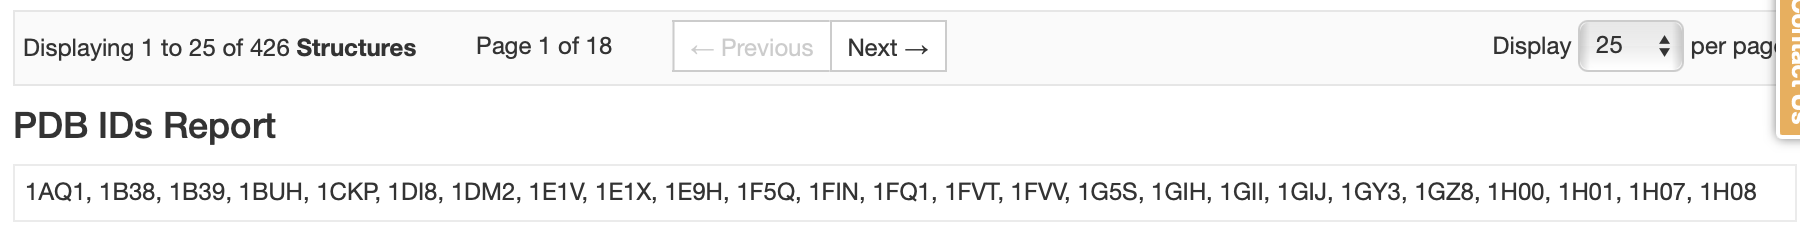
RCSB Search Results
This results in a list of 426 PDB codes. For this tutorial, we are going to prepare the first 25 hits with Spruce, using the design unit prepared in the previous step from 5K4J as reference DU.
CDK2 subset prep with reference DU
Reviewing the Floe Reports
This results in a dataset with 34 design units, and a dataset with one failed record. While the structure corresponding to the failed record, PDB code 1GY3, contains CDK2, it is actually the structure of CDK2 in complex with Cyclin A, and therefore does not match our reference DU.
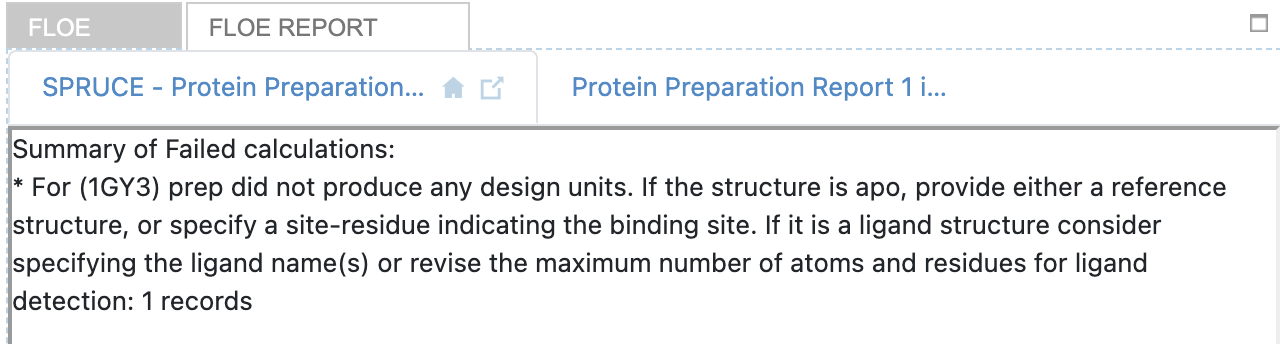
Report of failed structures
The 34 prepared design units from 24 PDB files are a result of multiple biological units generated from the crystal structure asymmetric unit, and certain experiments with alternate locations (configurations) near or in the binding site of interest. A floe report is also generated detailing issues with the prepared design units that may need further inspection.
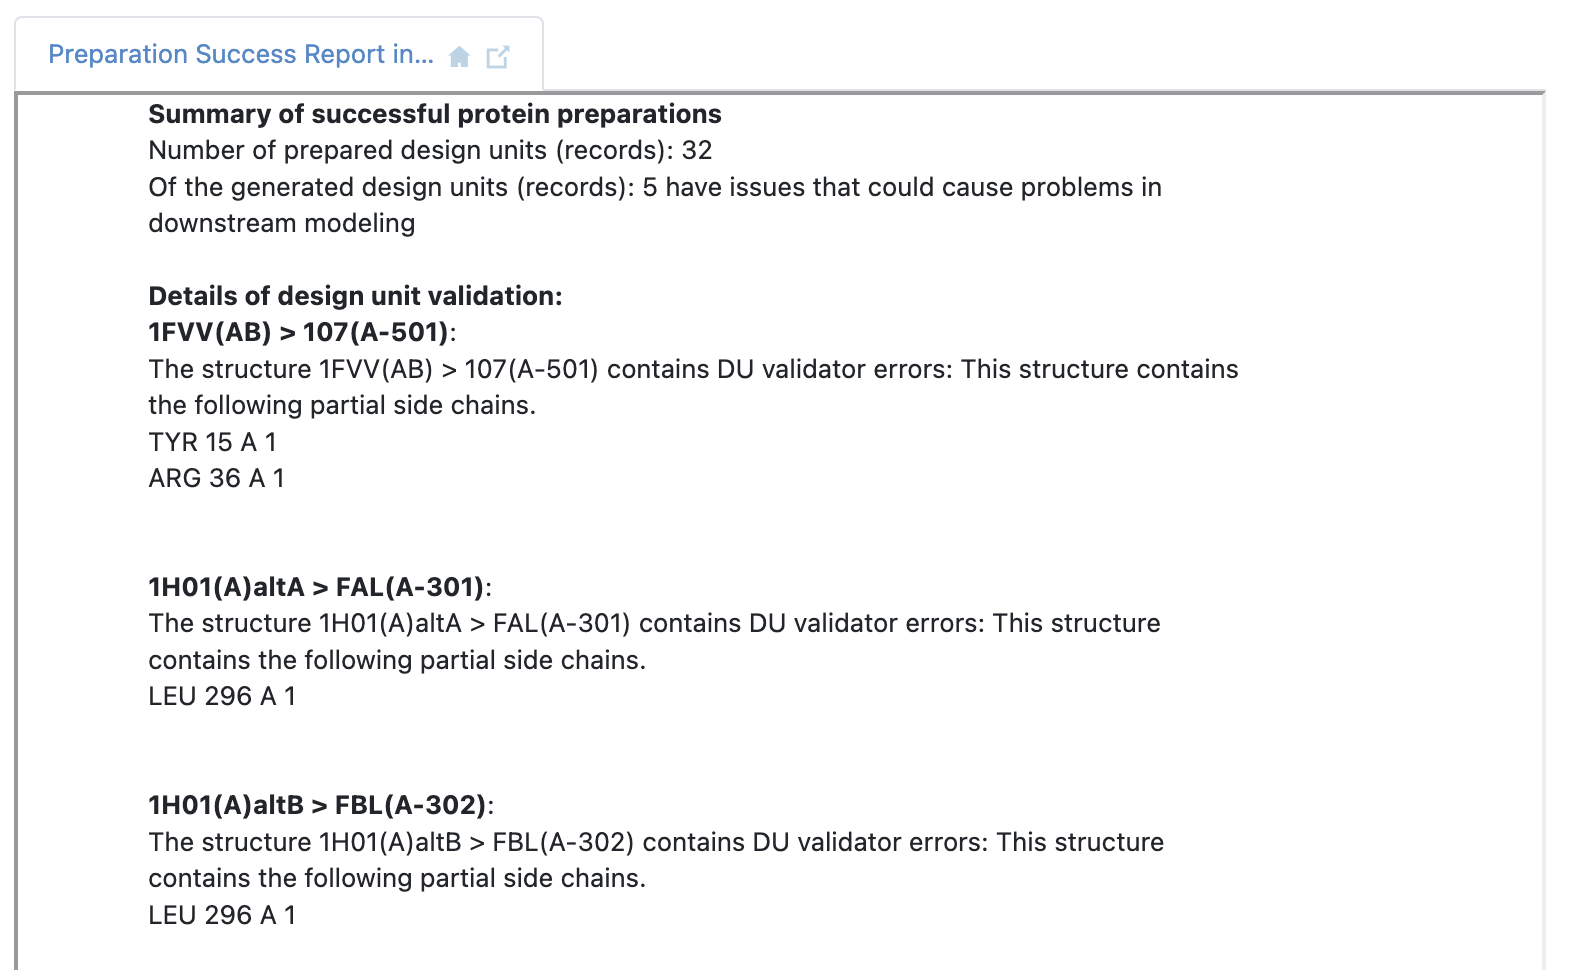
Floe report of issues after structure preparation
Analyzing the Results
First we are going to mark both the reference DU dataset and the dataset containing the 34 prepared DUs as active.
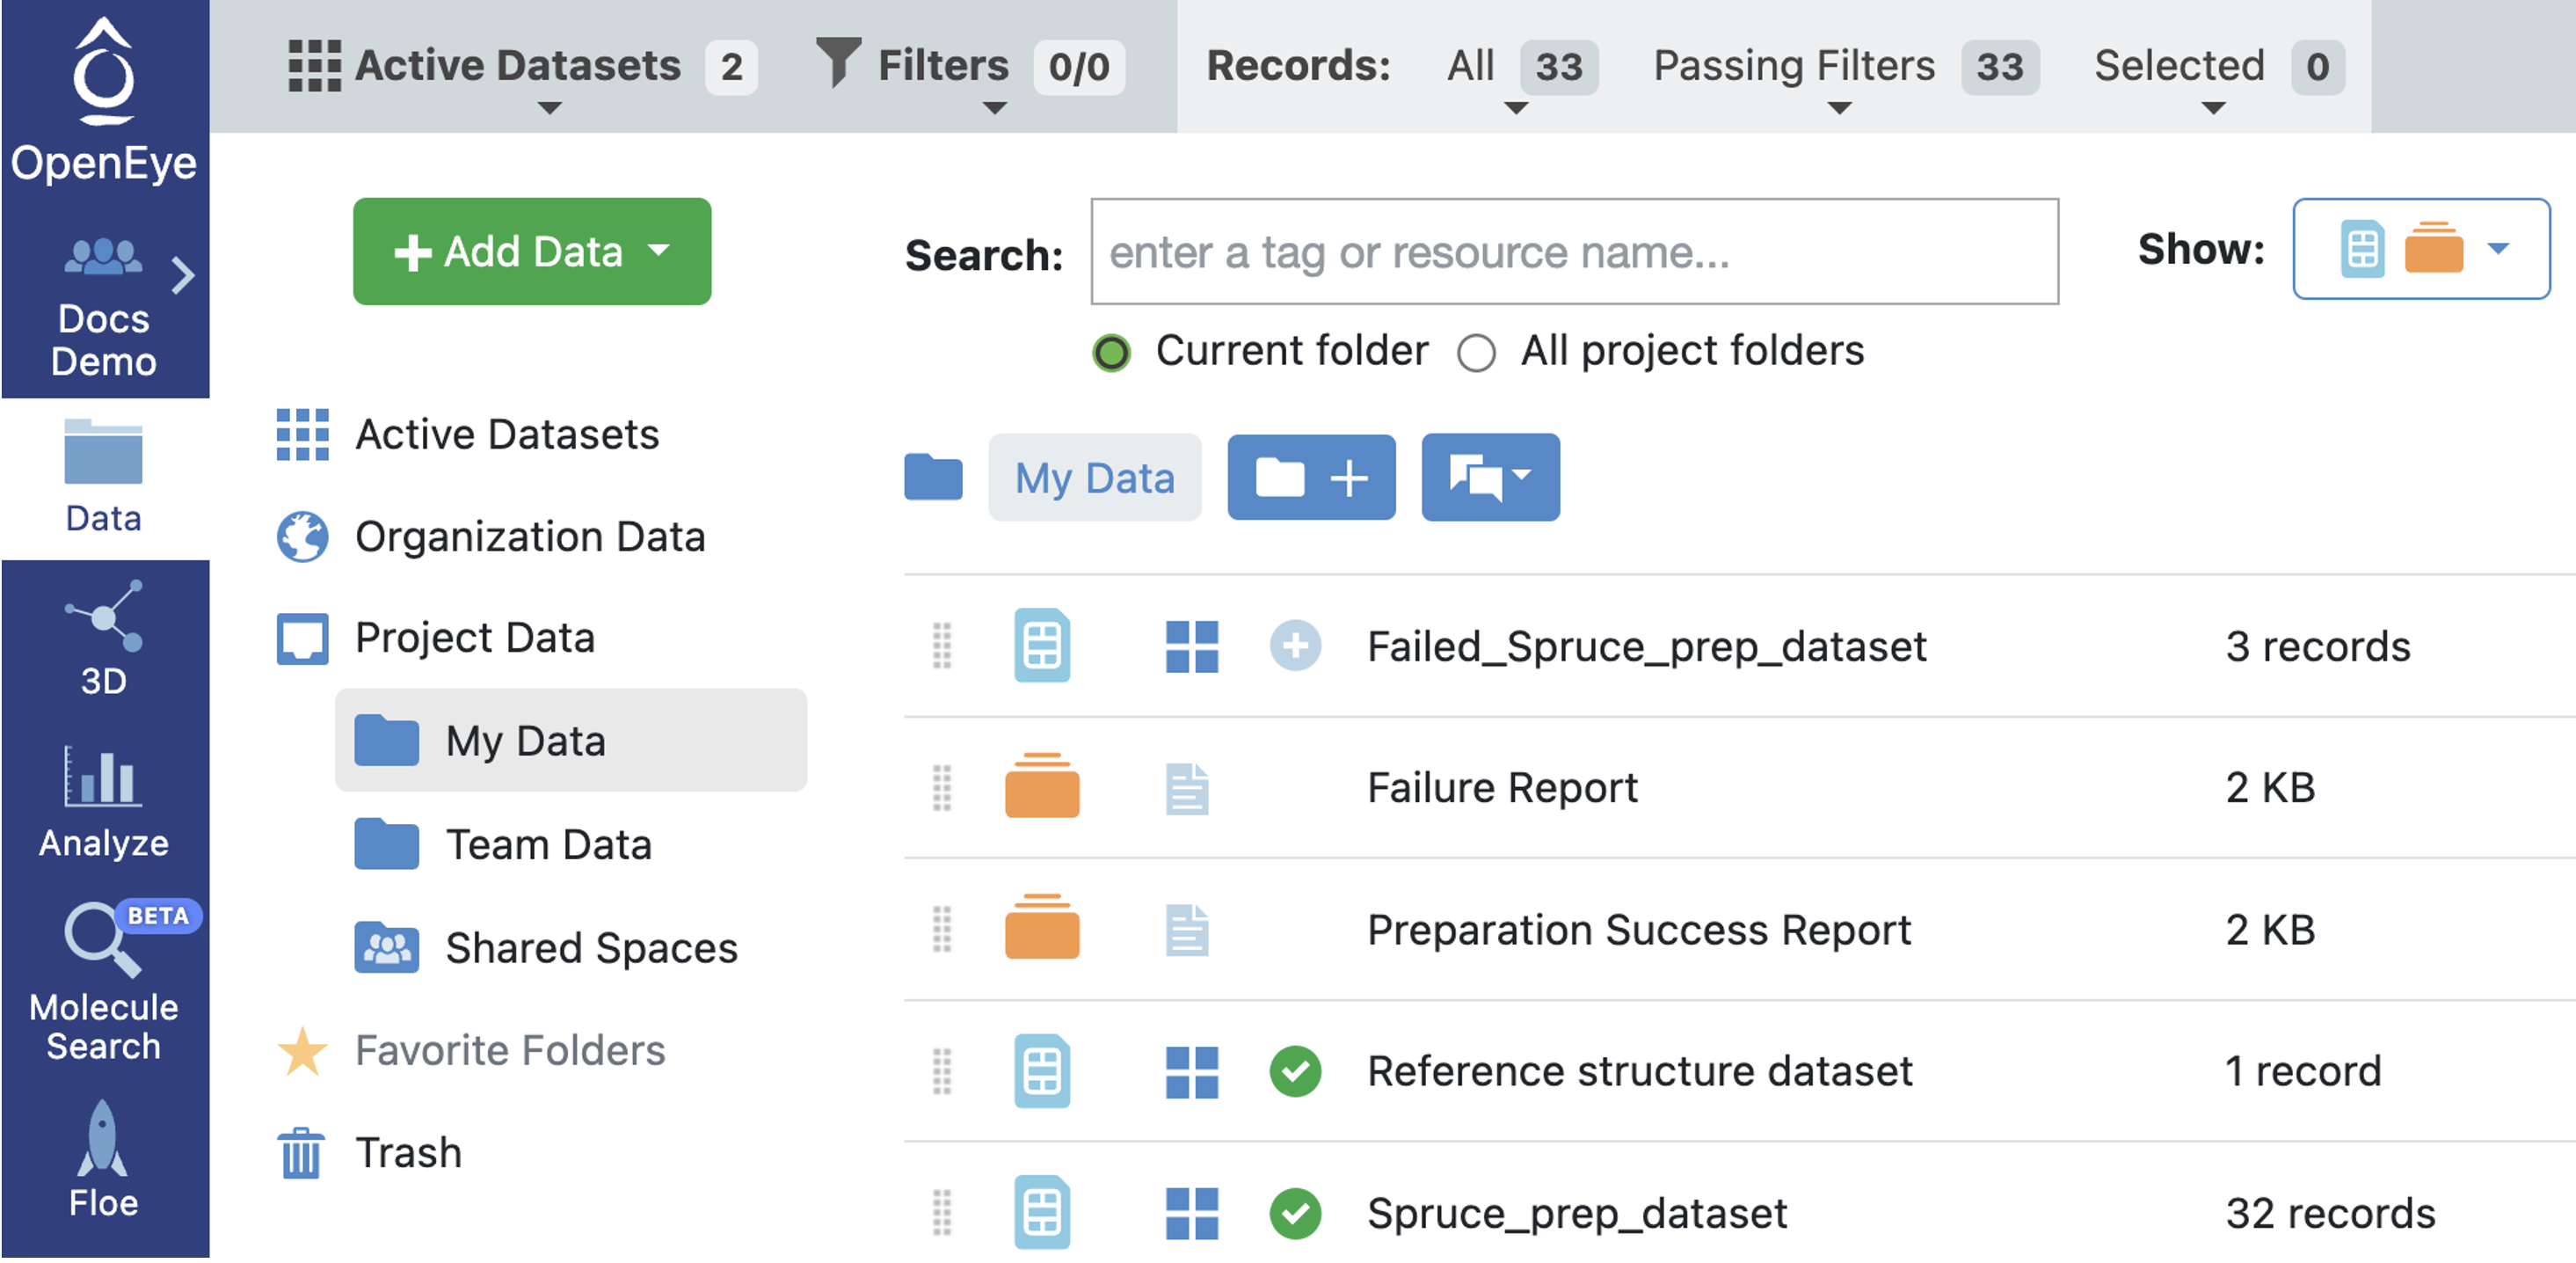
Activate datasets
When analyzing a dataset containing a larger number of records, it can be helpful to view them in the analyze page. This makes it easy to explore and filter on a property such as the Iridium Classification. In this case, we have filtered out NA (Not Applicable, no Iridium Score could be calculated) and NT (Not Trustworthy) structures. Furthermore, the remaining structures have been sorted on the classification. This filtering can also be done in the 3D viewer, however, here we use the analyze page because we can also sort the records based on the Iridium classification and we can inspect the various depiction images, giving us a high level overview of the dataset before switching to the 3D view.
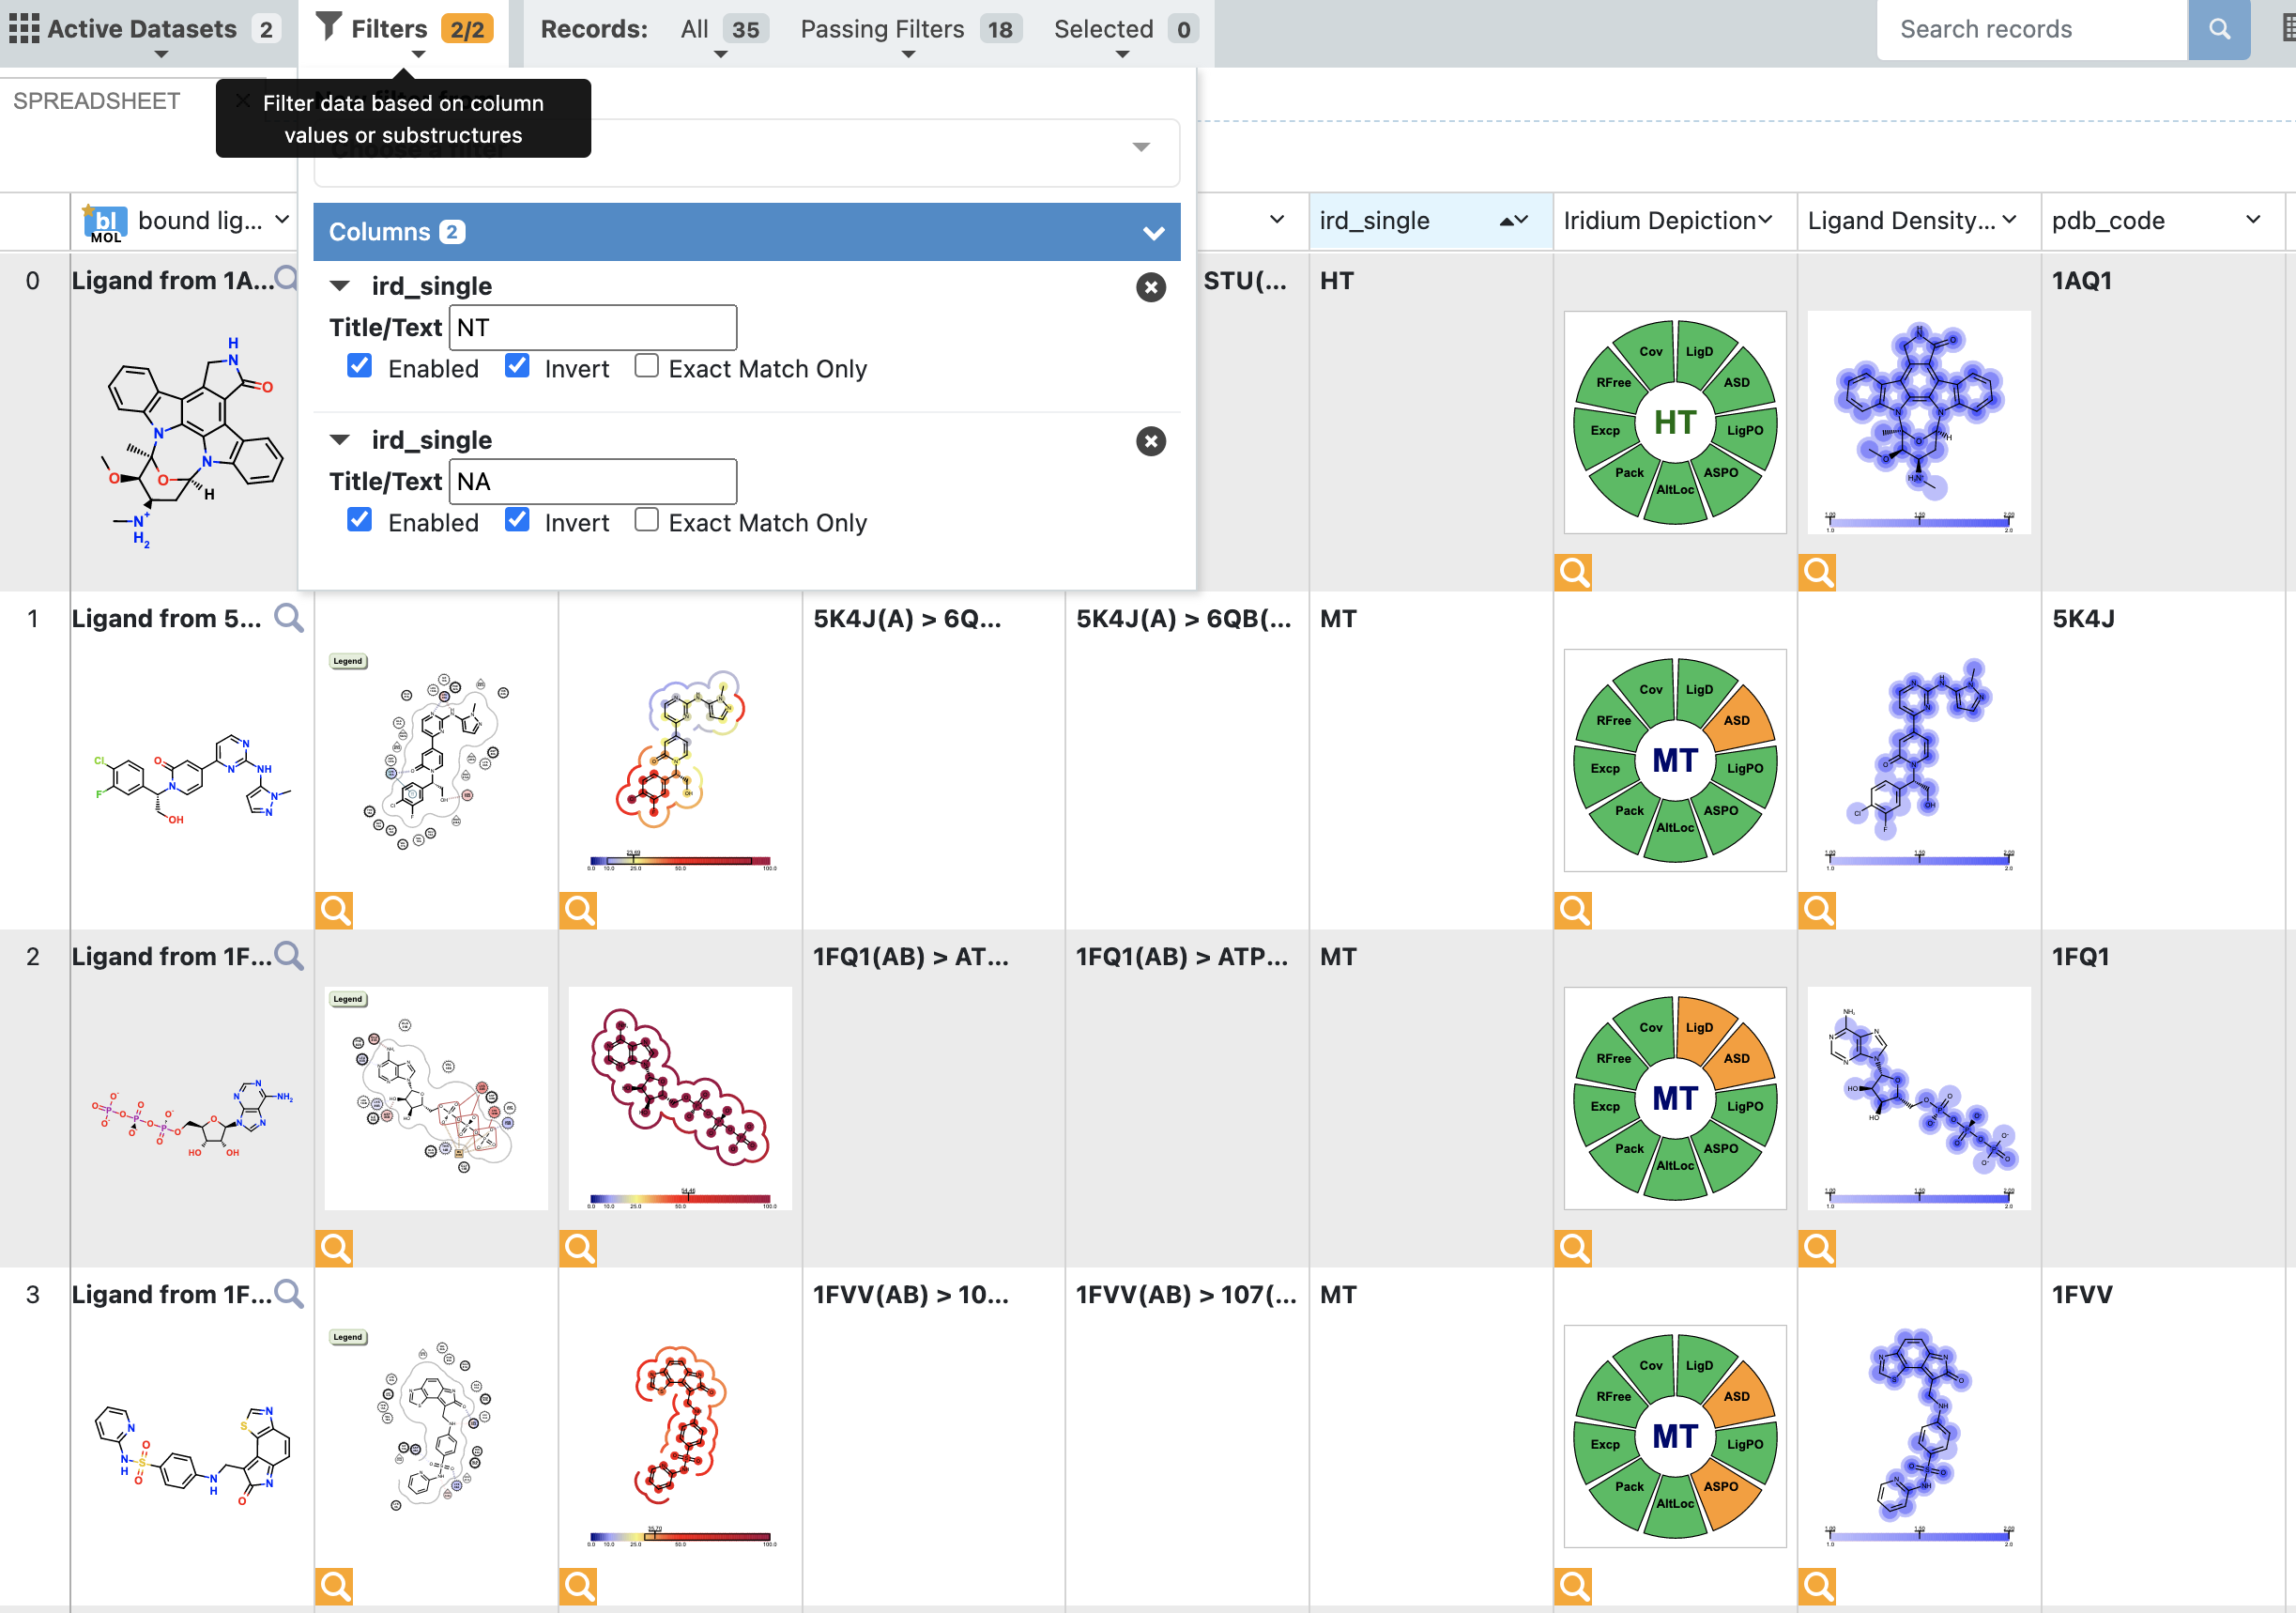
Filter dataset
Once filtering has been applied, the relevant structures can be viewed on the 3D page. Since a reference structure was used, all the structures are superposed, allowing for easy comparison and exploration of differences in ligand binding poses or binding site conformations. In the figure below, the reference structure dataset is shown, with protein-ligand interactions indicated.
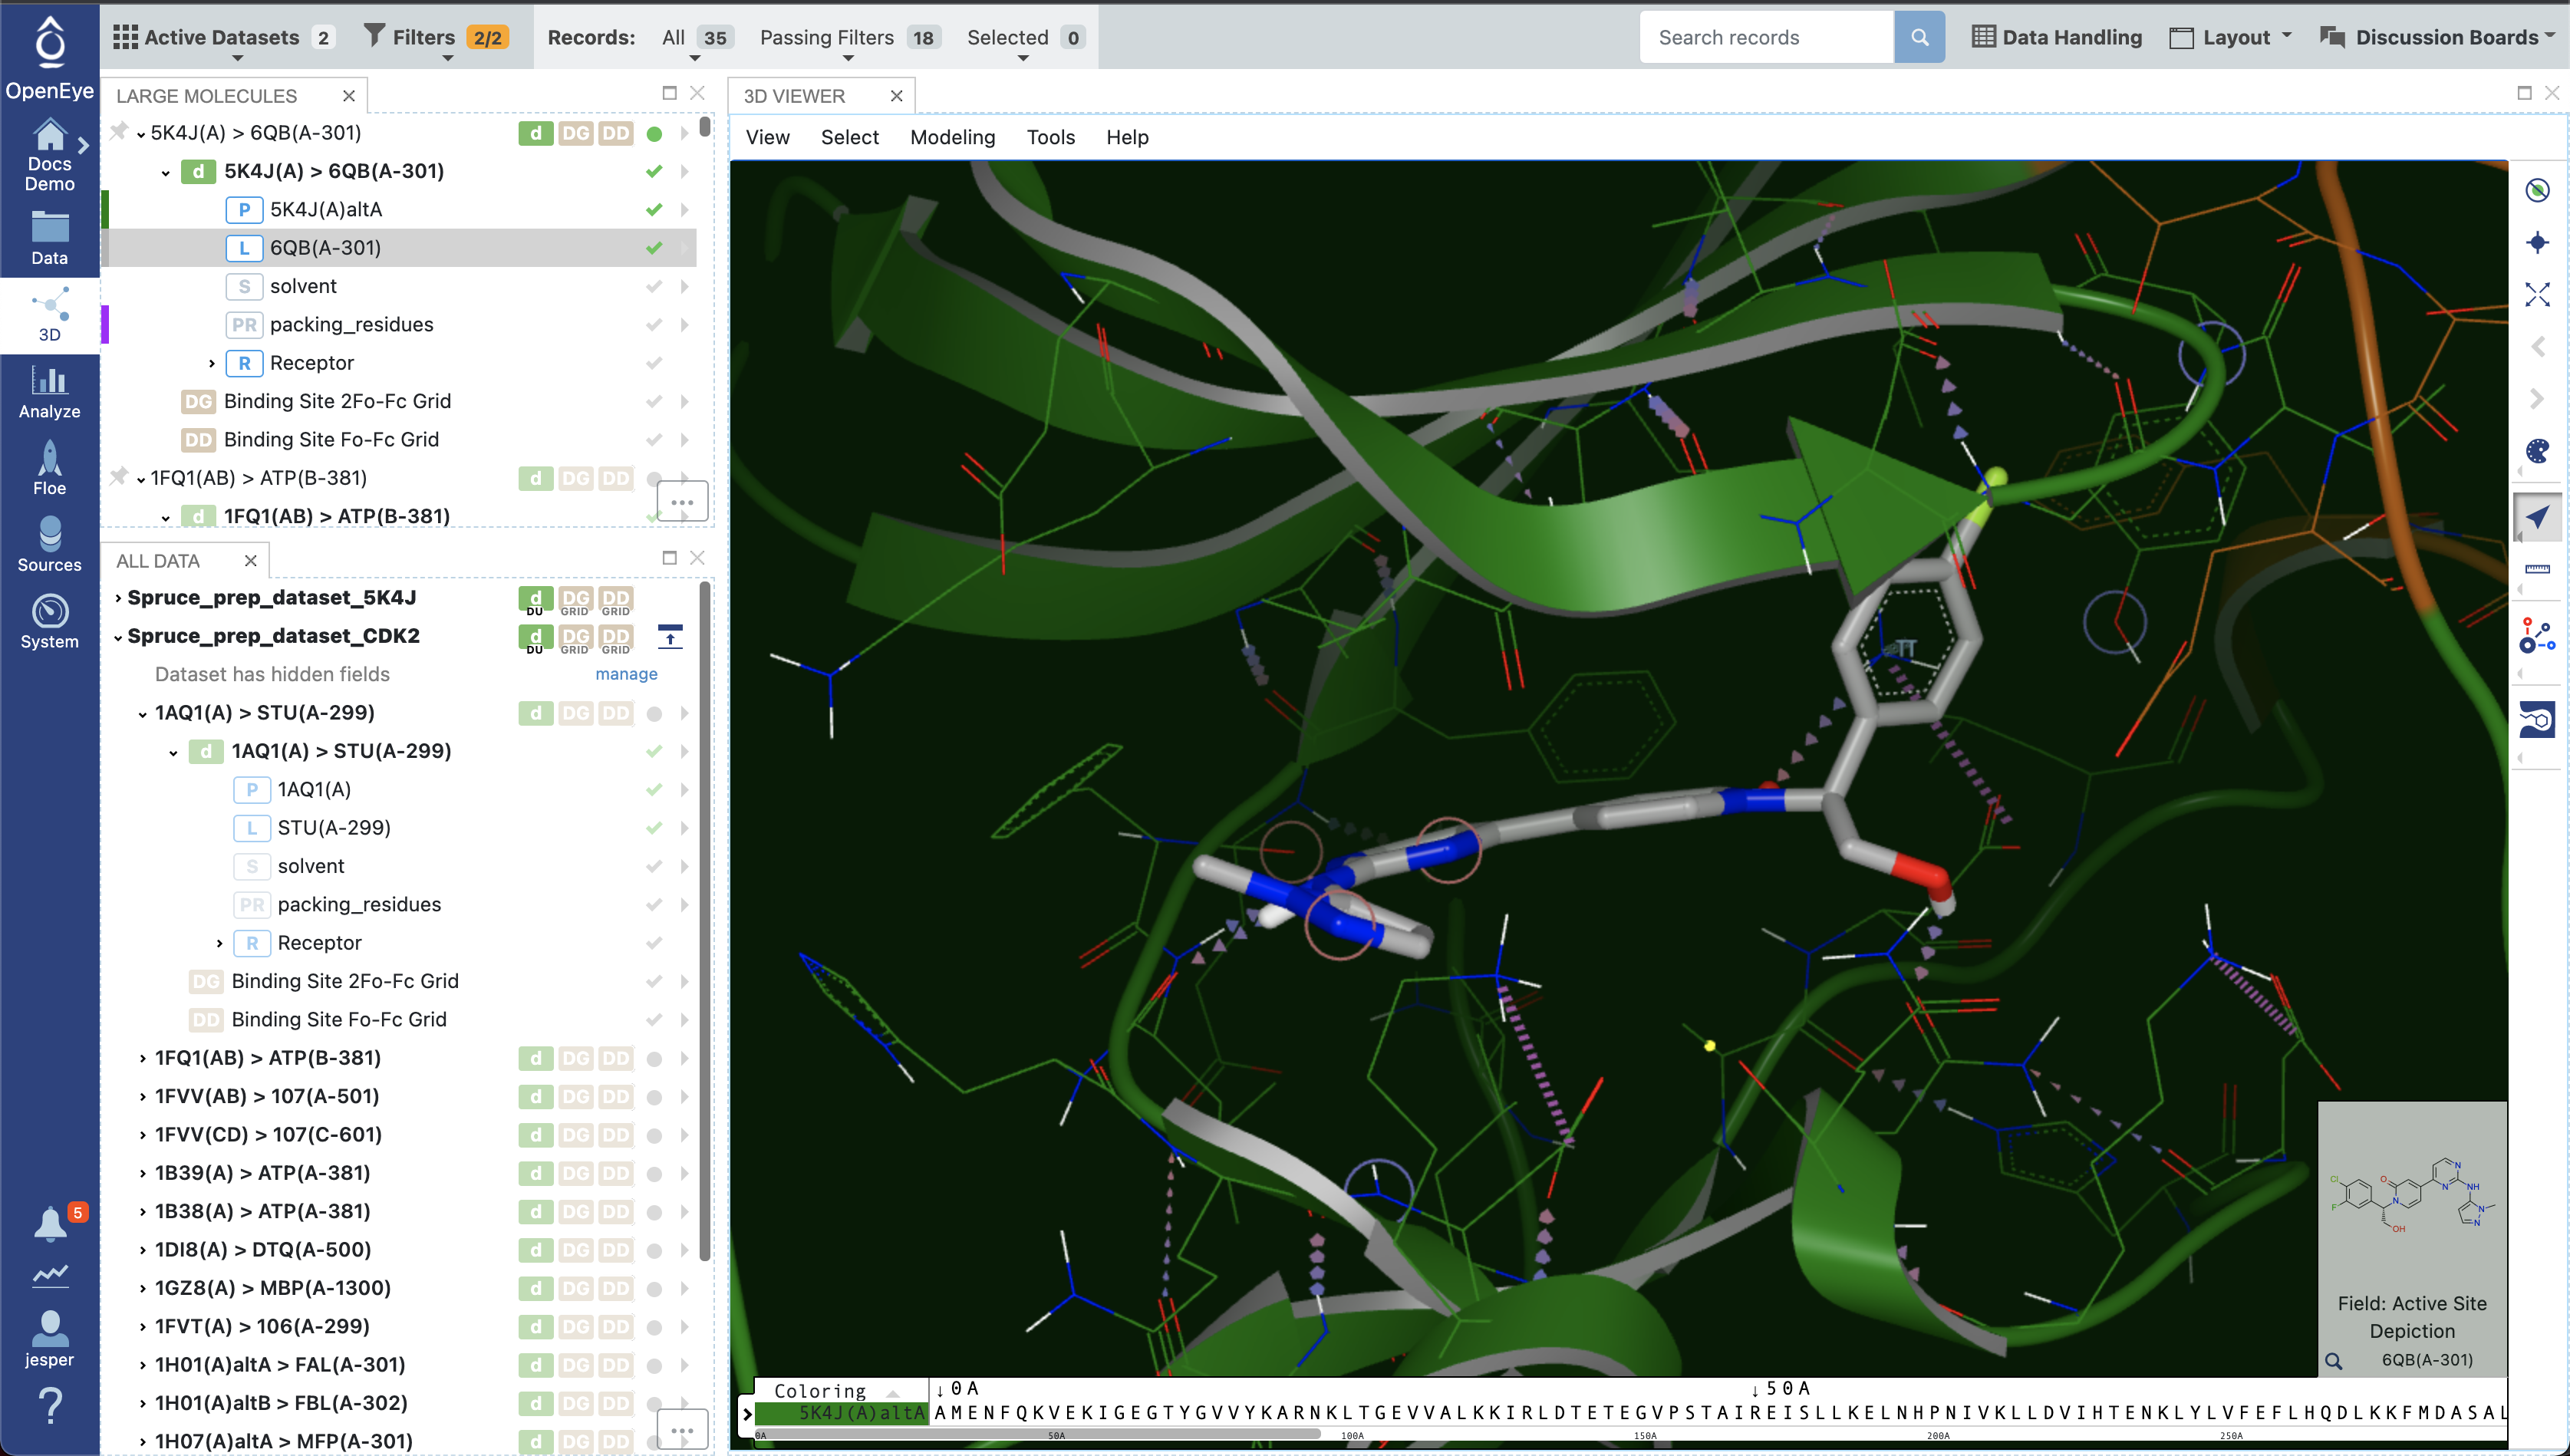
Design Unit in 3D viewer
Data stored on the DU record makes it possible to inspect the experimental electron density maps with just a few mouse clicks.
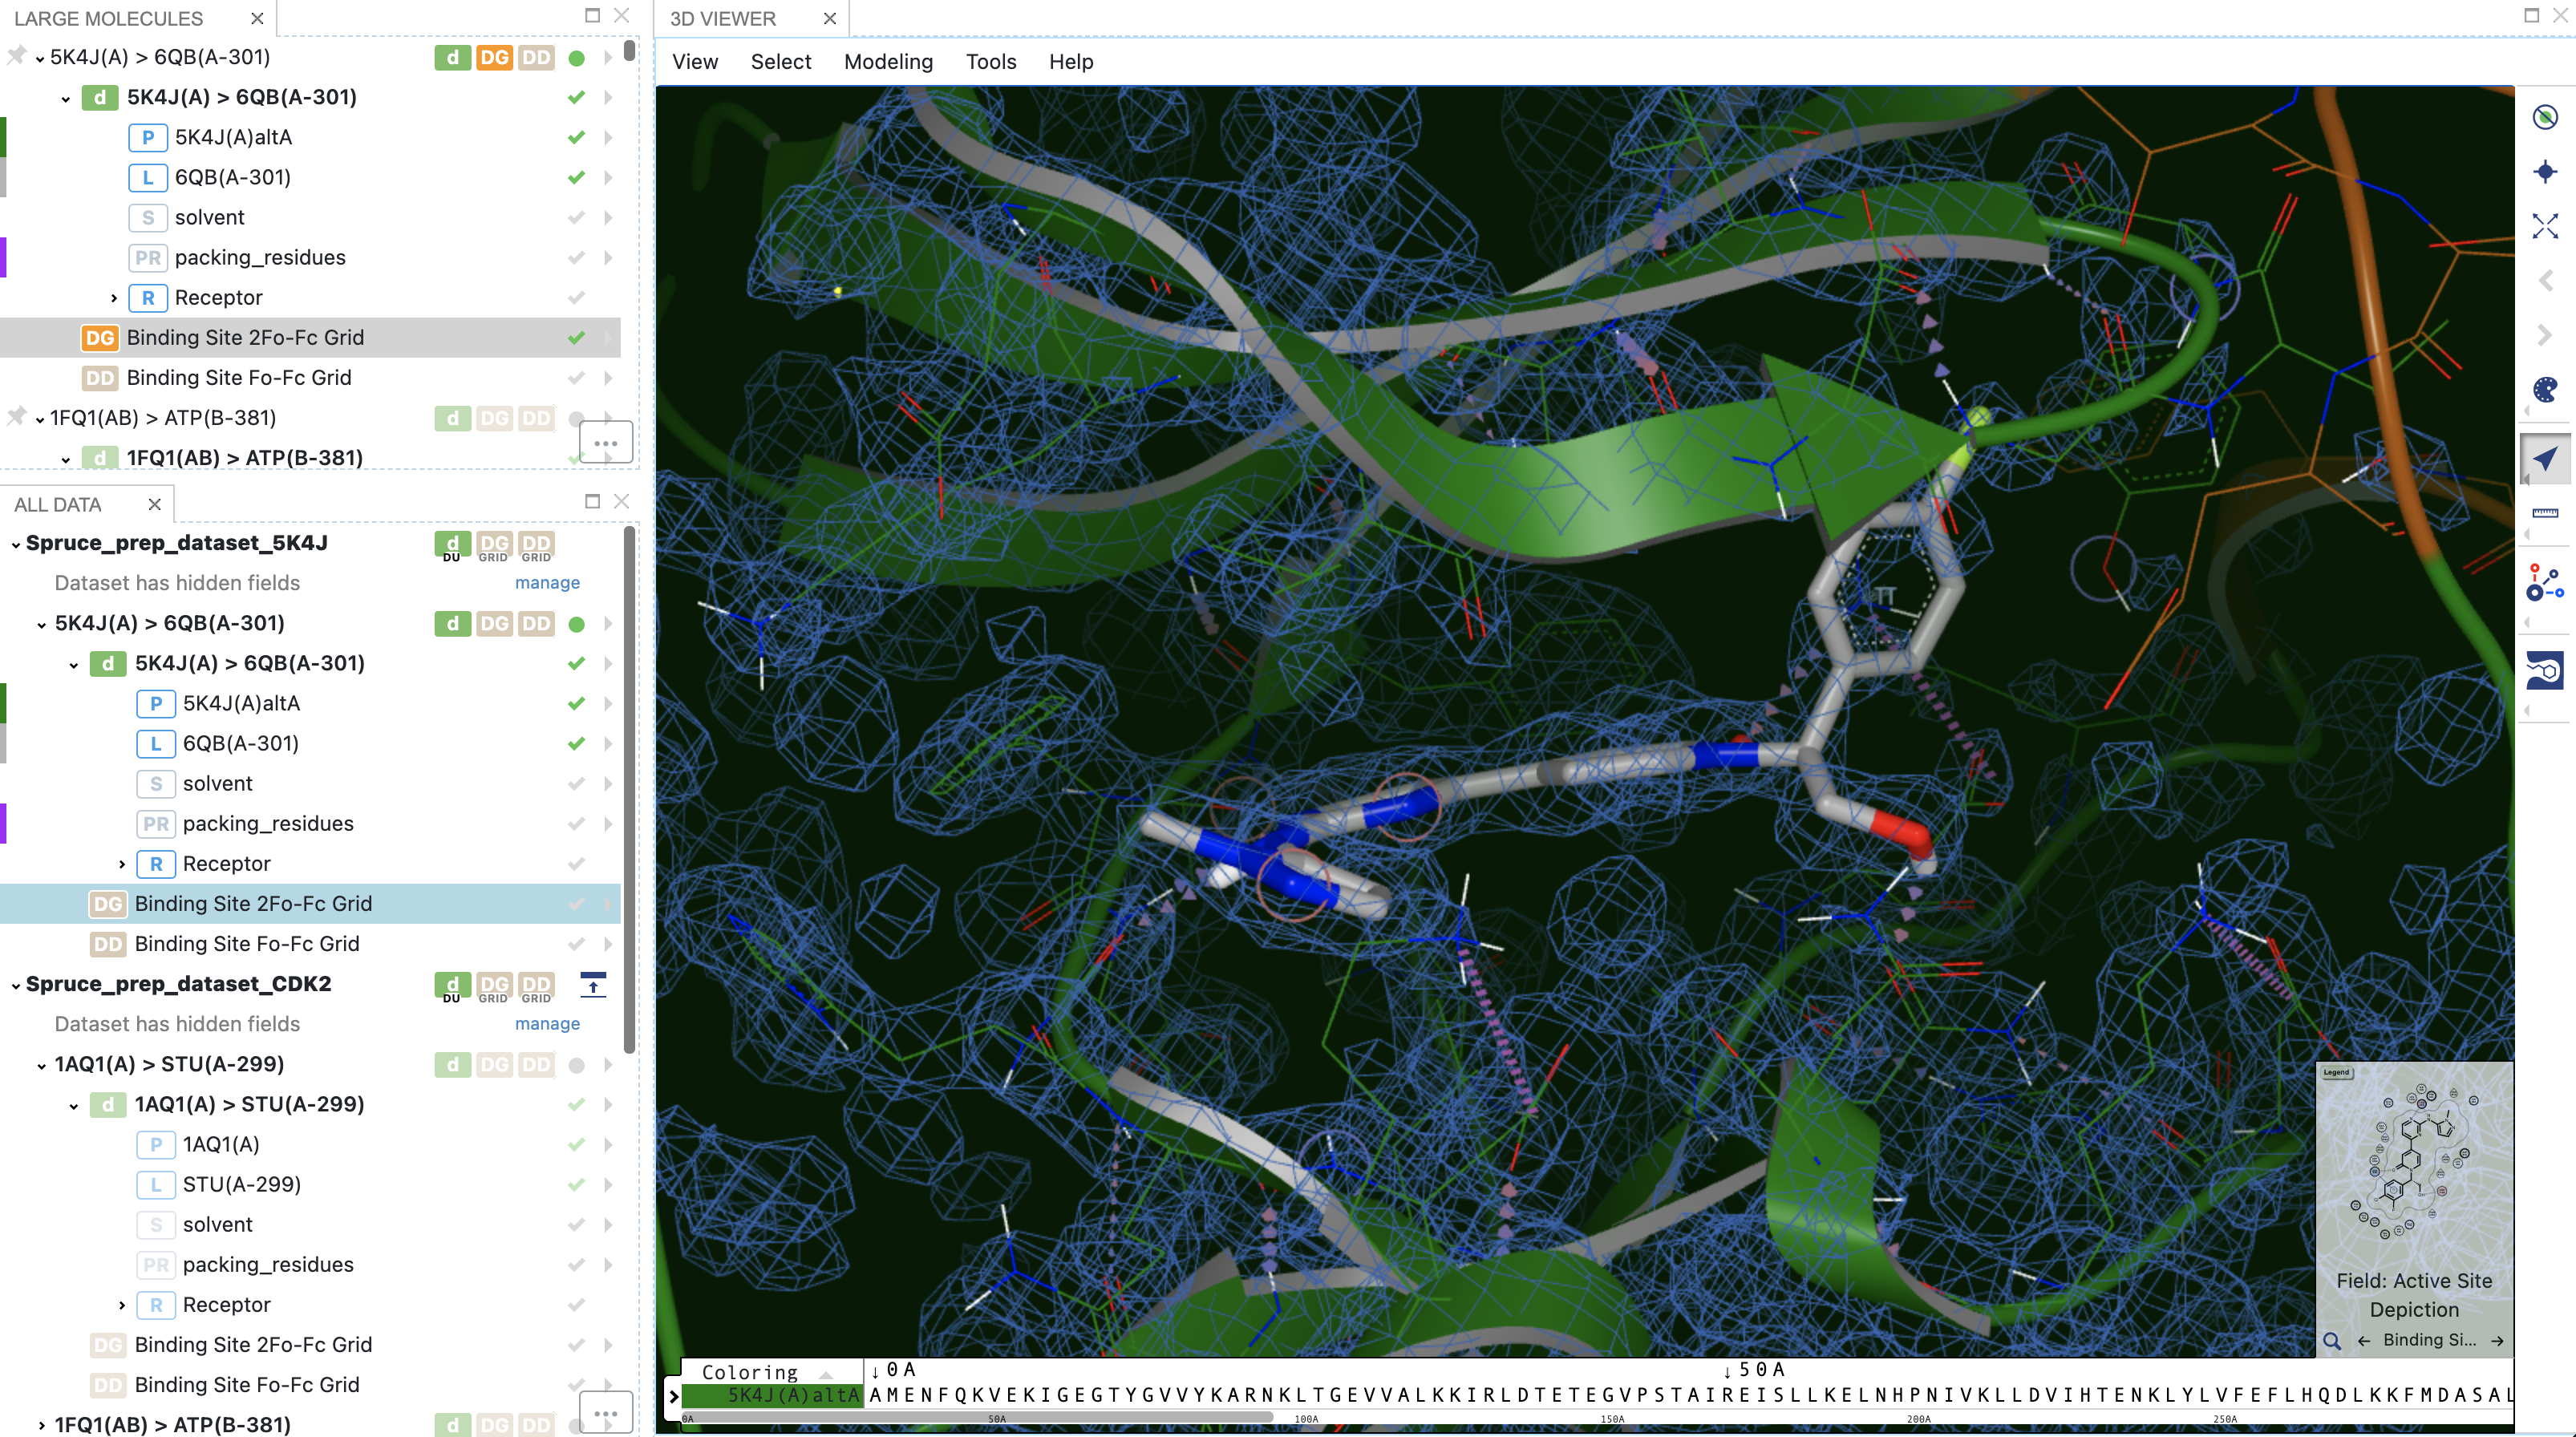
2Fo-Fc electron density grids shown with the structure
Multiple structures may be displayed at the same time, using different color schemes for the bounds ligands. Inspecting differences in binding poses, particularly specific binding interactions such as hydrogen bonds, salt-bridges, and pi-type interactions, can be helpful in explaining experimental data, for example differences in activities, or differences in specificity of a compound between different targets.
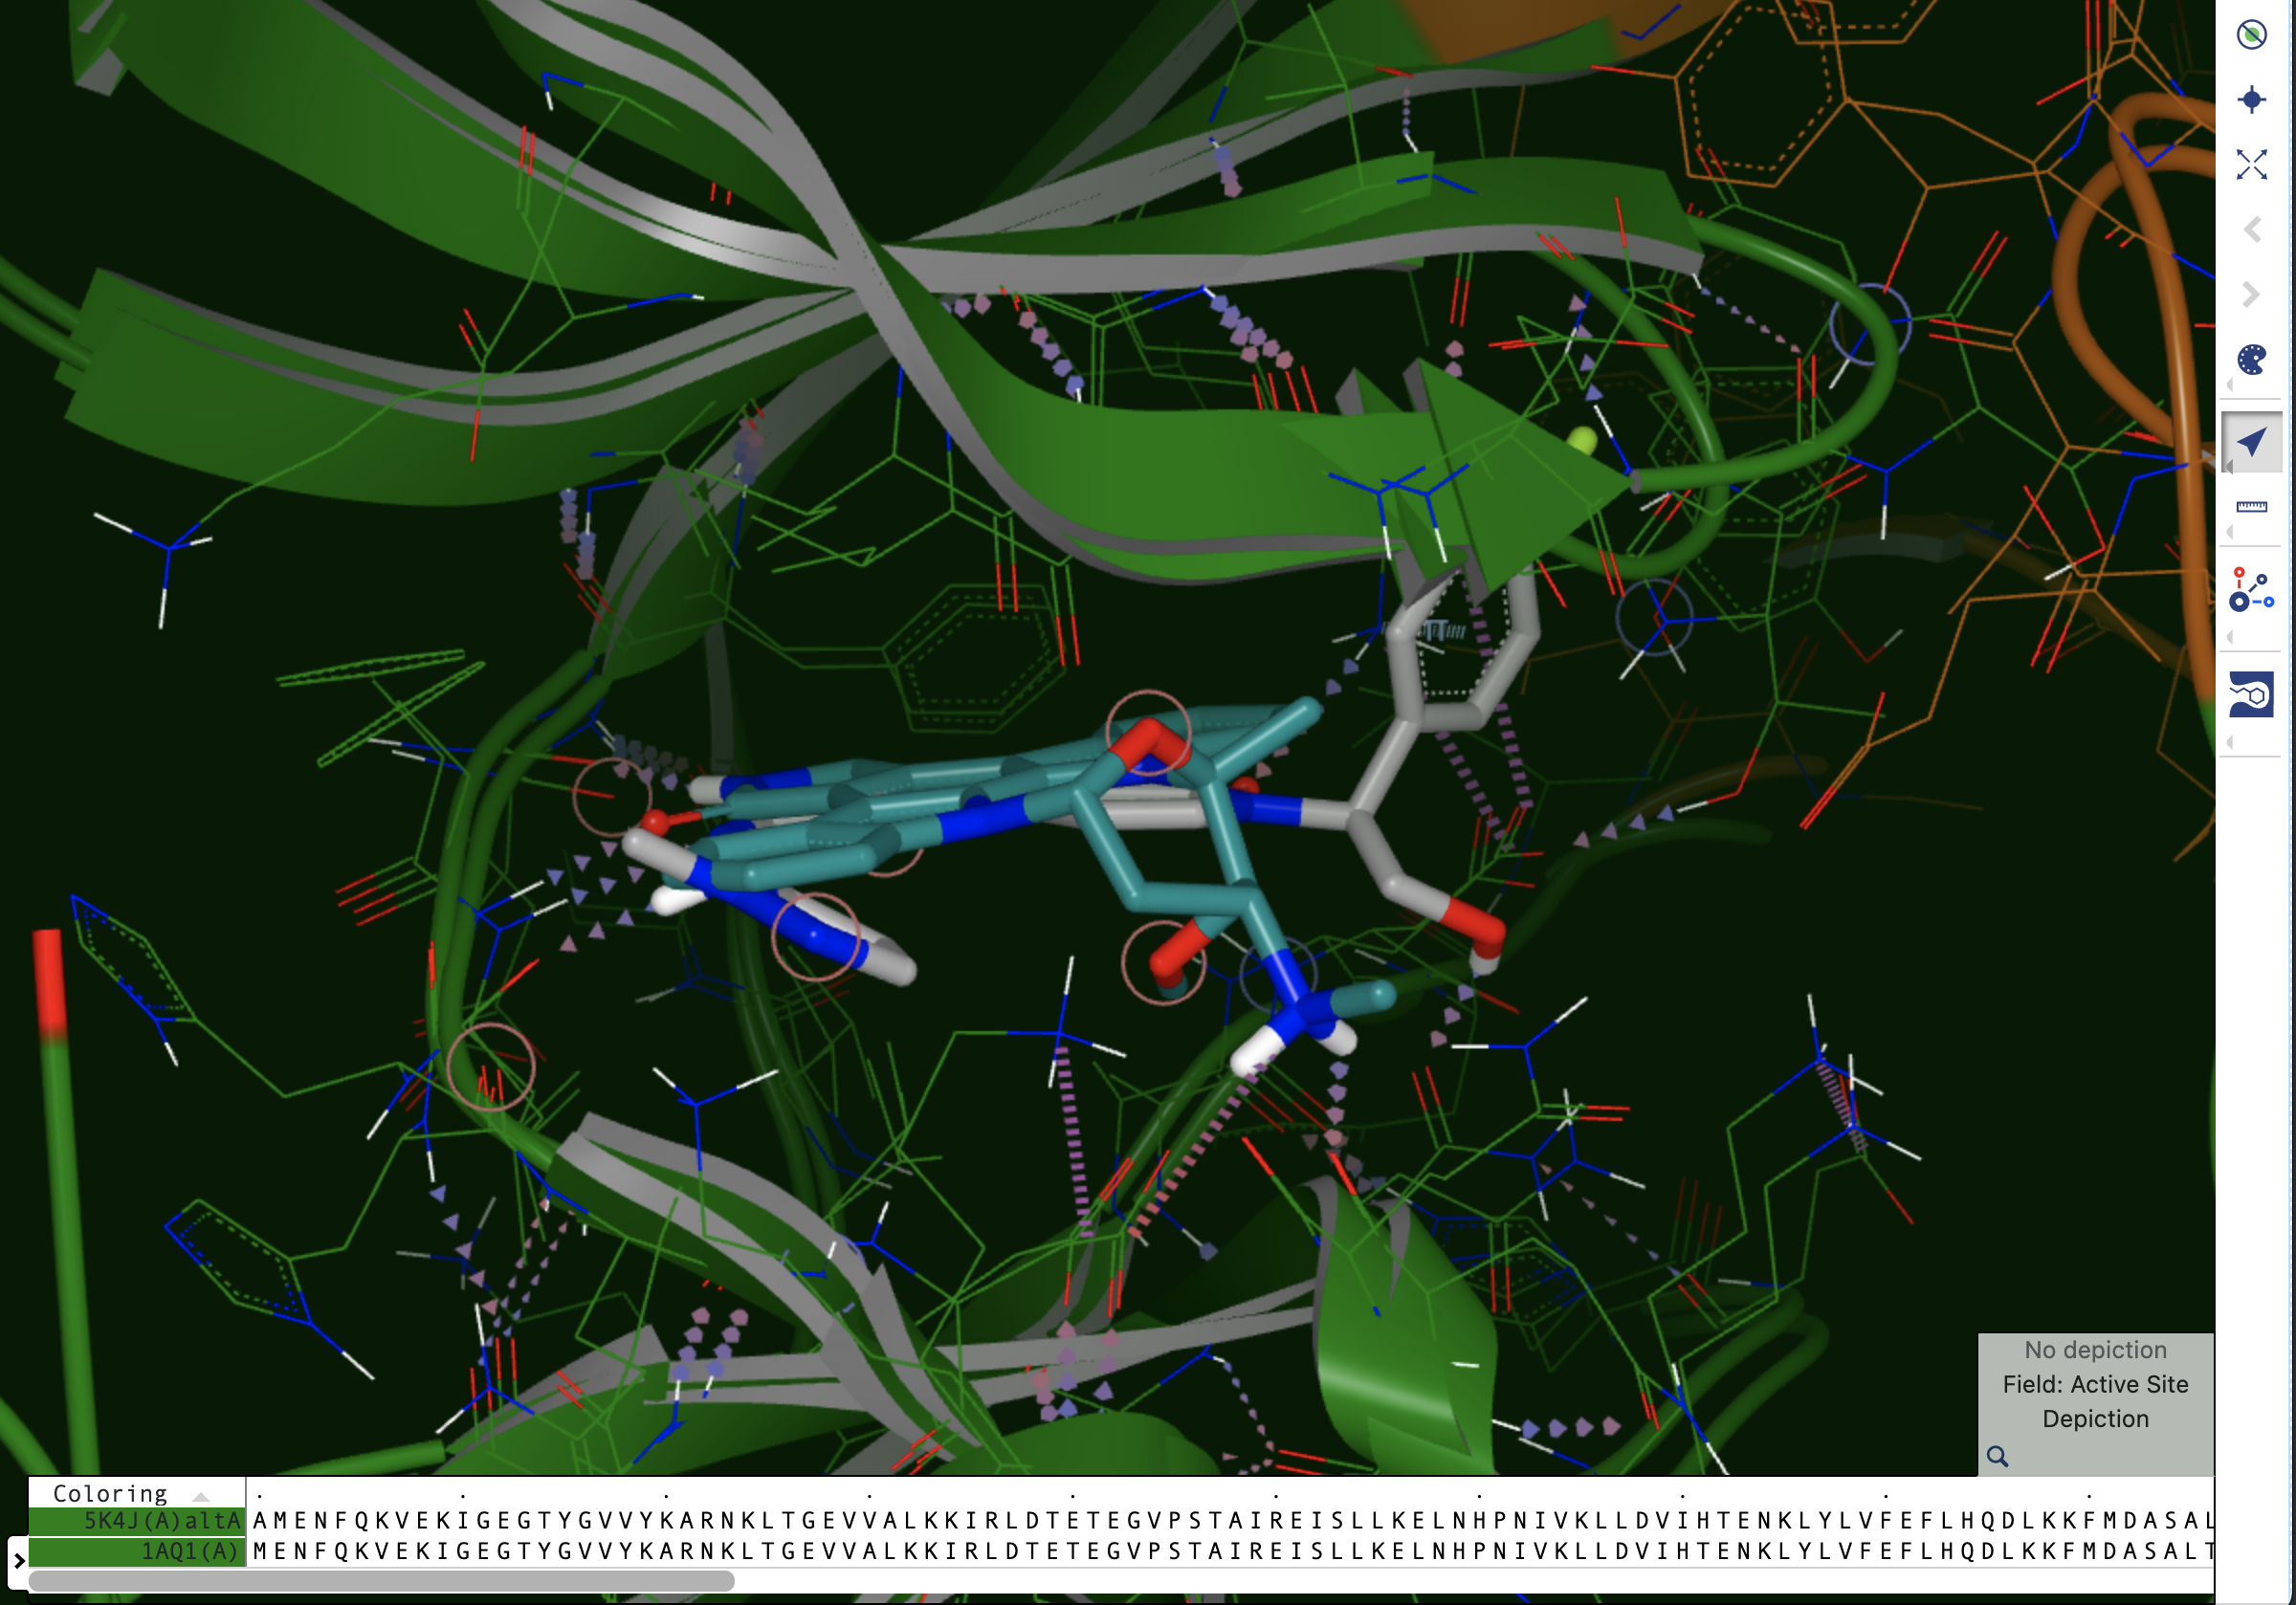
Design units in a dataset with a reference DU are superposed. One of the bound ligands is shown with a different color scheme.
Depending on the subsequent modeling task, a single or multiple design units can be selected and saved as a new and curated dataset. In this case, we could save only the structures with an HT (Highly Trustworthy) Iridium classification. It is important to note that many MT structures are also relevant for use in modeling tasks. The MT classification indicates that a structure should be inspected closely prior to being used in computations, in particular the ligand binding site(s), to avoid unexpected results.
Calculation of the Iridium Classification requires electron density maps to be supplied in MTZ format. If these maps are not available, the Iridium classification cannot be calculated, and Classification is NA. Furthermore, Iridium cannot be calculated for apo structures, which are also marked NA.
Next Steps
Design Units prepared by Spruce can be used for a variety of modeling tasks. One integral part of the DU preparation process is the generation of a receptor binding site (docking grid), which allows the DU to be used for ligand docking or posing tasks.