Gaussian QM Conformer Ensemble Tutorial
Running this floe with the input molecule and parameters specified in this tutorial will cost around $1.50. Navigate through the categories Product-based / Quantum Mechanics / Gaussian to find this floe. Then locate or search for the Gaussian QM Conformer Ensemble.
This floe generates conformers, performs a geometry optimization, and calculates a single-point energy. If the input molecule has coordinates, that conformer will be compared to the generated conformers.
The input for this floe (hydroxymethyl-benzoic-acid) can be found in the QM Gaussian Floes folder of the Tutorial Data on Orion.
Set the RMSD Threshold for Conformer Generation to 0.25 to make generate more conformers for this small molecule. All other parameters will be left to the default. This means the conformers will be optimized at HF/6-31G with torsions around rotatable bonds constrained. For these constrained optimizations, a lower level of theory is sufficient. Next, the energy will be re-evaluated at B3LYP-GD3BJ/6-31G*. Finally, the conformers will be filtered based on the specified energy window (10 kcal/mol by default).
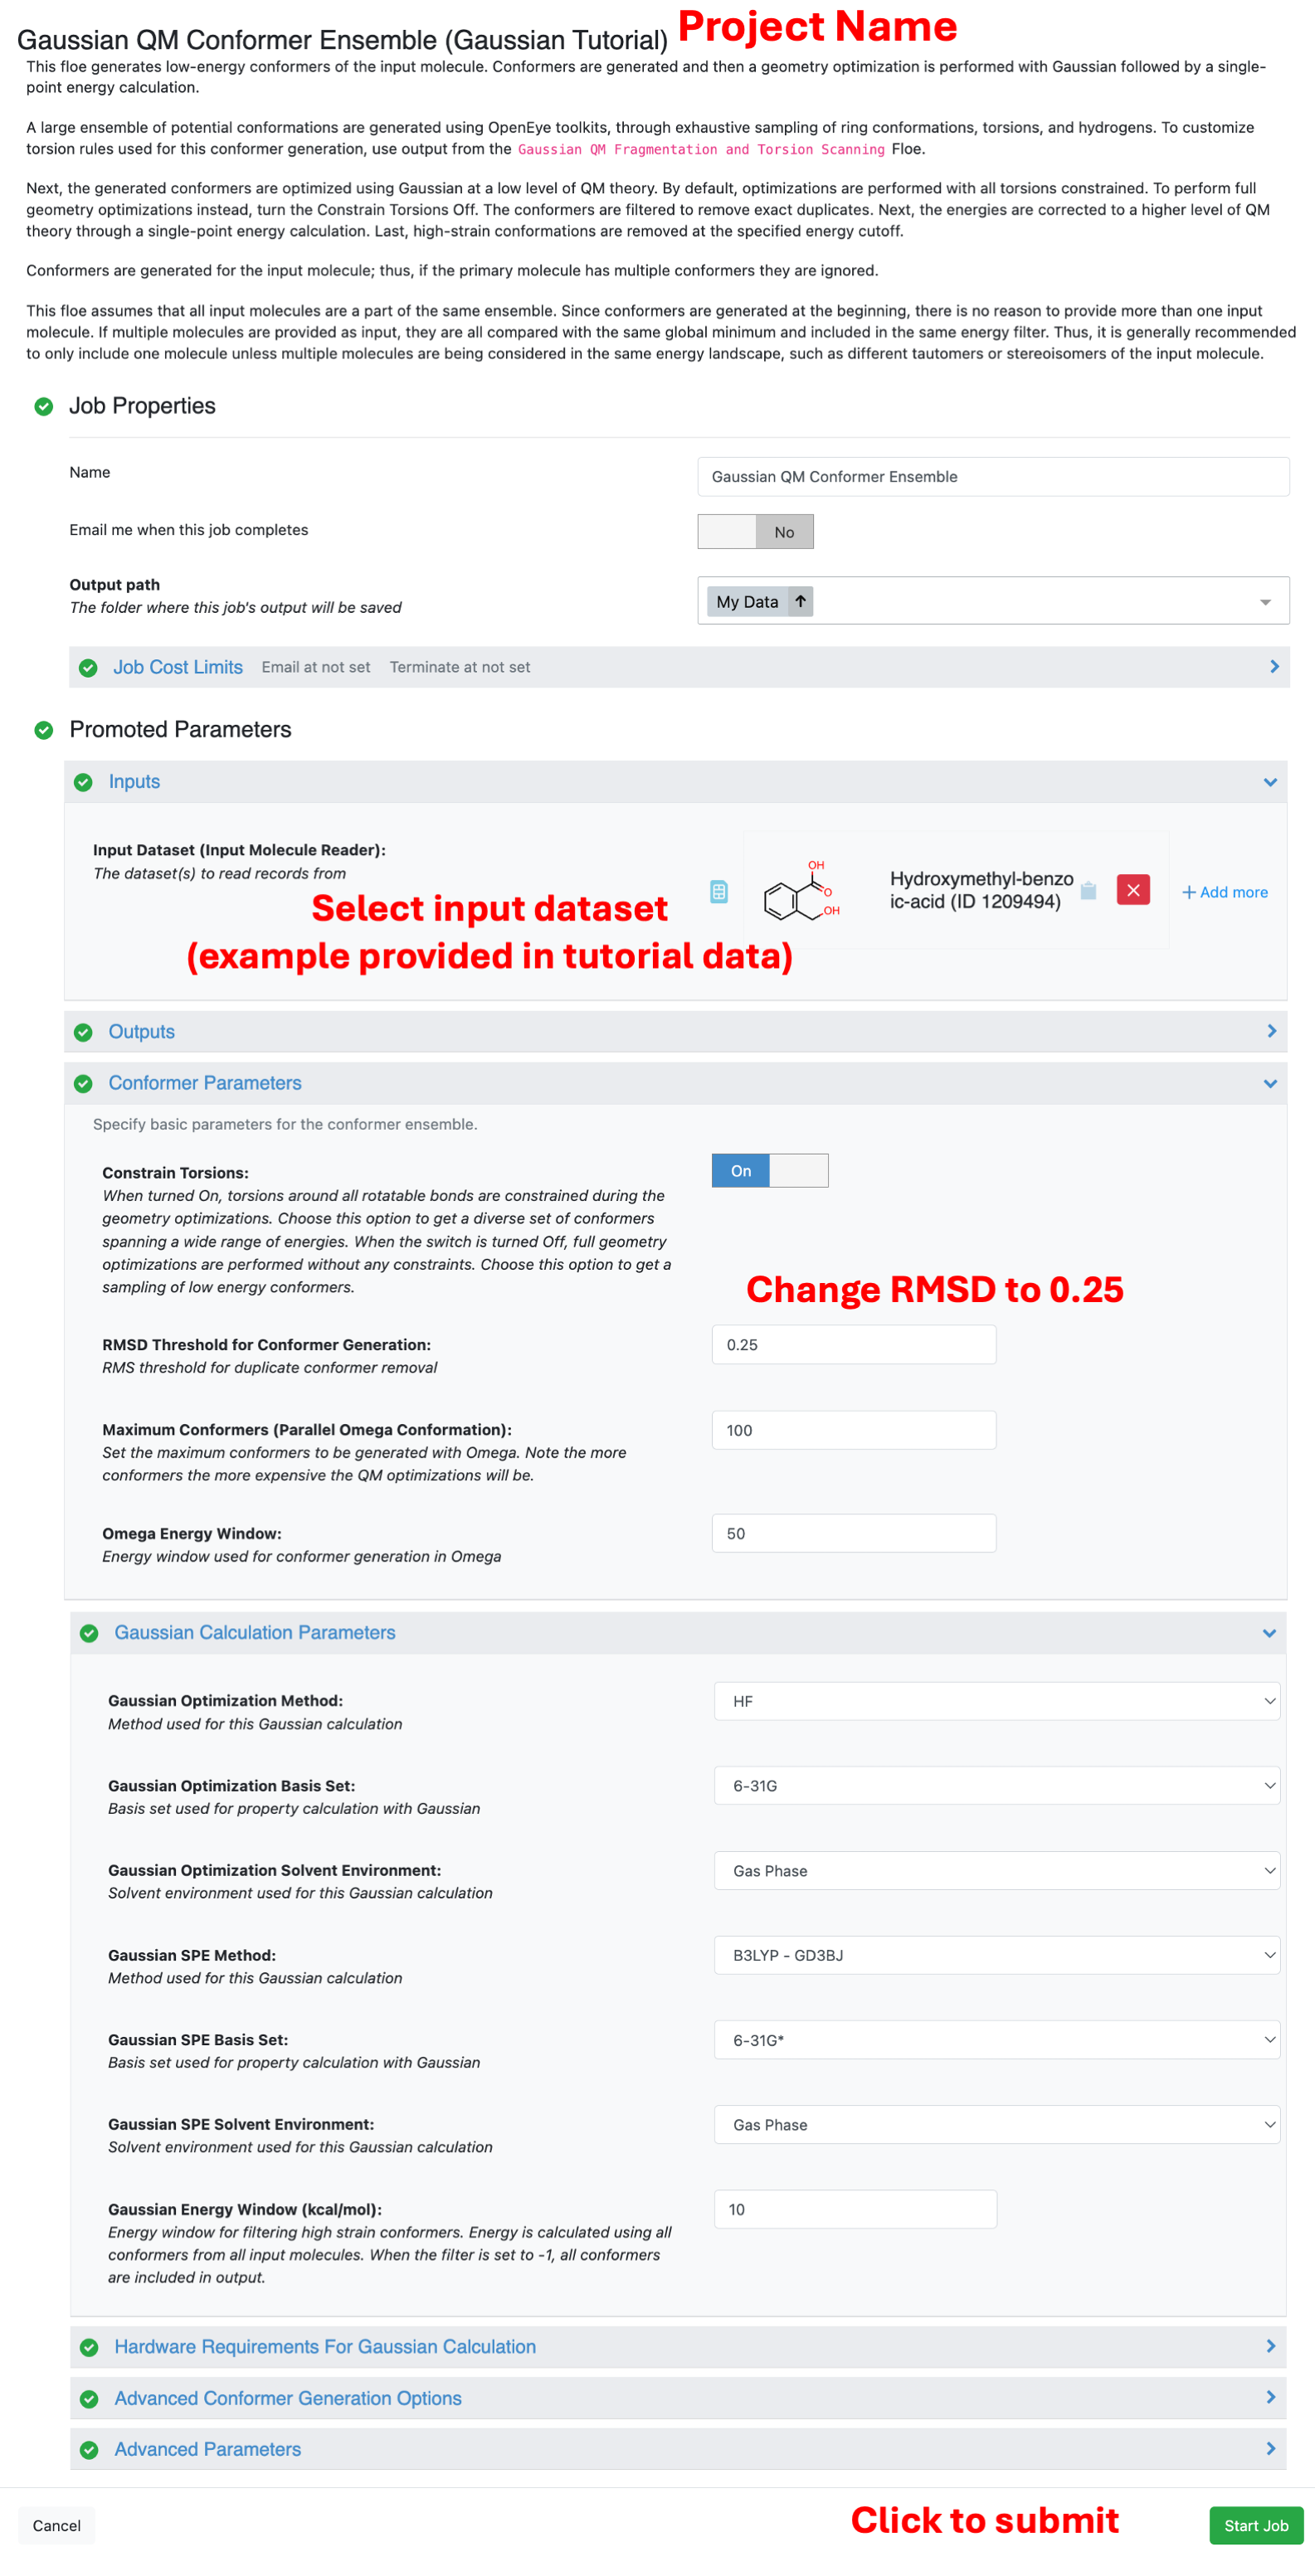
Changing the RMSD Threshold will significantly affect the number of conformers generated (and therefore the number of QM calculations to be performed). The parameter for maximum conformers limits the number of conforemrs generated. By default, 100 conformers is the maximum. For more flexible molecules this parameter may need to be increased to sufficiently sample the space.
Navigate to the Jobs tab and select the “Gaussian QM Conformer Ensemble” job. When the floe is complete, this should take you to a page like the one below:
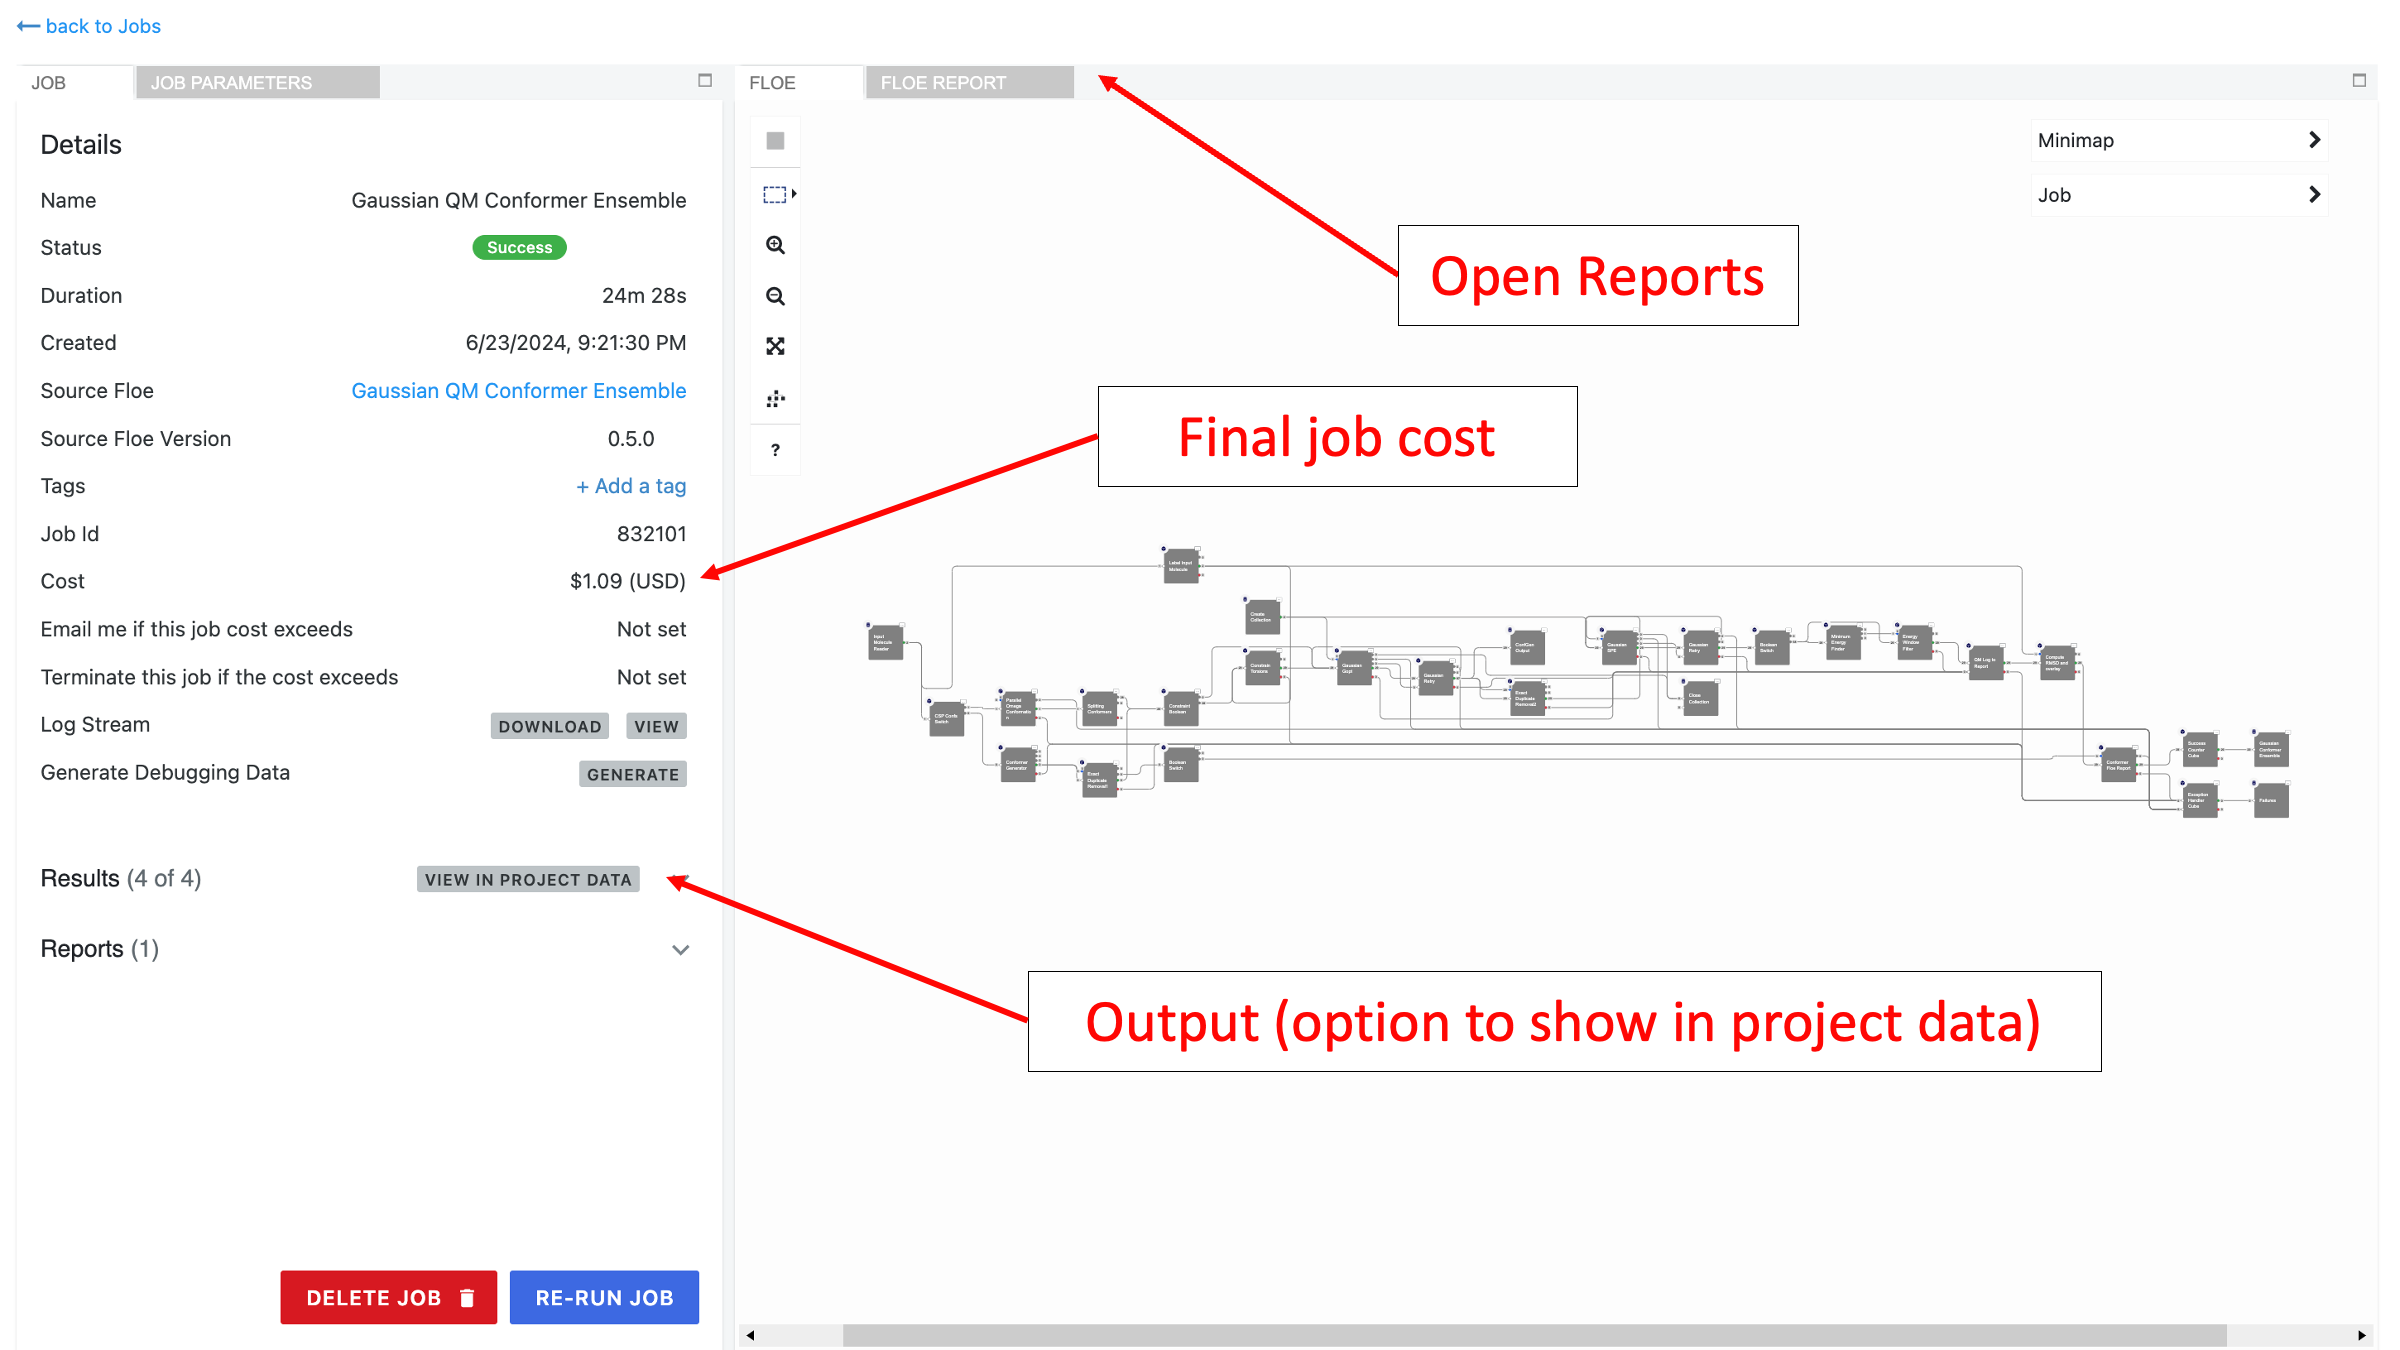
This floe generates three output datasets and two collections (floe reports):
gau_confs_gopt_spe: This is the final result and contains the conformer ensemble after energy filtering.
gau_all_conf_gopt: This is an intermediate result with all completed geometry optimization, but with no single-point energies or filtering performed.
gau_conf_ens_failures: This dataset saves any failed records.
Failure Report - Gaussian Conformer Ensemble: This floe report summarizes why a record failed (see below).
Gaussian Conformer Report: This floe report summarizes the conformer ensemble results.
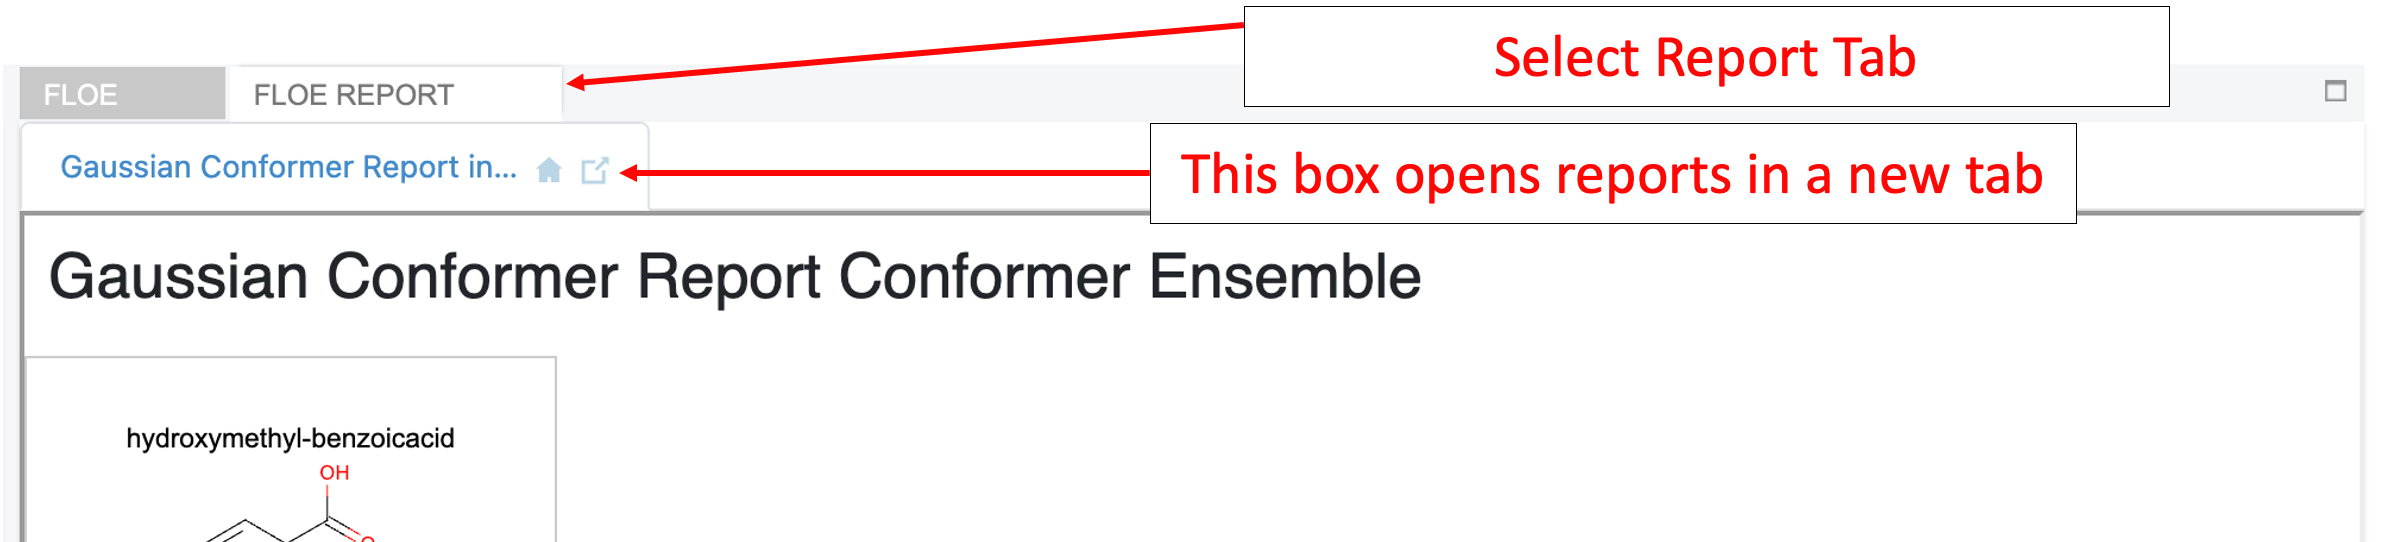
Navigate to the Floe Report tab and open the “Failure Report - Gaussian Conformer Ensemble” to see why each record failed.
There were no failures for this small molecule. However, if there are failures they will come from two main sources: (1) Conformers are deduplicated before and after optimization, and the duplicates are sent to the failures. (2) Conformers higher in energy than the specified cutoff will also be sent to the failures.
Next, navigate to the Gaussian Conformer Report to see a summary of the results.
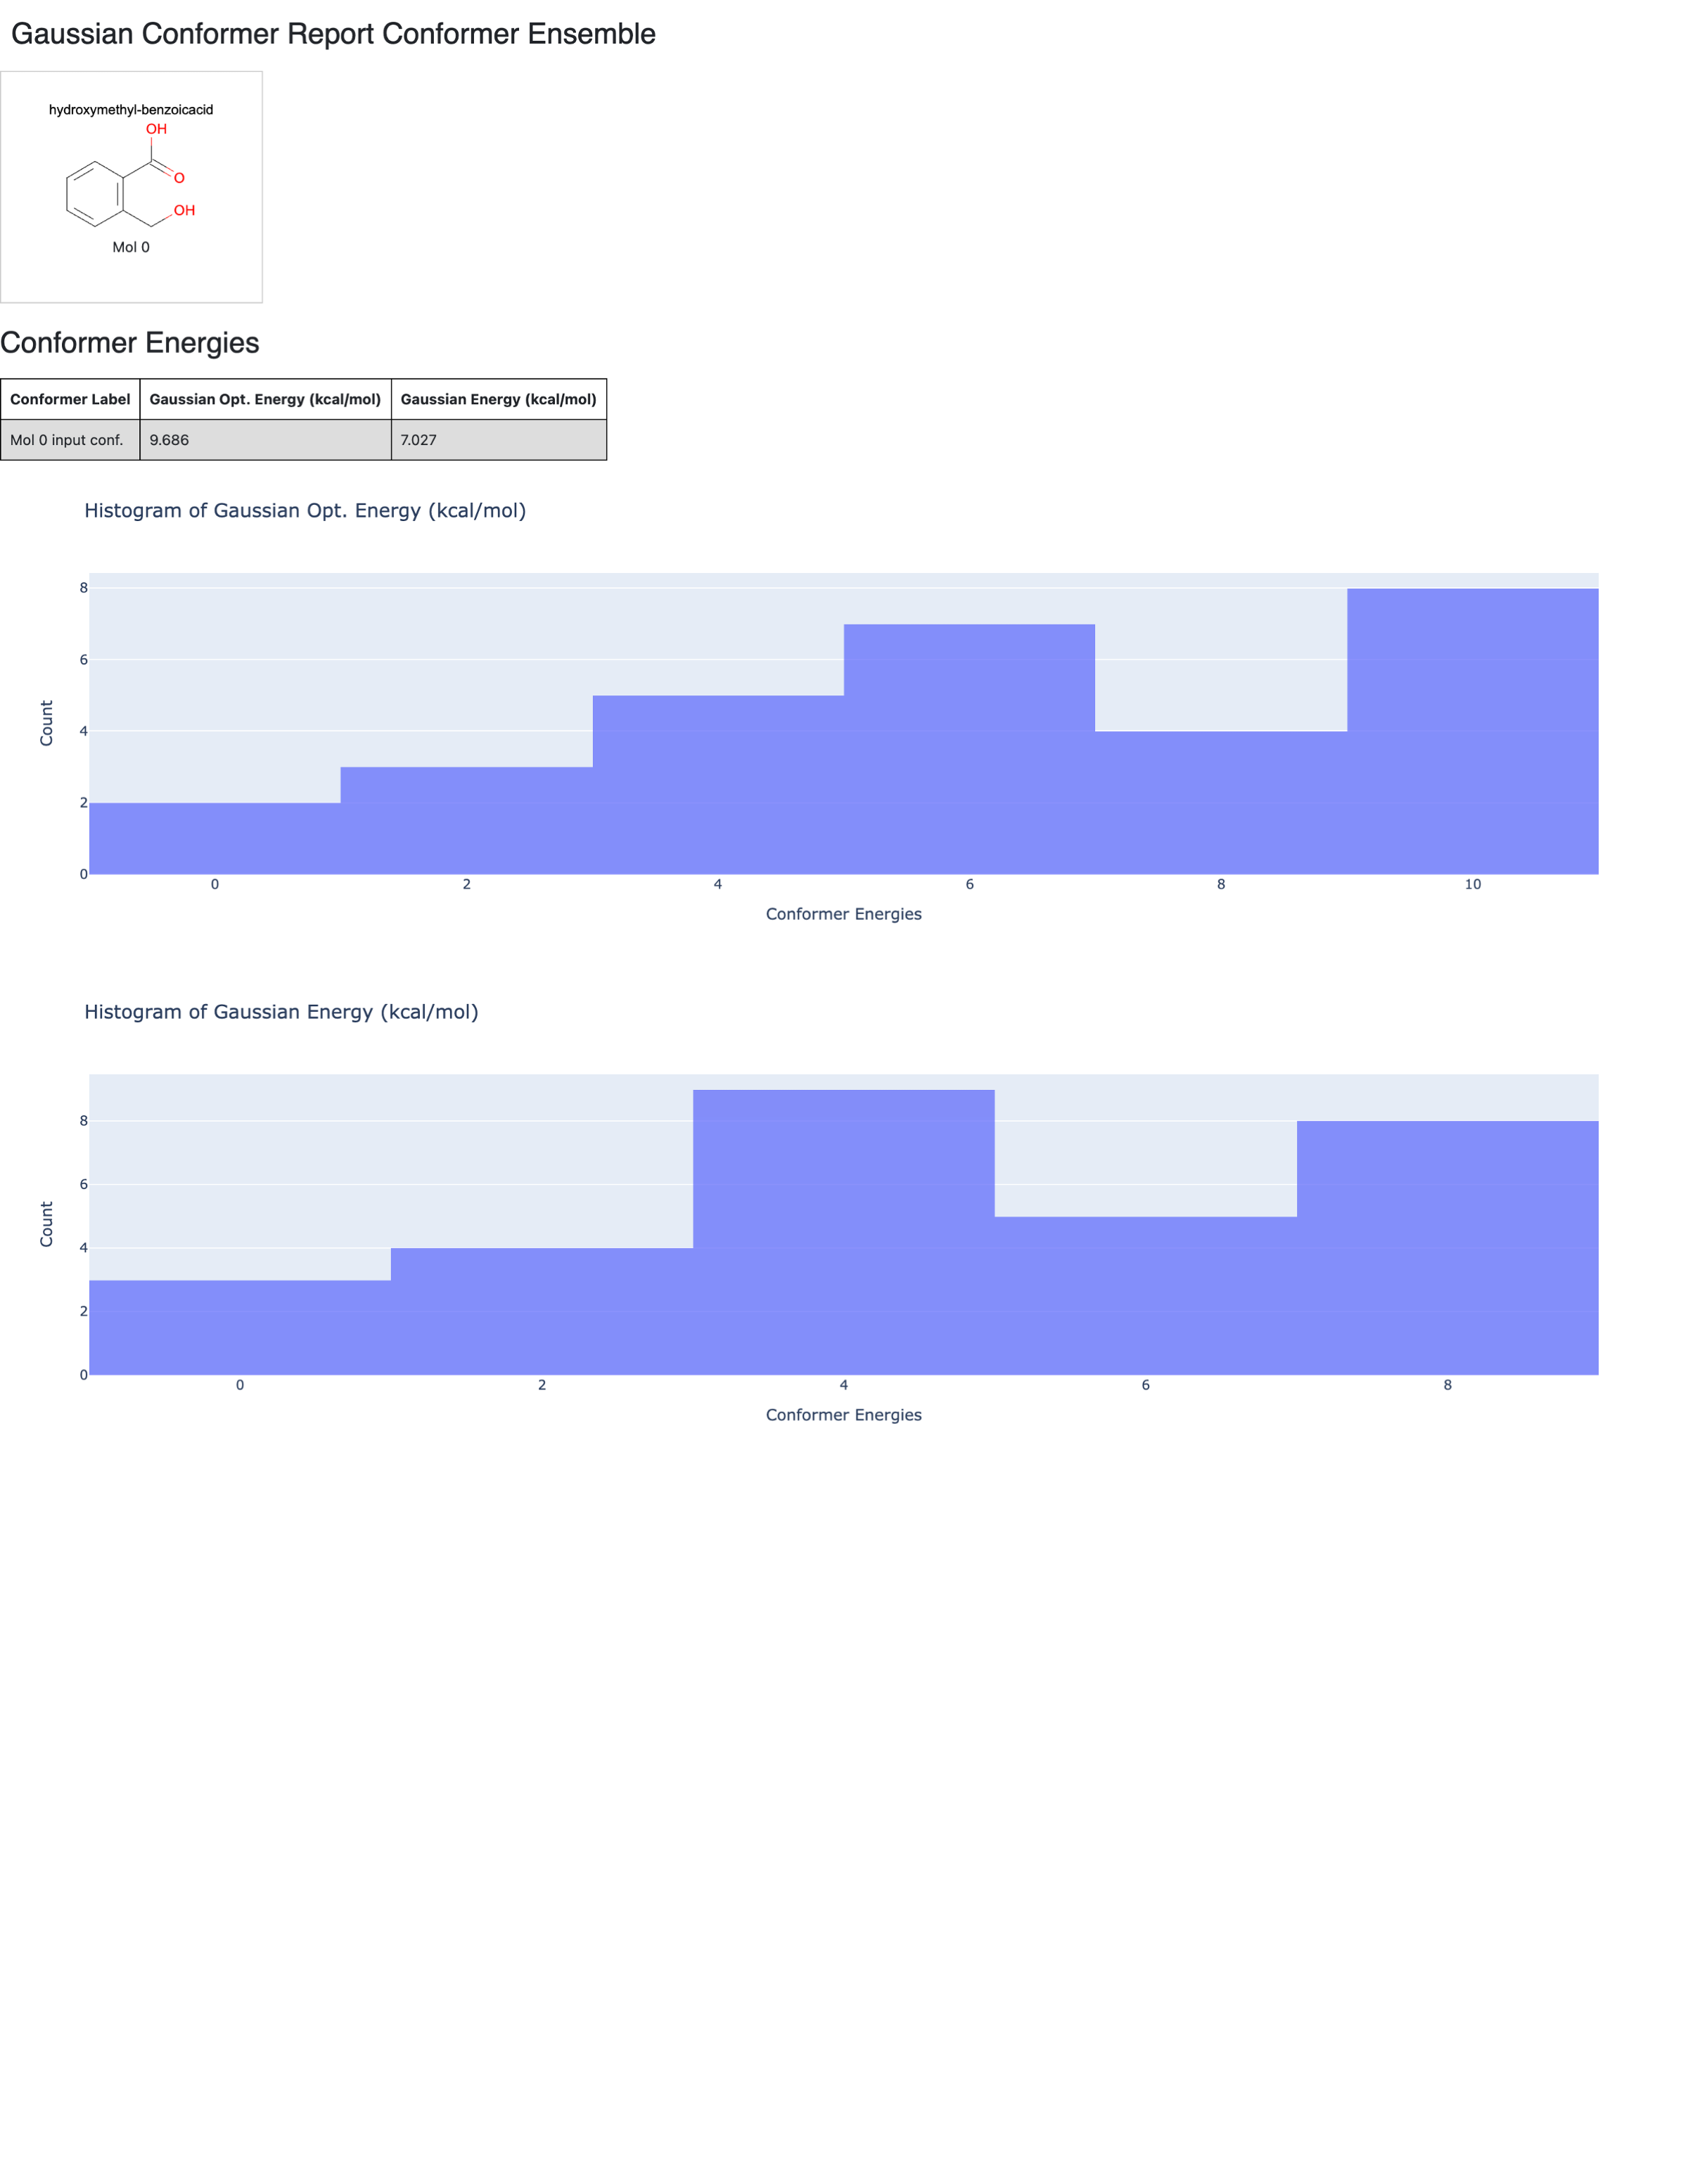
This report summarizes the results of the Conformer Ensemble calculation. First is a table showing the relative energy of the input conformer. In this case, the input conformer has a relative energy around 7 kcal/mol at B3LYP-GD3BJ/6-31G* used for the single point energy.
Next are histograms showing the number of conformers at each relative energy. These energy windows are binned automatically. In this example, each bin is 2 kcal wide.
In this example, there was only one input molecule. Multiple molecules can be used as inputs for this floe, but they will all be included in the same relative energy calculations. This means it is usually best to limit multiple molecule inputs to different tautomers or stereoisomers of the same molecule. When there are multiple inputs, the histograms will be colored by molecule.
Histograms are not useful for small datasets; therefore, if the conformer ensemble is very small (less than 10 conformers), a table of all energies is also included.
The data from this floe can be further analyzed using the Analyze page or 3D page in Orion. Navigate to the Data tab and find the output from this floe. The “Show in Project Data” button on the Jobs page is a nice shortcut.
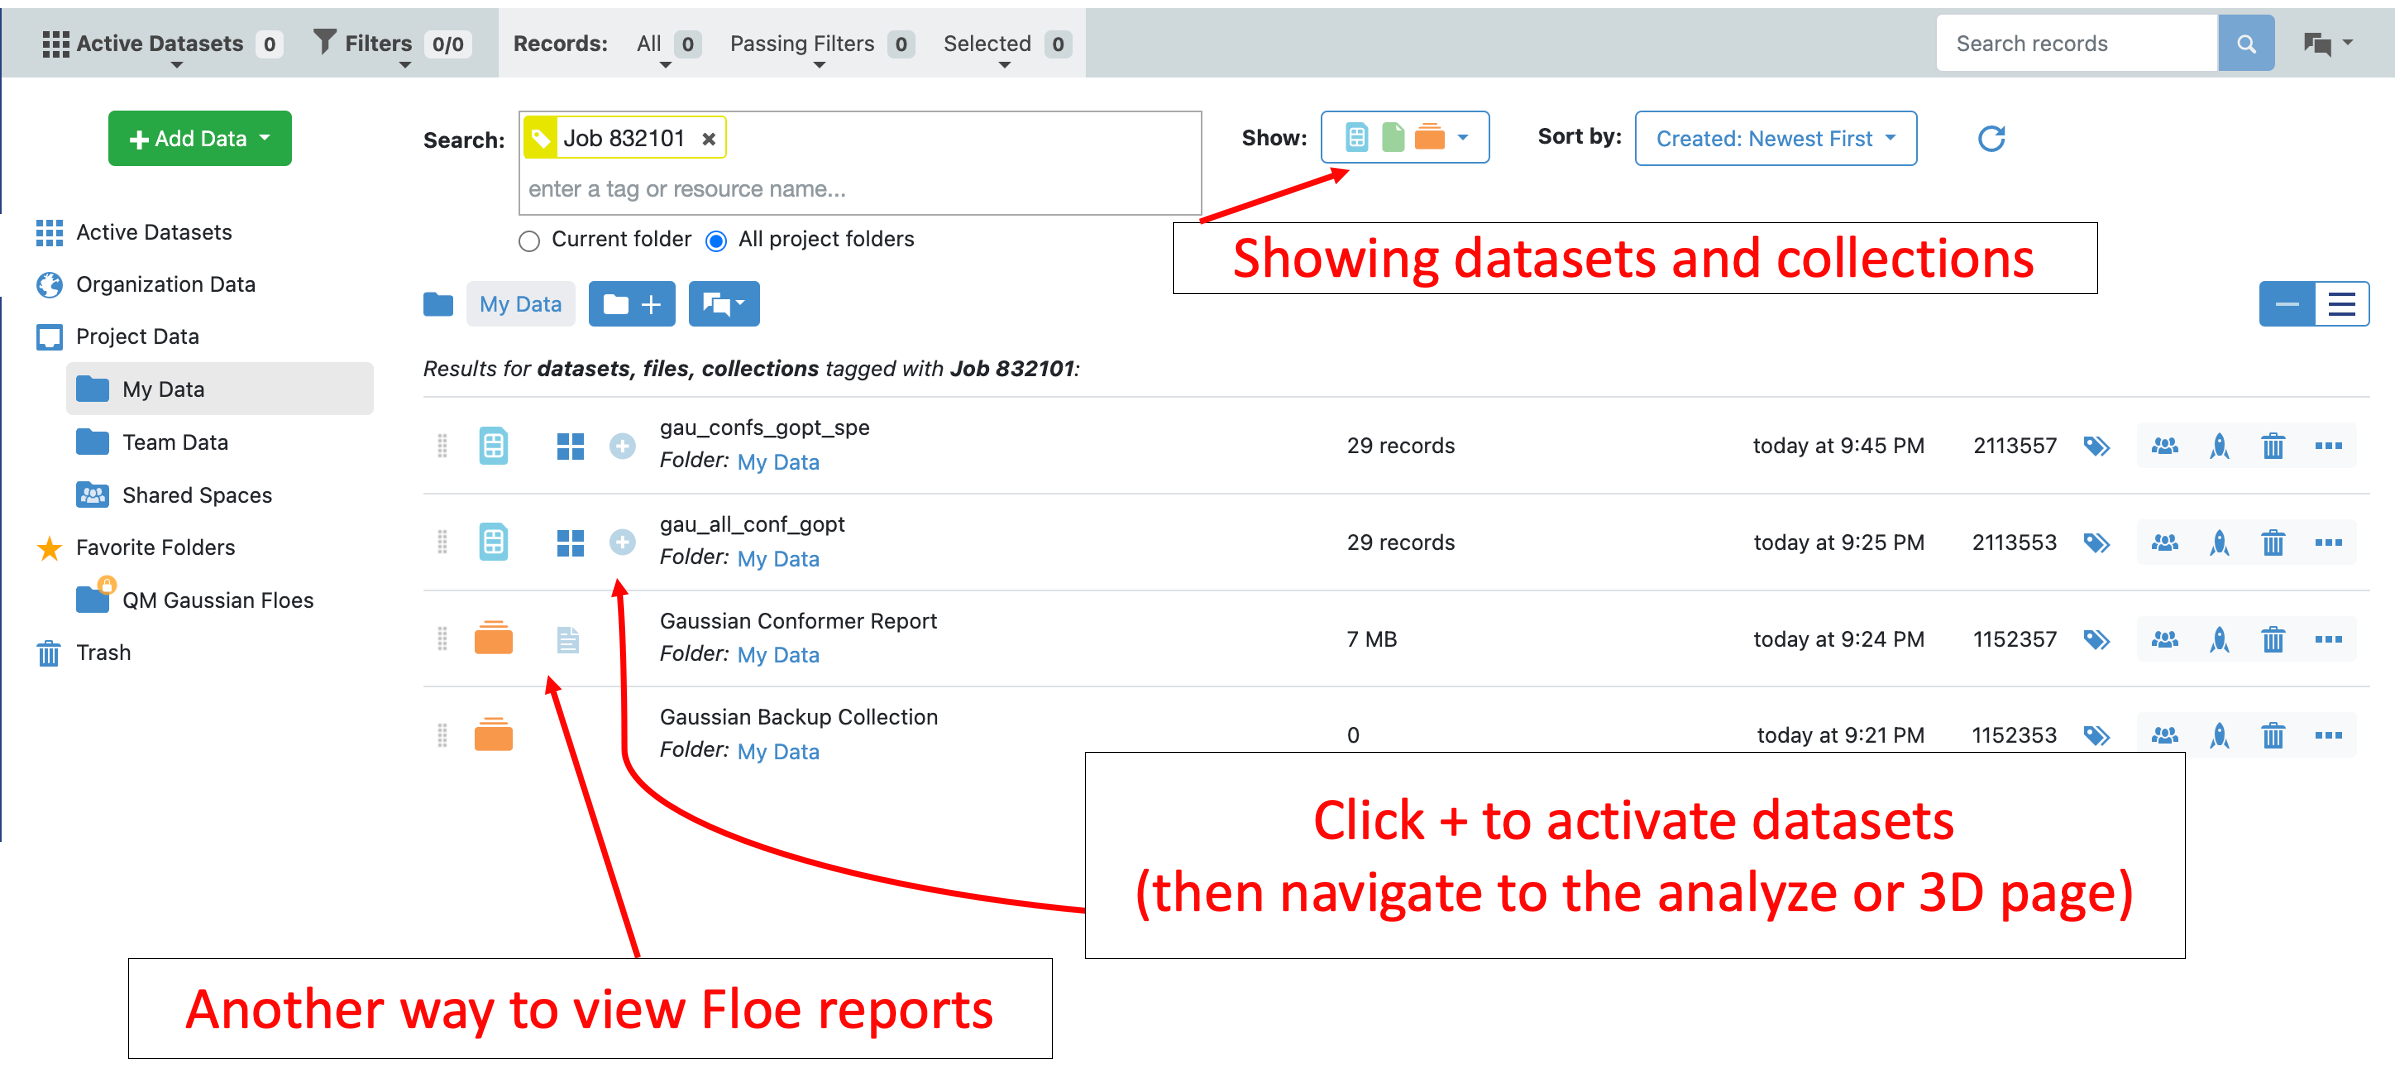
Activate the gau_confs_gopt_spe output from this floe by clicking on the plus sign next to it. Also activate the input dataset. Navigate to the Tutorial Data on Orion and select the plus sign next to the hydroxymethyl-benzoic-acid dataset.
Then navigate to the Analyze page. On the graph, for the x-axis select “RMSD” and on the y-axis select “Gaussian Strain Energy (kcal/mol).”
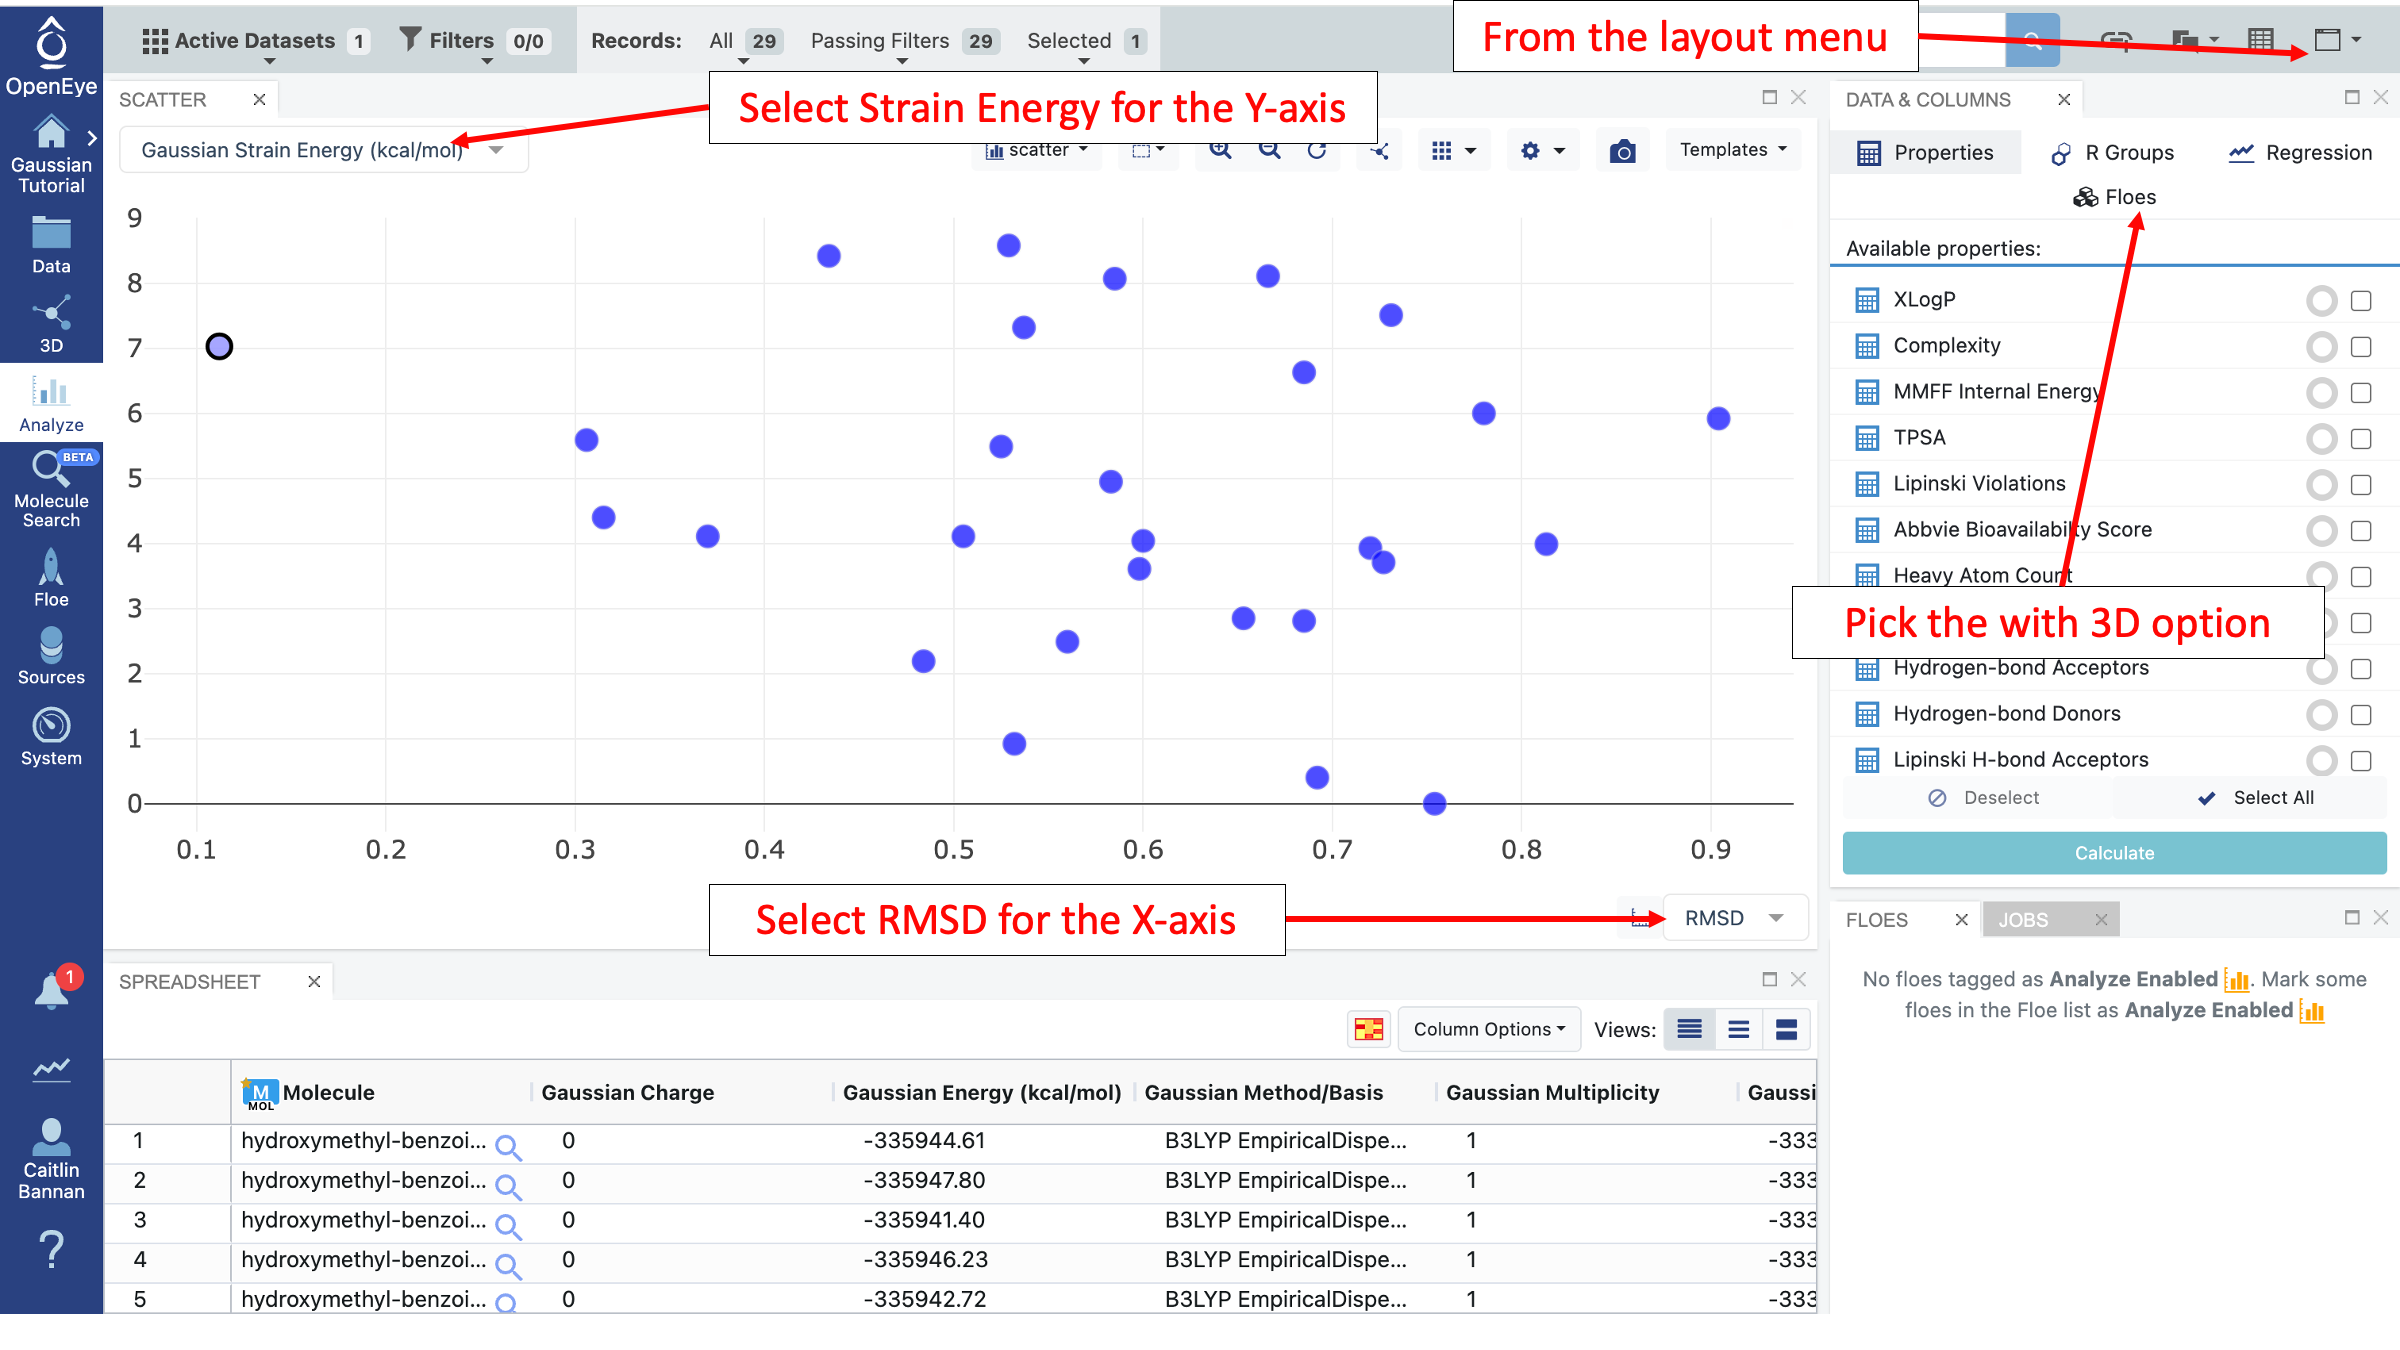
This plot can be helpful for seeing how the input conformer compares to the full ensemble. In this case, the input conformer is fairly random and was taken from a conformer generation. However, in a real application, the input conformer could be bioactive or could have shown promise in other simulations. This type of plot allows a comparison between the input conformer and those generated. In this ensemble, all conformers under 2 kcal/mol are greater than 0.5 angstroms away from the input conformer.
To understand more about these results, select the “Analyze with 3D” layout (as shown above).
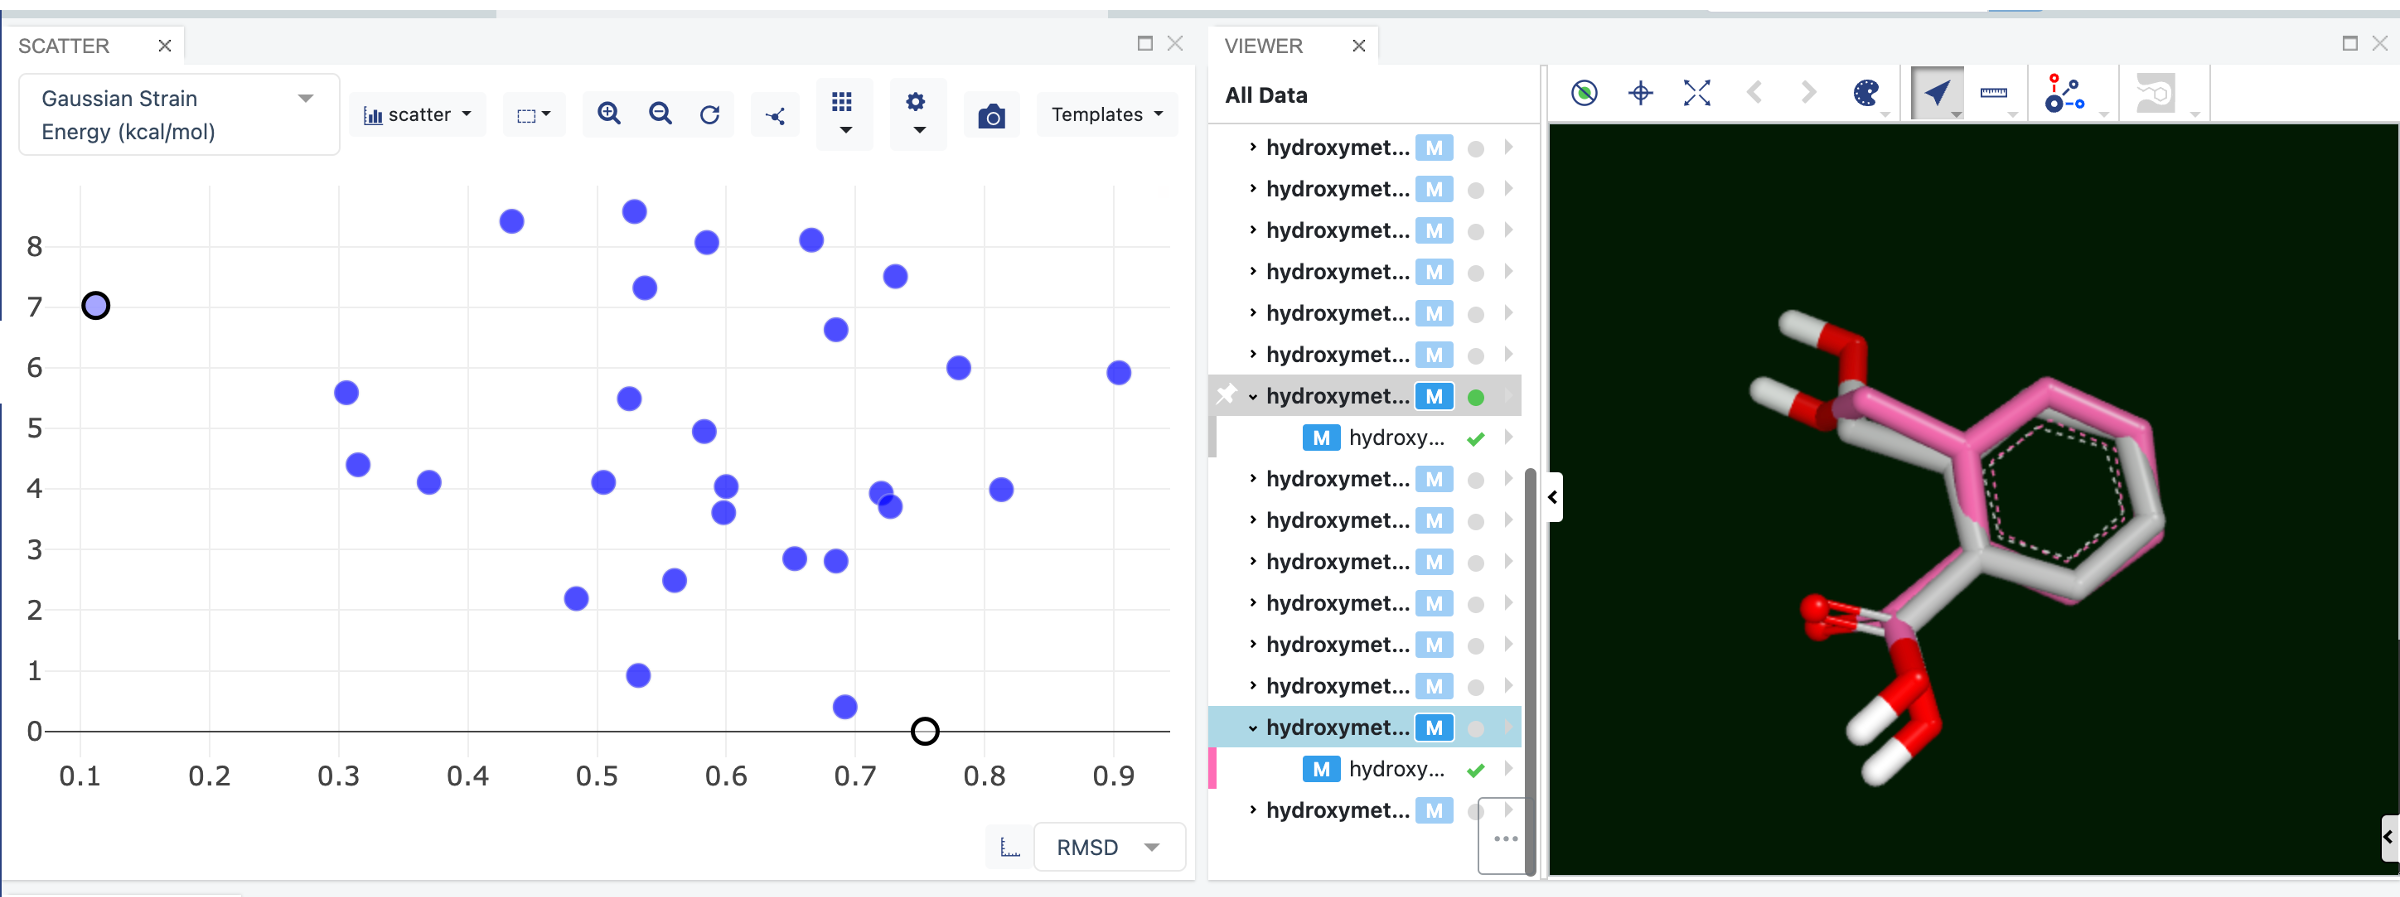
Selecting points on the plot will make that conformer appear in the 3D Viewer on the right. First consider the point at RMSD 0.11 and a Gaussian Strain Energy of 7.0 kcal (the input molecule).
By selecting the conformer at 0.0 kcal/mol you can observe the difference between the input conformer (pink carbons) and the lowest energy conformer (gray carbons).
If you wanted to get single-point energies at an even higher level of theory for all, or some, of these conformers, this dataset could be sent to the Gaussian QM Single Point Energy floe, which has a tutorial available here. In that floe, an implicit solvent could also be included in the calculation. It is possible that the preferred conformers would change in solution.