Introduction
This manual is to familiarize the user with the GraphSim TK functionalities. It does not provide explanations of basic OEChem TK classes and functions. Therefore reading the OEChem TK manual beforehand is highly recommended.
The GraphSim TK library provides a facility for encoding 2D molecular graph information into fingerprints. The following basic fingerprint functionalities are available:
Generation (see Fingerprint Generation chapter)
Storage (see Storage and Retrieval chapter)
Comparison (see Similarity Measures chapter)
Emphasis has been placed on speed, with attention to rapid in-memory fingerprint search (see Fingerprint Database chapter).
Visualizing Molecule Similarity
All images in this manual are generated utilizing the OEDepict TK and Grapheme TK .
Molecule similarity based on fingerprints is visualized by the following method: (See example in Figure: Example of depiction of molecule similarity based on fingerprints)
The
OEGetFPOverlapfunction is utilized to return all common fragments found between two molecules based on a given fingerprint type. These common fragments reveal the similar parts of the two molecules being compared.A “yellow to dark green” linear color gradient is then used to color the molecules by their similarity. Where there is similarity detected between the two molecules i.e. there are common fragments, the color green is used to highlight the bonds. The color gets darker with increasing similarity i.e. as more fragments are shared by the two molecules.
Color pink indicates parts of the molecules that are not sharing any common fragments i.e. they are 2D dissimilar based on the given fingerprint type.
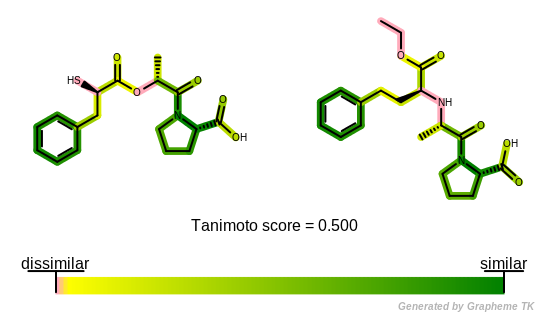
Example of depiction of molecule similarity based on fingerprints
Hint
Visualizing similarity of two molecules based on their fingerprints provides insight into molecule similarity beyond a single numerical score and reveals information about the underlying fingerprint methods.
See also
The Python script that visualizes molecule similarity based on fingerprints can be downloaded from the OpenEye Python Cookbook