Visualizing Shape and Color Overlap
Problem
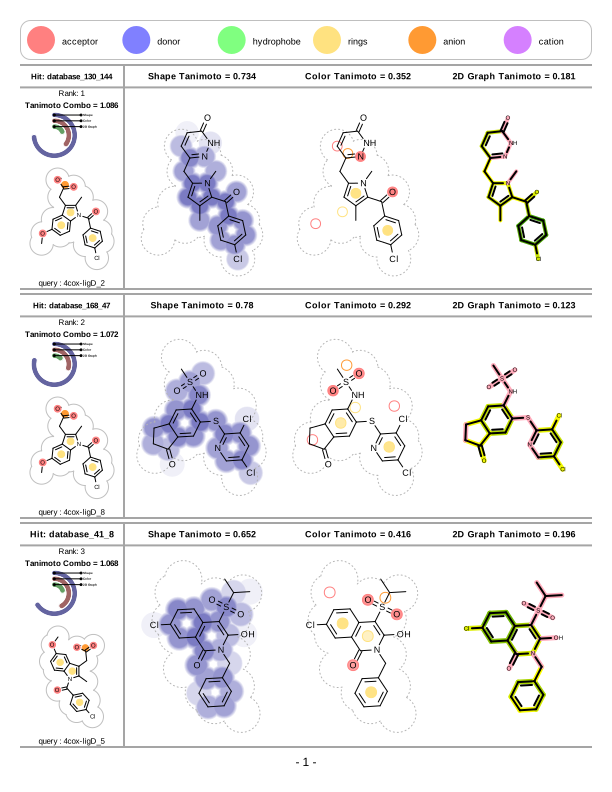
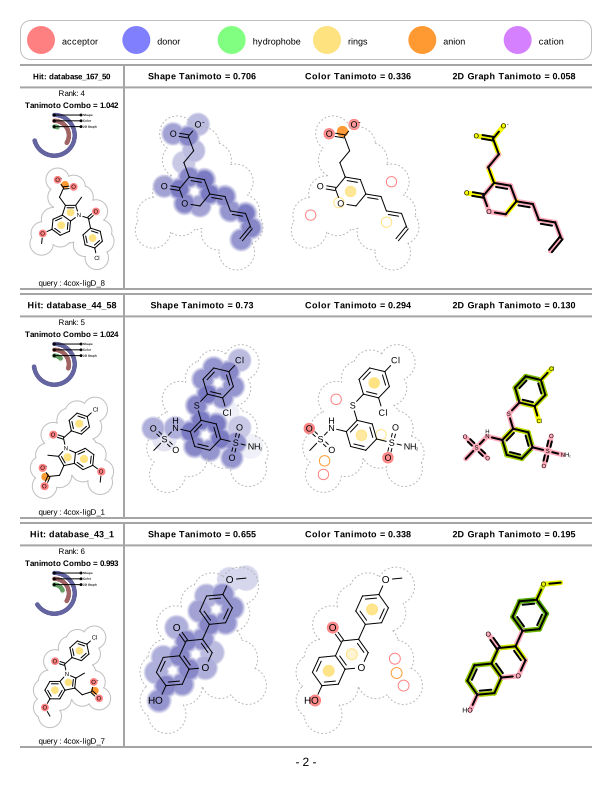
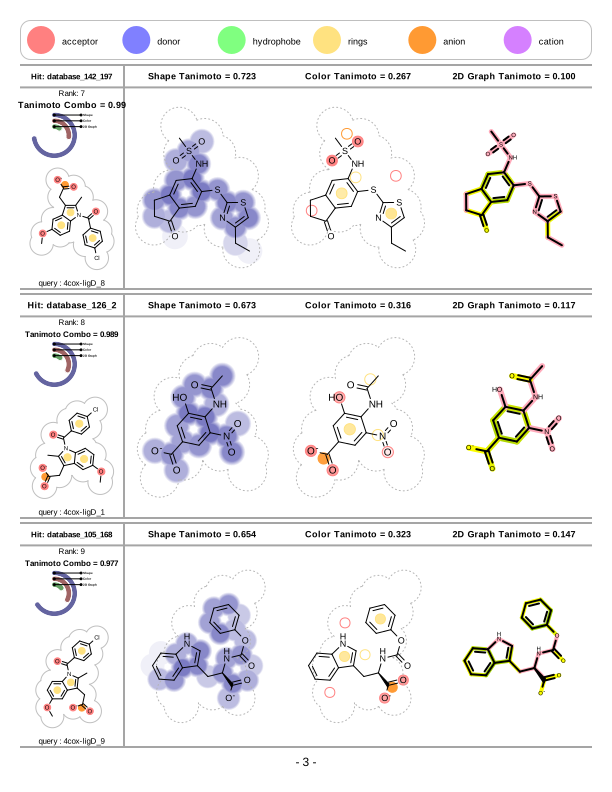
You want to visualize the output of OpenEye’s ROCS application by depicting shape and color similarity between a multi-conformer reference molecule and a set of fit molecules. See Table 1.
ROCS is a tool for aligning and scoring a database of molecules to a reference (i.e. query) molecule. The scores are used to rank molecules based on the probability that they share relevant (biological) properties with the reference molecule. ROCS aligns molecules based on shape similarity and their distributions of chemical features (also referred to as color atoms). ROCS outputs a file of the best alignment and scores for each of the database molecules to the reference molecule.
While the Python script of this recipe is designed to visualize the output of OpenEye’s ROCS application, it can be easily modified to depict any set of molecules that are pre-aligned to a reference molecule.
Along with shape and color overlays, the script can also depict the 2D graph similarity between the reference molecule and the set of fit molecules. This helps to easily identify molecules with high shape and color similarity but with a novel 2D molecular graph (i.e. with low 2D similarity scores). See examples in Table 2.
page 1 |
page 2 |
page 3 |
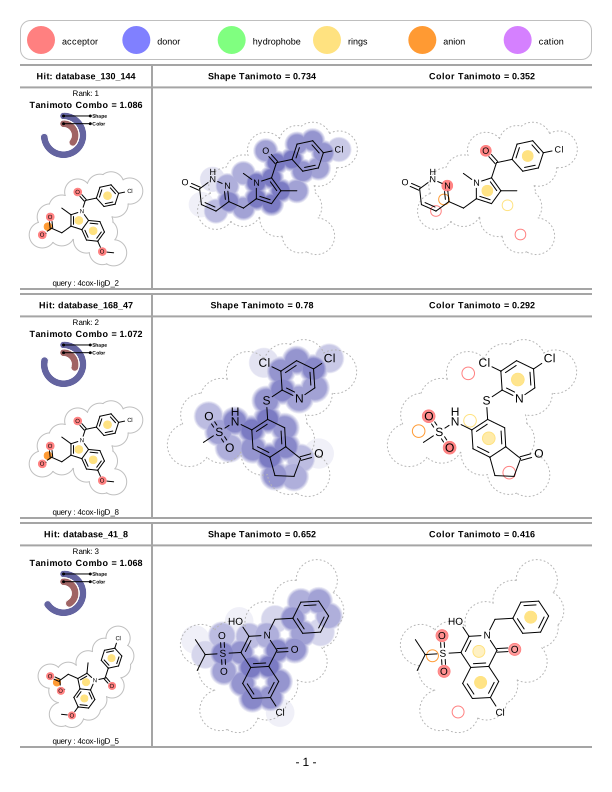
|
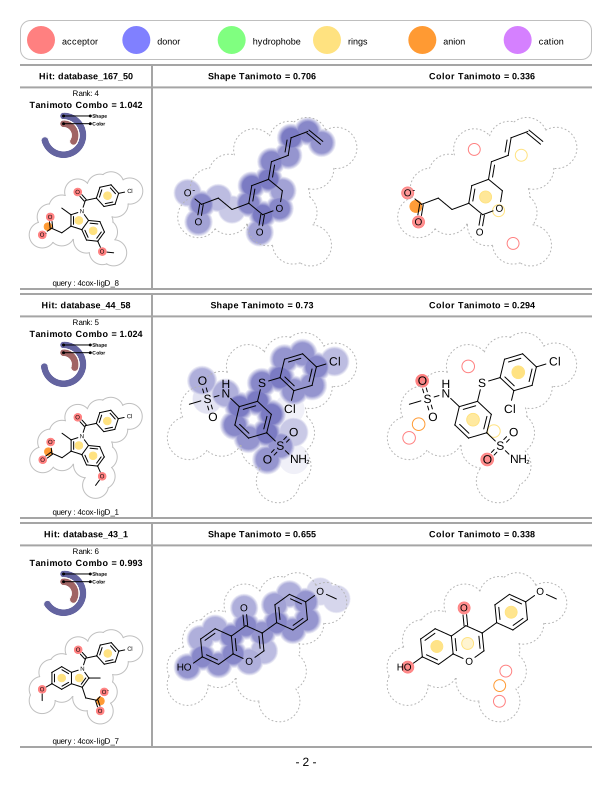
|
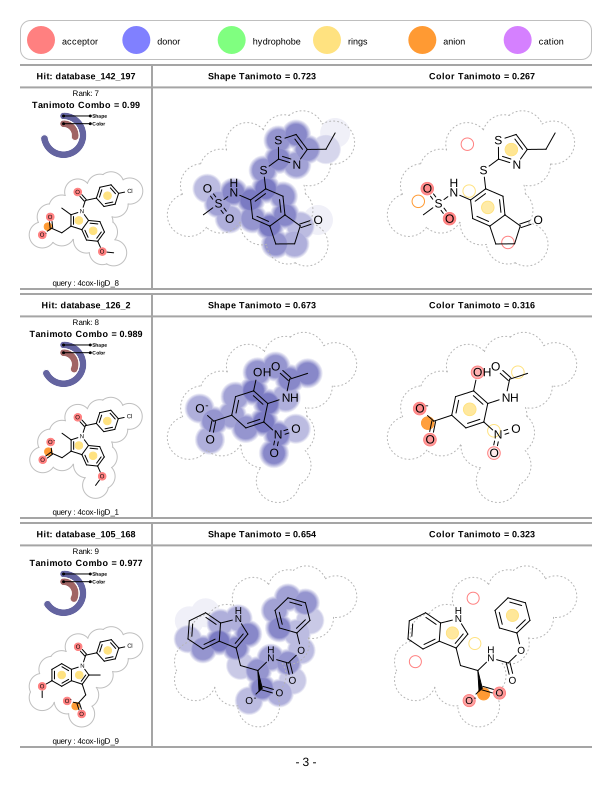
|
Ingredients
|
Difficulty level
🌶️ 🌶️ 🌶️
Download
Source Code
shapeoverlap2pdf
#!/usr/bin/env python3
# (C) 2026 Cadence Design Systems, Inc. (Cadence)
# All rights reserved.
# TERMS FOR USE OF SAMPLE CODE The software below ("Sample Code") is
# provided to current licensees or subscribers of Cadence products or
# SaaS offerings (each a "Customer").
# Customer is hereby permitted to use, copy, and modify the Sample Code,
# subject to these terms. Cadence claims no rights to Customer's
# modifications. Modification of Sample Code is at Customer's sole and
# exclusive risk. Sample Code may require Customer to have a then
# current license or subscription to the applicable Cadence offering.
# THE SAMPLE CODE IS PROVIDED "AS IS", WITHOUT WARRANTY OF ANY KIND,
# EXPRESS OR IMPLIED.  CADENCE DISCLAIMS ALL WARRANTIES, INCLUDING, BUT
# NOT LIMITED TO, WARRANTIES OF MERCHANTABILITY, FITNESS FOR A
# PARTICULAR PURPOSE AND NONINFRINGEMENT. In no event shall Cadence be
# liable for any damages or liability in connection with the Sample Code
# or its use.

"""Depicts shape and color overlap between a 3D reference and pre-aligned fit molecules."""

import argparse
import os
import pathlib
import sys

import numpy as np
import rich.console
from openeye import oechem, oedepict, oegrapheme, oegraphsim, oeshape
from rich.progress import track
from rich_argparse import HelpPreviewAction, RichHelpFormatter

__SCRIPT_NAME__ = pathlib.Path(__file__).absolute().stem
__SCRIPT_DESC__ = (
    "Depict shape and color overlap between a 3D reference and fit molecules"
)
__SCRIPT_TOOLKITS__ = ["oechem", "oedepict", "oegrapheme", "oegraphsim", "oeshape"]
__SCRIPT_CATEGORIES__ = ["visualization"]


def parse_options() -> argparse.Namespace:
    """Set up command line options."""
    parser = argparse.ArgumentParser(
        add_help=True,
        formatter_class=RichHelpFormatter,
        description="[yellow]" + __SCRIPT_DESC__ + "[/yellow]",
    )

    io_group = parser.add_argument_group("Input/output options")
    io_group.add_argument(
        "--mol",
        metavar="MOL-FILE",
        type=str,
        required=True,
        help="input molecule file (first molecule is the reference)",
    )
    io_group.add_argument(
        "--report",
        metavar="REPORT-FILE",
        type=str,
        required=True,
        help="output report file (.pdf)",
    )

    gen_group = parser.add_argument_group("General options")
    gen_group.add_argument(
        "--max-hits",
        type=int,
        default=0,
        metavar="N",
        help="maximum number of hits to depict; 0 means no limit (default: %(default)s)",
    )
    gen_group.add_argument(
        "--depict-sim",
        action="store_true",
        help="calculate and depict 2D molecule similarity (default: %(default)s)",
    )

    report_group = parser.add_argument_group("Report options")
    report_group.add_argument(
        "--page-by-page",
        action="store_true",
        help="write pages of report to separate numbered image files (default: %(default)s)",
    )

    parser.add_argument("--help-image", action=HelpPreviewAction)
    parser.add_argument(
        "--save-console-svg",
        default=False,
        action="store_true",
        help=f"run command and capture console output in {__SCRIPT_NAME__}.svg file",
    )
    return parser.parse_args()


def main() -> int:
    """Depict shape and color overlap in a PDF report."""
    args = parse_options()

    console = rich.console.Console(record=args.save_console_svg, highlight=False)

    mol_path = pathlib.Path(args.mol)
    if not mol_path.exists():
        console.print(f"[red]Error: Cannot open input file '{mol_path}'![/red]")
        return os.EX_NOINPUT

    ifs = oechem.oemolistream()
    if not ifs.open(str(mol_path)):
        console.print(f"[red]Error: Cannot open input file '{mol_path}'![/red]")
        return os.EX_NOINPUT

    _check_report_file(args)

    ref_mol = oechem.OEMol()
    if not oechem.OEReadMolecule(ifs, ref_mol):
        console.print("[red]Error: Cannot read reference molecule![/red]")
        return os.EX_DATAERR

    report_opts = oedepict.OEReportOptions(3, 1)
    report_opts.SetHeaderHeight(40.0)
    report_opts.SetFooterHeight(20.0)
    report = oedepict.OEReport(report_opts)

    cff = oeshape.OEColorForceField()
    cff.Init(oeshape.OEColorFFType_ImplicitMillsDean)
    cff_display = oegrapheme.OEColorForceFieldDisplay(cff)

    query_opts = _get_shape_query_display_options(args.depict_sim)

    ref_mol_displays: dict[str, oegrapheme.OEShapeQueryDisplay] = {}
    _init_multi_query_displays(ref_mol_displays, ref_mol, cff, query_opts)
    console.print(
        f"Shape overlaps will be generated for the reference with {len(ref_mol_displays)} conformations."
    )

    fit_mols: list[oechem.OEMolBase] = [
        oechem.OEGraphMol(m)
        for i, m in enumerate(ifs.GetOEGraphMols())
        if args.max_hits <= 0 or i < args.max_hits
    ]

    depict_shape_color_graphsim_overlaps(
        report, ref_mol, ref_mol_displays, fit_mols, args.depict_sim
    )

    cff_opts = oegrapheme.OEColorForceFieldLegendDisplayOptions(1, 6)
    for header in report.GetHeaders():
        oegrapheme.OEDrawColorForceFieldLegend(header, cff_display, cff_opts)
        oedepict.OEDrawCurvedBorder(header, oedepict.OELightGreyPen, 10.0)

    font = oedepict.OEFont(
        oedepict.OEFontFamily_Default,
        oedepict.OEFontStyle_Default,
        12,
        oedepict.OEAlignment_Center,
        oechem.OEBlack,
    )
    for idx, footer in enumerate(report.GetFooters()):
        oedepict.OEDrawTextToCenter(footer, f"- {idx + 1} -", font)

    if args.page_by_page:
        oedepict.OEWriteReportPageByPage(args.report, report)
    else:
        oedepict.OEWriteReport(args.report, report)

    console.print(
        f"[green]Report written to '{pathlib.Path(args.report).name}'[/green]"
    )
    if args.save_console_svg:
        console.save_svg(f"{__SCRIPT_NAME__}.svg", title="output")

    return os.EX_OK


def depict_shape_color_graphsim_overlaps(
    report: oedepict.OEReport,
    ref_mol: oechem.OEMCMolBase,
    ref_mol_displays: dict[str, oegrapheme.OEShapeQueryDisplay],
    fit_mols: list[oechem.OEMolBase],
    depict_sim: bool,
) -> None:
    """Depict shape, color, and optionally 2D similarities for fit molecules."""
    fp_tag = oechem.OEGetTag("fp_overlap")
    fp_type: oegraphsim.OEFPTypeBase | None = None
    ref_mol_fp: oegraphsim.OEFingerPrint | None = None
    bond_glyph: oegrapheme.OEBondGlyphBase | None = None
    if depict_sim and ref_mol.GetMaxBondIdx() > 0:
        fp_type = oegraphsim.OEGetFPType(oegraphsim.OEFPType_Tree)
        ref_mol_fp = oegraphsim.OEFingerPrint()
        oegraphsim.OEMakeFP(ref_mol_fp, ref_mol, fp_type)
        if fp_type:
            fp_color_gradient = _get_fingerprint_color_gradient(
                _get_max_bond_self_similarity_score(ref_mol, fp_type)
            )
        bond_glyph = ColorBondByOverlapScore(fp_color_gradient, fp_tag)

    shape_opts = _get_shape_overlap_display_options()
    color_opts = _get_color_overlap_display_options()

    fit_table_opts = _get_fit_table_options(depict_sim)
    ref_table_opts = _get_ref_table_options()

    score_font = oedepict.OEFont(
        oedepict.OEFontFamily_Default,
        oedepict.OEFontStyle_Bold,
        9,
        oedepict.OEAlignment_Center,
        oechem.OEBlack,
    )

    for fit_idx, fit_mol in enumerate(
        track(fit_mols, description="Generating overlays"), start=1
    ):
        if not oechem.OEHasSDData(fit_mol, "ROCS_ShapeQuery"):
            oechem.OEThrow.Warning(
                f"Shape query reference is not available for molecule '{fit_mol.GetTitle()}'"
            )
            continue

        ref_title = oechem.OEGetSDData(fit_mol, "ROCS_ShapeQuery")

        if ref_title not in ref_mol_displays:
            oechem.OEThrow.Warning(
                f"Shape query reference '{ref_title}' is not valid for molecule '{fit_mol.GetTitle()}'"
            )
            continue
        ref_disp = ref_mol_displays[ref_title]

        cell = report.NewCell()
        fittable = oedepict.OEImageTable(cell, fit_table_opts)

        fittable.DrawText(fittable.GetCell(1, 1), f"Hit: {fit_mol.GetTitle()}")

        ref_table = oedepict.OEImageTable(fittable.GetCell(2, 1), ref_table_opts)

        ref_table.DrawText(ref_table.GetCell(1, 1), f"Rank: {fit_idx}")
        _render_score(
            ref_table.GetCell(2, 1),
            fit_mol,
            "ROCS_TanimotoCombo",
            "Tanimoto Combo",
            score_font,
        )

        sim_score: float | None = None
        if fp_type and ref_mol_fp and fp_tag:
            sim_score = _calc_fingerprint_similarity(
                ref_mol, ref_mol_fp, fit_mol, fp_type, fp_tag
            )
        _render_score_radial(ref_table.GetCell(3, 1), fit_mol, sim_score)

        oegrapheme.OERenderShapeQuery(ref_table.GetCell(4, 1), ref_disp)
        ref_table.DrawText(ref_table.GetCell(5, 1), f"query : {ref_title}")

        overlap_disp = oegrapheme.OEShapeOverlapDisplay(
            ref_disp, fit_mol, shape_opts, color_opts
        )

        # shape overlap
        _render_score(
            fittable.GetHeaderCell(1),
            fit_mol,
            "ROCS_ShapeTanimoto",
            "Shape Tanimoto",
            score_font,
        )
        oegrapheme.OERenderShapeOverlap(fittable.GetCell(2, 2), overlap_disp)

        # color overlap
        _render_score(
            fittable.GetHeaderCell(2),
            fit_mol,
            "ROCS_ColorTanimoto",
            "Color Tanimoto",
            score_font,
        )
        oegrapheme.OERenderColorOverlap(fittable.GetCell(2, 3), overlap_disp)

        # 2D similarity
        if bond_glyph:
            sim_title = f"2D Graph Tanimoto = {sim_score:4.3f}"
            oedepict.OEDrawTextToCenter(
                fittable.GetHeaderCell(3), sim_title, score_font
            )
            _depict_molecule_similarity(
                fittable.GetCell(2, 4), fit_mol, ref_disp, bond_glyph
            )


def _init_multi_query_displays(
    query_map: dict,
    ref_mol: oechem.OEMCMolBase,
    cff: oeshape.OEColorForceField,
    query_opts: oegrapheme.OEShapeQueryDisplayOptions,
) -> int:
    """Generate shape display objects for each conformation of the reference molecule."""
    for conf in ref_mol.GetConfs():
        title = conf.GetTitle()
        query_map[title] = oegrapheme.OEShapeQueryDisplay(conf, cff, query_opts)
    return len(query_map)


def _add_common_display_options(opts: oedepict.OE2DMolDisplayOptions) -> None:
    """Set common display options shared across query, shape, and color displays."""
    opts.SetTitleLocation(oedepict.OETitleLocation_Hidden)
    opts.SetAtomLabelFontScale(1.5)
    pen = oedepict.OEPen(oechem.OEBlack, oechem.OEBlack, oedepict.OEFill_Off, 1.5)
    opts.SetDefaultBondPen(pen)


def _get_shape_query_display_options(
    depict_sim: bool,
) -> oegrapheme.OEShapeQueryDisplayOptions:
    """Create shape query display options."""
    query_opts = oegrapheme.OEShapeQueryDisplayOptions()
    _add_common_display_options(query_opts)
    arc_pen = oedepict.OEPen(oedepict.OELightGreyPen)
    query_opts.SetSurfaceArcFxn(oegrapheme.OEDefaultArcFxn(arc_pen))
    if depict_sim:
        query_opts.SetDepictOrientation(oedepict.OEDepictOrientation_Vertical)
    else:
        query_opts.SetDepictOrientation(oedepict.OEDepictOrientation_Square)
    query_opts.SetBackgroundColor(oechem.OETransparentColor)
    return query_opts


def _get_shape_overlap_display_options() -> oegrapheme.OEShapeOverlapDisplayOptions:
    """Create shape overlap display options."""
    shape_opts = oegrapheme.OEShapeOverlapDisplayOptions()
    _add_common_display_options(shape_opts)
    arc_pen = oedepict.OEPen(
        oechem.OEGrey, oechem.OEGrey, oedepict.OEFill_Off, 1.0, 0x1111
    )
    shape_opts.SetQuerySurfaceArcFxn(oegrapheme.OEDefaultArcFxn(arc_pen))
    shape_opts.SetOverlapColor(oechem.OEColor(110, 110, 190))
    shape_opts.SetOverlapDisplayStyle(
        oegrapheme.OEShapeOverlapDisplayStyle_PropertyCloud
    )
    shape_opts.SetBackgroundColor(oechem.OETransparentColor)
    return shape_opts


def _get_color_overlap_display_options() -> oegrapheme.OEColorOverlapDisplayOptions:
    """Create color overlap display options."""
    color_opts = oegrapheme.OEColorOverlapDisplayOptions()
    _add_common_display_options(color_opts)
    arc_pen = oedepict.OEPen(
        oechem.OEGrey, oechem.OEGrey, oedepict.OEFill_Off, 1.0, 0x1111
    )
    color_opts.SetQuerySurfaceArcFxn(oegrapheme.OEDefaultArcFxn(arc_pen))
    color_opts.SetBackgroundColor(oechem.OETransparentColor)
    return color_opts


def _get_fit_table_options(depict_sim: bool) -> oedepict.OEImageTableOptions:
    """Create table options for fit molecule cells."""
    rows = 2
    cols = 4 if depict_sim else 3
    table_opts = oedepict.OEImageTableOptions(
        rows, cols, oedepict.OEImageTableStyle_LightGrey
    )
    table_opts.SetHeader(True)
    table_opts.SetStubColumn(True)
    table_opts.SetRowHeights([10, 90])
    if depict_sim:
        table_opts.SetColumnWidths([20, 30, 30, 30])
    else:
        table_opts.SetColumnWidths([18, 30, 30])
    table_opts.SetCellColor(oechem.OEWhite, False)
    font = oedepict.OEFont(
        oedepict.OEFontFamily_Default,
        oedepict.OEFontStyle_Bold,
        9,
        oedepict.OEAlignment_Center,
        oechem.OEBlack,
    )
    table_opts.SetHeaderFont(font)
    return table_opts


def _get_ref_table_options() -> oedepict.OEImageTableOptions:
    """Create table options for the reference molecule stub column."""
    table_opts = oedepict.OEImageTableOptions(5, 1, oedepict.OEImageTableStyle_NoStyle)
    table_opts.SetHeader(False)
    table_opts.SetStubColumn(False)
    table_opts.SetRowHeights([6, 6, 25, 60, 6])
    table_opts.SetMargins(0)
    font = oedepict.OEFont(
        oedepict.OEFontFamily_Default,
        oedepict.OEFontStyle_Default,
        8,
        oedepict.OEAlignment_Center,
        oechem.OEBlack,
    )
    table_opts.SetCellFont(font)
    return table_opts


def _get_score(mol: oechem.OEMolBase, sd_tag: str) -> float:
    """Return an SD data value as a float, or 0.0 if not present."""
    if oechem.OEHasSDData(mol, sd_tag):
        return float(oechem.OEGetSDData(mol, sd_tag))
    return 0.0


def _render_score_radial(
    image: oedepict.OEImageBase,
    mol: oechem.OEMolBase,
    fp_score: float | None = None,
) -> None:
    """Render a radial ROCS score chart."""
    shape_score = max(min(_get_score(mol, "ROCS_ShapeTanimoto"), 1.0), 0.0)
    color_score = max(min(_get_score(mol, "ROCS_ColorTanimoto"), 1.0), 0.0)
    if shape_score > 0.0 or color_score > 0.0:
        if fp_score is None:
            scores = oechem.OEDoubleVector([shape_score, color_score])
        else:
            scores = oechem.OEDoubleVector([shape_score, color_score, fp_score])
        oegrapheme.OEDrawROCSScores(image, scores)


def _render_score(
    image: oedepict.OEImageBase,
    mol: oechem.OEMolBase,
    sd_tag: str,
    label: str,
    score_font: oedepict.OEFont,
) -> None:
    """Render a labeled score value centered in the image."""
    score = _get_score(mol, sd_tag)
    if score == 0.0:
        return
    oedepict.OEDrawTextToCenter(image, f"{label} = {score}", score_font)


# ---------------------------------------------------------------------------
# 2D similarity depiction
# ---------------------------------------------------------------------------


def _get_max_bond_self_similarity_score(
    mol: oechem.OEMolBase, fp_type: oegraphsim.OEFPTypeBase
) -> int:
    """Return the maximum bond self-similarity overlap count."""
    count_bonds = np.zeros(mol.GetMaxBondIdx(), dtype=np.uint32)
    for match in oegraphsim.OEGetFPOverlap(mol, mol, fp_type):
        for bond in match.GetPatternBonds():
            count_bonds[bond.GetIdx()] += 1
    return int(count_bonds.max())


def _calc_fingerprint_similarity(
    ref_mol: oechem.OEMolBase,
    ref_mol_fp: oegraphsim.OEFingerPrint,
    fit_mol: oechem.OEMolBase,
    fp_type: oegraphsim.OEFPTypeBase,
    tag: str,
) -> float:
    """Calculate fingerprint similarity and annotate bonds with overlap counts."""
    bond_counts = np.zeros(fit_mol.GetMaxBondIdx(), dtype=np.uint32)

    for match in oegraphsim.OEGetFPOverlap(ref_mol, fit_mol, fp_type):
        for bond in match.GetTargetBonds():
            bond_counts[bond.GetIdx()] += 1

    for bond in fit_mol.GetBonds():
        bond.SetData(tag, int(bond_counts[bond.GetIdx()]))

    fit_mol_fp = oegraphsim.OEFingerPrint()
    oegraphsim.OEMakeFP(fit_mol_fp, fit_mol, fp_type)
    return oegraphsim.OETanimoto(ref_mol_fp, fit_mol_fp)


def _get_fingerprint_color_gradient(self_score: int) -> oechem.OELinearColorGradient:
    """Create a color gradient for fingerprint overlap visualization."""
    color_gradient = oechem.OELinearColorGradient()
    color_gradient.AddStop(oechem.OEColorStop(0.0, oechem.OEPinkTint))
    color_gradient.AddStop(oechem.OEColorStop(1.0, oechem.OEYellow))
    color_gradient.AddStop(oechem.OEColorStop(self_score, oechem.OEDarkGreen))
    return color_gradient


def _depict_molecule_similarity(
    cell: oedepict.OEImageBase,
    mol_3d: oechem.OEMolBase,
    ref_disp: oegrapheme.OEShapeQueryDisplay,
    bond_glyph: oegrapheme.OEBondGlyphBase,
) -> None:
    """Align a molecule to the reference and depict 2D fingerprint similarity."""
    mol_2d = oechem.OEGraphMol(mol_3d)
    oegrapheme.OEPrepareAlignedDepictionFrom3D(mol_2d, mol_3d, ref_disp)

    width, height = cell.GetWidth(), cell.GetHeight()
    opts = oedepict.OE2DMolDisplayOptions(width, height, oedepict.OEScale_AutoScale)
    opts.SetAtomColorStyle(oedepict.OEAtomColorStyle_WhiteMonochrome)
    opts.SetTitleLocation(oedepict.OETitleLocation_Hidden)
    opts.SetScale(oegrapheme.OEGetMoleculeSurfaceScale(mol_2d, opts))

    disp = oedepict.OE2DMolDisplay(mol_2d, opts)
    oegrapheme.OEAddGlyph(disp, bond_glyph, oechem.IsTrueBond())
    oedepict.OERenderMolecule(cell, disp, False)


class ColorBondByOverlapScore(oegrapheme.OEBondGlyphBase):
    """Bond glyph that colors bonds by fingerprint overlap score."""

    def __init__(self, color_gradient: oechem.OEColorGradientBase, tag: str) -> None:
        """Initialize the glyph with a color gradient and SD tag for bond data."""
        oegrapheme.OEBondGlyphBase.__init__(self)
        self._color_gradient = color_gradient
        self._tag = tag

    def RenderGlyph(  # noqa: N802
        self, disp: oedepict.OE2DMolDisplay, bond: oechem.OEBondBase
    ) -> bool:
        """Render a bond glyph colored by the fingerprint overlap score stored in the bond data."""
        bond_disp = disp.GetBondDisplay(bond)
        if bond_disp is None or not bond_disp.IsVisible():
            return False

        if not bond.HasData(self._tag):
            return False

        linewidth = disp.GetScale() / 3.0
        color = self._color_gradient.GetColorAt(bond.GetData(self._tag))
        pen = oedepict.OEPen(color, color, oedepict.OEFill_Off, linewidth)

        atom_disp_b = disp.GetAtomDisplay(bond.GetBgn())
        atom_disp_e = disp.GetAtomDisplay(bond.GetEnd())

        layer = disp.GetLayer(oedepict.OELayerPosition_Below)
        layer.DrawLine(atom_disp_b.GetCoords(), atom_disp_e.GetCoords(), pen)

        return True

    def ColorBondByOverlapScore(self):  # noqa:ANN201,  N802
        """Copy constructor."""
        return ColorBondByOverlapScore(self._color_gradient, self._tag).__disown__()


def _check_report_file(args: argparse.Namespace) -> bool:
    ext = pathlib.Path(args.report).suffix[1:]
    if not oedepict.OEIsRegisteredImageFile(ext):
        oechem.OEThrow.Fatal("Unknown image outout type!")

    if not args.page_by_page and not oedepict.OEIsRegisteredMultiPageImageFile(ext):
        oechem.OEThrow.Warning("Report will be generated into separate pages!")
        args.page_by_page = True

    return True


setattr(main, "__SCRIPT_NAME__", __SCRIPT_NAME__)
setattr(main, "__SCRIPT_DESC__", __SCRIPT_DESC__)
setattr(main, "__SCRIPT_TOOLKITS__", __SCRIPT_TOOLKITS__)
setattr(main, "__SCRIPT_CATEGORIES__", __SCRIPT_CATEGORIES__)

if __name__ == "__main__":
    sys.exit(main())
Solution
The main function of the script is depict_shape_color_graphsim_overlaps. After some fingerprint generation and depiction style setup, the function loops over all fit molecules and determines which conformation of the reference corresponds to each fit molecule. In the case of a multi-conformer reference molecule, a single conformation cannot be used as the reference, otherwise the generated shape and color 2D depictions would not accurately represent the corresponding 3D information.
In the multi-page report, the following images are generated for each fit molecule in the dataset:
Score diagram (OEDrawROCSScores) and reference molecule display (OERenderShapeQuery).
Shape overlap between the reference and the fit molecule (OERenderShapeOverlap) with a pre-calculated shape Tanimoto score.
Color overlap between the reference and the fit molecule (OERenderColorOverlap) with a pre-calculated color Tanimoto score.
2D similarity (if requested) between the reference and the fit molecule with Tree fingerprint similarity score calculated on-the-fly.
def depict_shape_color_graphsim_overlaps(
    report: oedepict.OEReport,
    ref_mol: oechem.OEMCMolBase,
    ref_mol_displays: dict[str, oegrapheme.OEShapeQueryDisplay],
    fit_mols: list[oechem.OEMolBase],
    depict_sim: bool,
) -> None:
    """Depict shape, color, and optionally 2D similarities for fit molecules."""
    fp_tag = oechem.OEGetTag("fp_overlap")
    fp_type: oegraphsim.OEFPTypeBase | None = None
    ref_mol_fp: oegraphsim.OEFingerPrint | None = None
    bond_glyph: oegrapheme.OEBondGlyphBase | None = None
    if depict_sim and ref_mol.GetMaxBondIdx() > 0:
        fp_type = oegraphsim.OEGetFPType(oegraphsim.OEFPType_Tree)
        ref_mol_fp = oegraphsim.OEFingerPrint()
        oegraphsim.OEMakeFP(ref_mol_fp, ref_mol, fp_type)
        if fp_type:
            fp_color_gradient = _get_fingerprint_color_gradient(
                _get_max_bond_self_similarity_score(ref_mol, fp_type)
            )
        bond_glyph = ColorBondByOverlapScore(fp_color_gradient, fp_tag)

    shape_opts = _get_shape_overlap_display_options()
    color_opts = _get_color_overlap_display_options()

    fit_table_opts = _get_fit_table_options(depict_sim)
    ref_table_opts = _get_ref_table_options()

    score_font = oedepict.OEFont(
        oedepict.OEFontFamily_Default,
        oedepict.OEFontStyle_Bold,
        9,
        oedepict.OEAlignment_Center,
        oechem.OEBlack,
    )

    for fit_idx, fit_mol in enumerate(
        track(fit_mols, description="Generating overlays"), start=1
    ):
        if not oechem.OEHasSDData(fit_mol, "ROCS_ShapeQuery"):
            oechem.OEThrow.Warning(
                f"Shape query reference is not available for molecule '{fit_mol.GetTitle()}'"
            )
            continue

        ref_title = oechem.OEGetSDData(fit_mol, "ROCS_ShapeQuery")

        if ref_title not in ref_mol_displays:
            oechem.OEThrow.Warning(
                f"Shape query reference '{ref_title}' is not valid for molecule '{fit_mol.GetTitle()}'"
            )
            continue
        ref_disp = ref_mol_displays[ref_title]

        cell = report.NewCell()
        fittable = oedepict.OEImageTable(cell, fit_table_opts)

        fittable.DrawText(fittable.GetCell(1, 1), f"Hit: {fit_mol.GetTitle()}")

        ref_table = oedepict.OEImageTable(fittable.GetCell(2, 1), ref_table_opts)

        ref_table.DrawText(ref_table.GetCell(1, 1), f"Rank: {fit_idx}")
        _render_score(
            ref_table.GetCell(2, 1),
            fit_mol,
            "ROCS_TanimotoCombo",
            "Tanimoto Combo",
            score_font,
        )

        sim_score: float | None = None
        if fp_type and ref_mol_fp and fp_tag:
            sim_score = _calc_fingerprint_similarity(
                ref_mol, ref_mol_fp, fit_mol, fp_type, fp_tag
            )
        _render_score_radial(ref_table.GetCell(3, 1), fit_mol, sim_score)

        oegrapheme.OERenderShapeQuery(ref_table.GetCell(4, 1), ref_disp)
        ref_table.DrawText(ref_table.GetCell(5, 1), f"query : {ref_title}")

        overlap_disp = oegrapheme.OEShapeOverlapDisplay(
            ref_disp, fit_mol, shape_opts, color_opts
        )

        # shape overlap
        _render_score(
            fittable.GetHeaderCell(1),
            fit_mol,
            "ROCS_ShapeTanimoto",
            "Shape Tanimoto",
            score_font,
        )
        oegrapheme.OERenderShapeOverlap(fittable.GetCell(2, 2), overlap_disp)

        # color overlap
        _render_score(
            fittable.GetHeaderCell(2),
            fit_mol,
            "ROCS_ColorTanimoto",
            "Color Tanimoto",
            score_font,
        )
        oegrapheme.OERenderColorOverlap(fittable.GetCell(2, 3), overlap_disp)

        # 2D similarity
        if bond_glyph:
            sim_title = f"2D Graph Tanimoto = {sim_score:4.3f}"
            oedepict.OEDrawTextToCenter(
                fittable.GetHeaderCell(3), sim_title, score_font
            )
            _depict_molecule_similarity(
                fittable.GetCell(2, 4), fit_mol, ref_disp, bond_glyph
            )
Usage
See Download section to download the script.
> shapeoverlap2pdf --help
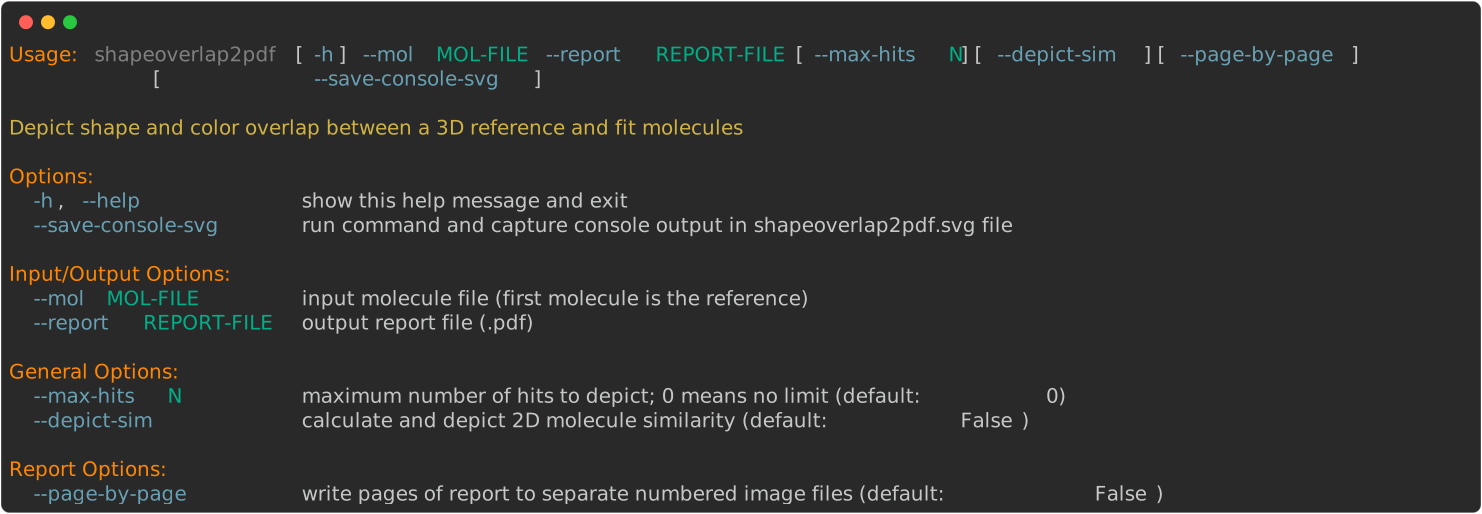
Running the above command will generate report.pdf
(see also Table 1) for input
4cox_rocs_hits.oeb.gz.
> shapeoverlap2pdf --mol 4cox_rocs_hits.oeb.gz --report report.pdf
Running the above command will generate report.pdf
(see also Table 2) for input
4cox_rocs_hits.oeb.gz.
> shapeoverlap2pdf --mol 4cox_rocs_hits.oeb.gz --report report.pdf --depict-sim
page 1 |
page 2 |
page 3 |
|
|
|
Discussion
The aim of this script is to represent 3D overlays, see example in Figure 1, in a more comprehensible 2D layout that enables fast comparison of hit molecules. See corresponding 2D depiction in Figure 3.
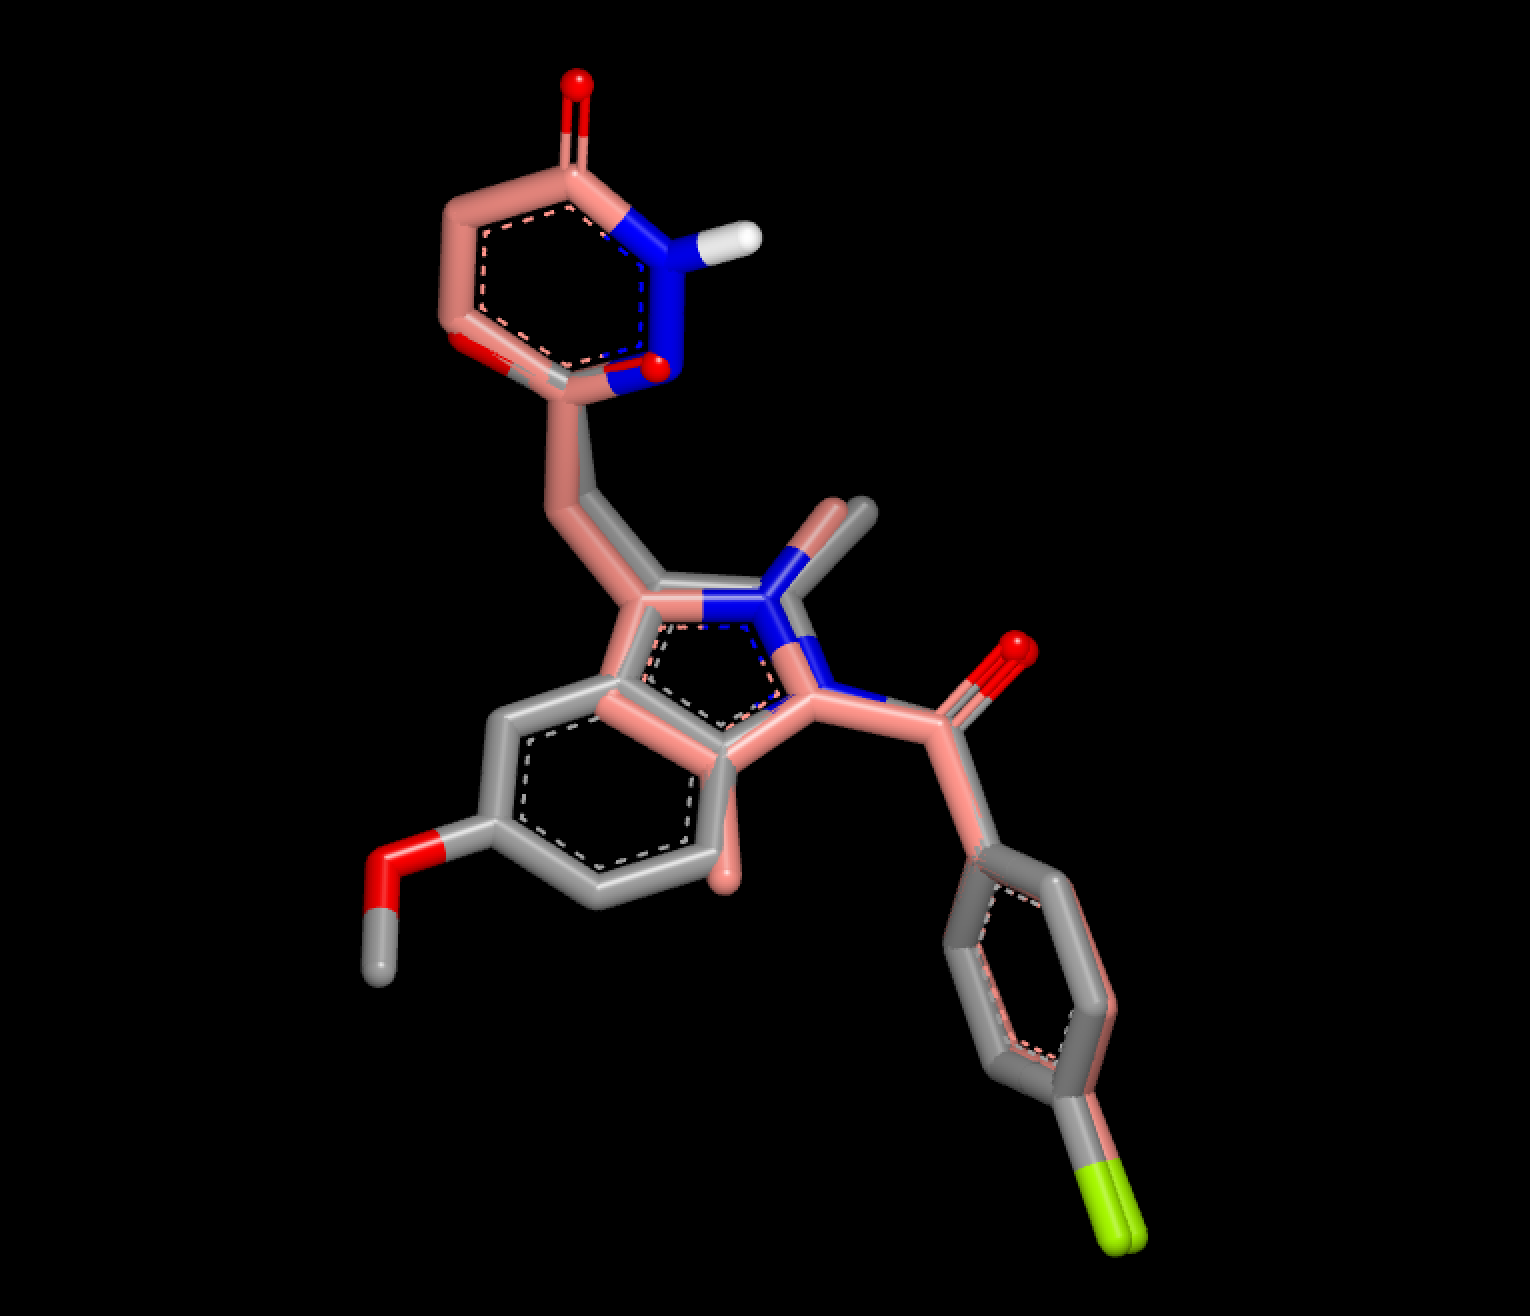
Figure 1. 3D overlay of the fit molecule (pink) into the reference (grey)
For each fit molecule, the corresponding query molecule is also depicted in the first column. The layout and orientation of the query molecule can vary since the generation of the 2D coordinates is driven by the 3D coordinates of the best matching conformation of the 3D query. See the layout difference of the query molecule in the 2nd and 3rd row on page 1 in Table 1.
See also
OEPrepareDepictionFrom3D function in the OEDepict TK manual
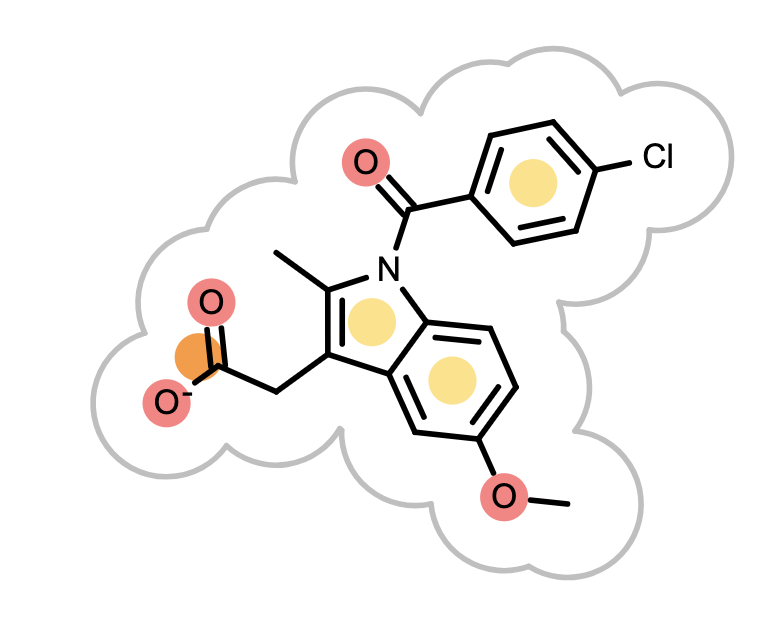
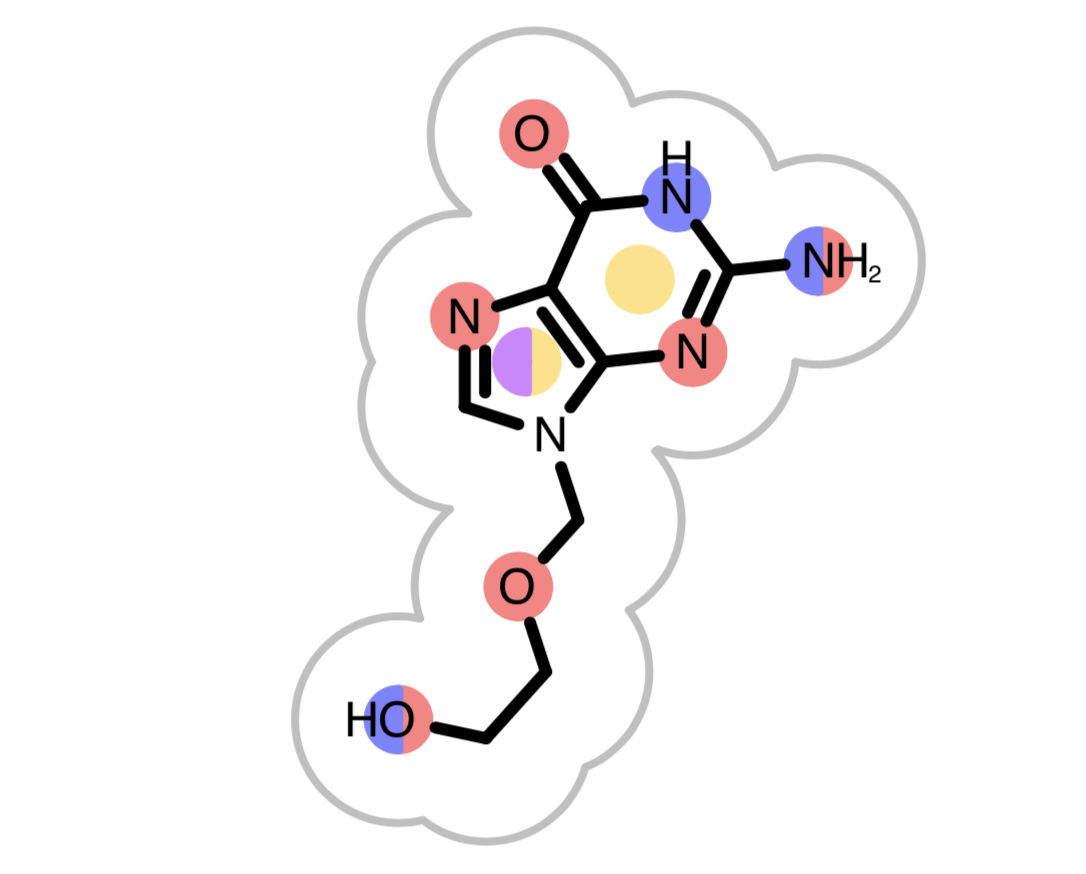
OEGrapheme TK uses colors to mark different chemical features detected in molecules.

Figure 2. Color-coding of chemical features
When the reference molecule is depicted, see examples in Table 3, colored circles indicate the detected chemical features on the molecular graph. If two color atoms occupy the same space in 3D, they are represented with adjacent half circles on the molecular graph.
|
|
When visualizing chemical feature matches between the reference and the fit molecule, each circle on the fit molecule (see the 3rd image from the left in Figure 3) corresponds to a color atom in the reference molecule. The color of the circle indicates the fitness of the color atom match in 3D. The lighter the color, the smaller the overlap between the reference and fit color atoms in 3D. Unfilled circles represent unmatched reference color atoms. If a good color atom match exists for a reference color atom in 3D, then the circle representing the color atom is positioned to the matching fit color atom in 2D.
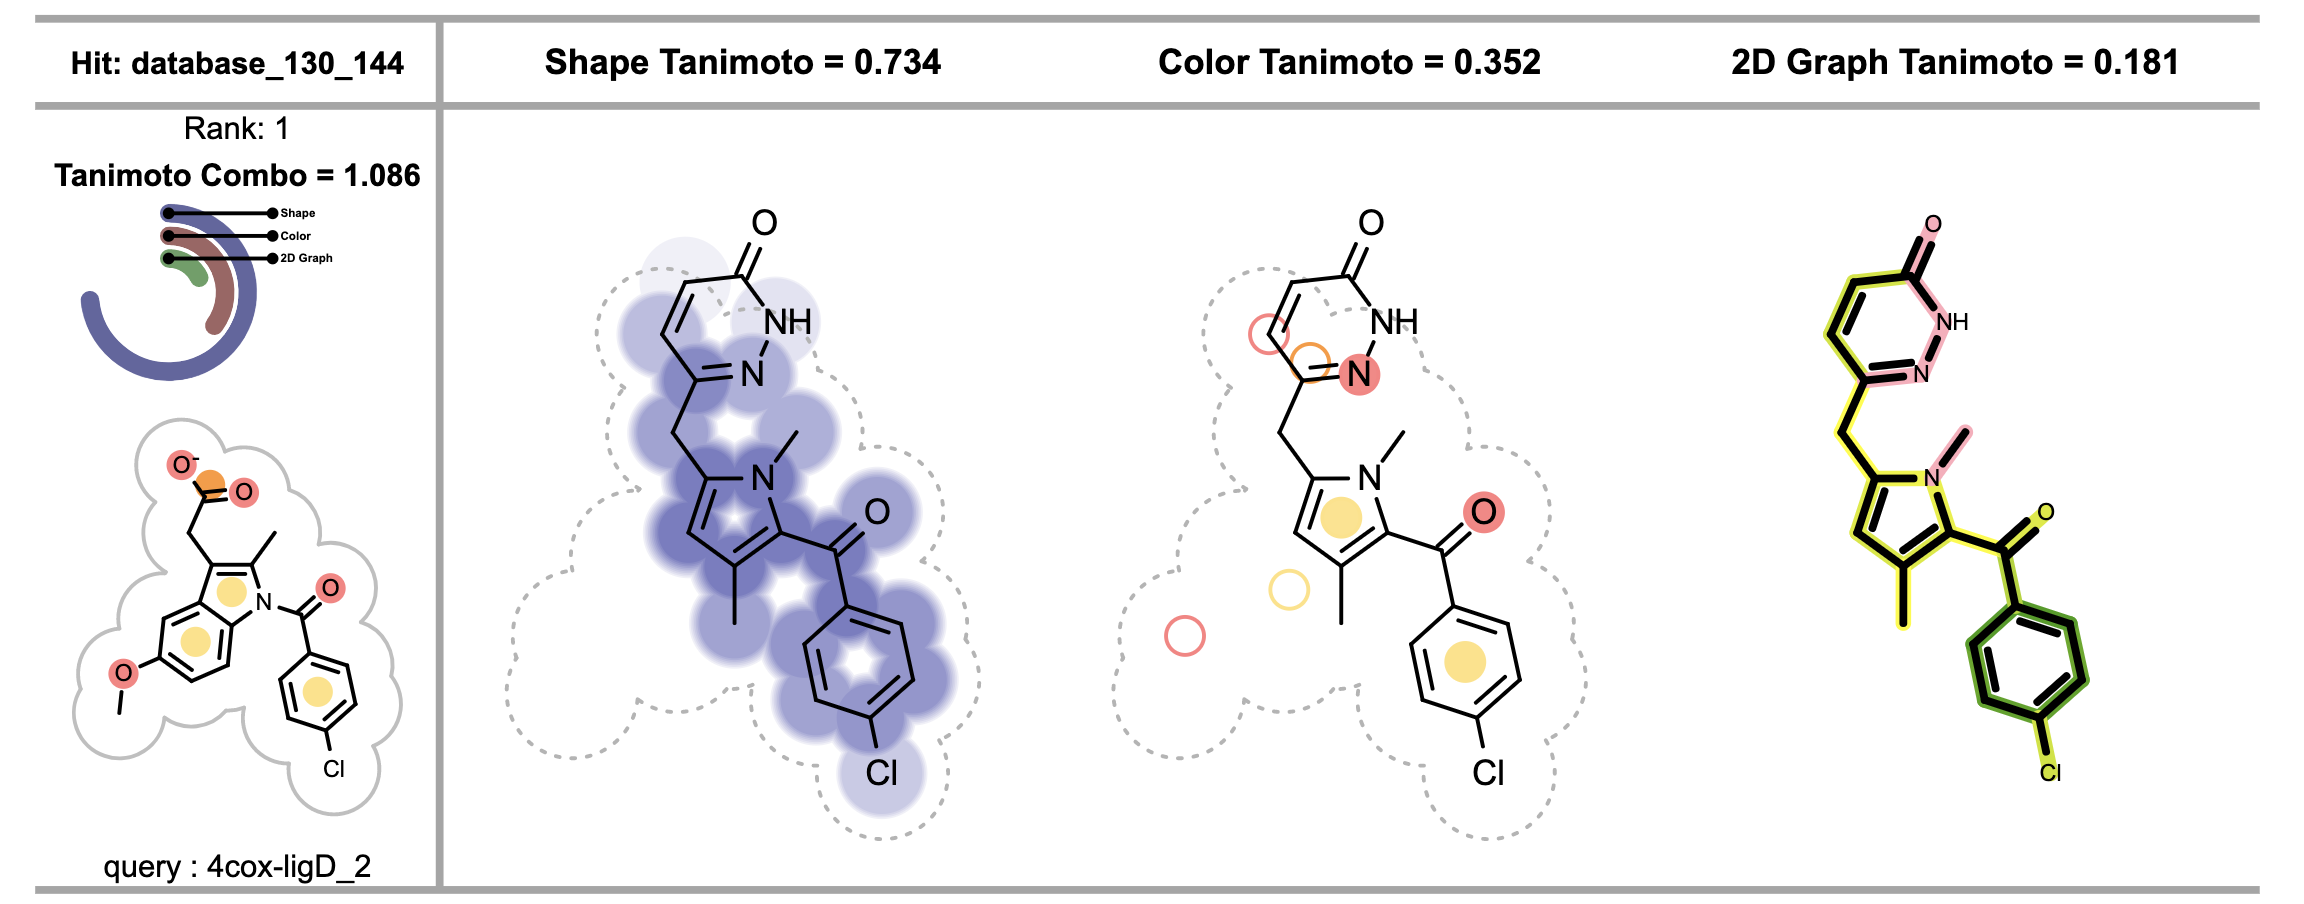
Figure 3. Visualizing shape, color and 2D similarity of the fit molecule to the corresponding reference (on the left)
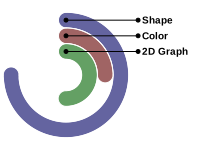
Figure 4. Visualizing scores
The shape overlap between the reference and the fit molecule (see the 2nd image from the left in Figure 3) is visualized by drawing circles underneath the molecule. A darker color indicates good 3D shape overlap between the reference and the fit molecules. Additionally, clashes between the molecular graph of the fit molecule and 2D molecule surface of the reference structure imply shape mismatch in 3D.
The 4th depiction in Figure 3 shows the 2D graph similarity between the reference and the fit molecule. See Depicting Molecule Similarity Based on Fingerprints recipe for more details about the calculation and interpretation of these images.
All scores (shape, color and 2D similarity) are in the range of [0.0, 1.0].
These scores are visualized in a radial graph for easy interpretation and
comparison.
See example in Figure 4.
See also in OEChem TK manual
Theory
Generic Data chapter
API
OELinearColorGradient class
See also in GraphSim TK manual
Theory
Fingerprint Generation chapter
Similarity Measures chapter
Fingerprint Overlap chapter
API
OEFingerPrint class
OEGetFPOverlap function
OEMakeFP function
OETanimoto function
See also in Shape TK manual
Theory
API
OEColorForceField class
See also in OEDepict TK manual
Theory
Molecule Depiction chapter
API
OE2DMolDisplay class
OE2DMolDisplayOptions class
OEDepictOrientation namespace
OEDrawTextToCenter function
OEImage class
OEImageTable class
OEImageTableOptions class
OEImageTableStyle namespace
OEPrepareDepiction function
OERenderMolecule function
OEReport class
OEReportOptions class
OEWriteReport function
See also in GraphemeTM TK manual
Theory
Annotating Atoms and Bonds chapter
API
OEAddGlyph function
OEBondGlyphBase abstract base class
OEColorForceFieldDisplay class
OEDrawColorForceFieldLegend function
OEDrawROCSScores function
OEGetMoleculeSurfaceScale function
OEPrepareAlignedDepictionFrom3D function
OERenderColorOverlap function
OERenderShapeOverlap function
OERenderColorOverlap function
OERenderShapeQuery function
OEShapeOverlapDisplay class
OEShapeOverlapDisplayStyle namespace
OEShapeQueryDisplay class