Molecule Layouts
The previous chapters described how to depict a single molecule in an image. This chapter provides examples for drawing multiple molecular diagrams into the same image.
Depicting Molecules in an Arbitrary Position
The OEImageFrame class provides a general framework to display a molecule in a specific region of the image by defining the following parameters:
the reference of the parent image
the width and height of the generated frame
the offset of the frame relative to the top-left corner of its parent (OE2DPoint)
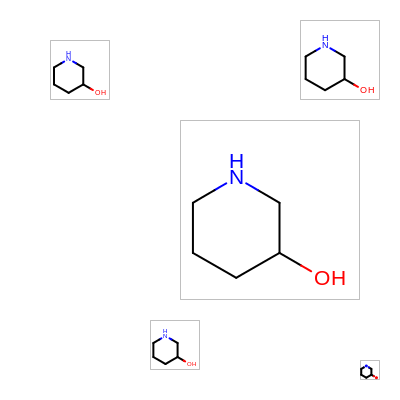
The Listing 1 examples generates an image where the same
molecule is depicted in different regions of the image.
The molecular diagrams are automatically resized in order to fit into
the specific frame, since the corresponding
OE2DMolDisplay object is constructed with the width
and height of the OEImageFrame object.
When the OERenderMolecule function is called, the
offset of the OEImageFrame object is added to the
coordinates stored in OE2DMolDisplay in order to
transfer the molecule into the specific region of the image.
The image created by Listing 1 is shown in
Figure: Example of using OEImageFrame.
Listing 1: Example of using OEImageFrame
void DrawMolecule(OEImageBase& image, const OEMolBase& mol,
                  double width, double height, const OE2DPoint& offset)
{
  OEImageFrame frame(image, width, height, offset);

  OEDrawBorder(frame, OELightGreyPen);

  OE2DMolDisplayOptions opts(width, height, OEScale::AutoScale);
  OE2DMolDisplay disp(mol, opts);
  bool clearbackground = true;
  OERenderMolecule(frame, disp, !clearbackground);
}

int main()
{
  OEImage image(400, 400);

  OEGraphMol mol;
  OESmilesToMol(mol, "C1CC(O)CNC1");
  OEPrepareDepiction(mol);

  DrawMolecule(image, mol,  60,  60, OE2DPoint(50.0,   40.0));
  DrawMolecule(image, mol, 180, 180, OE2DPoint(180.0, 120.0));
  DrawMolecule(image, mol,  80,  80, OE2DPoint(300.0,  20.0));
  DrawMolecule(image, mol,  50,  50, OE2DPoint(150.0, 320.0));
  DrawMolecule(image, mol,  20,  20, OE2DPoint(360.0, 360.0));

  OEWriteImage("ImageFrame.png", image);
  return 0;
}
Example of using OEImageFrame
See also
OEImageFrame class
OEDrawBorderfunctionOERenderMoleculefunctionOEWriteImagefunction
Depicting Molecules in a Grid
The OEImageGrid class allows molecules to be aligned into
rows and columns.
After generating an OEImageGrid object by specifying its number
of rows and columns, the cells of the grid can be accessed (from left to right, top
to bottom order) by calling the OEImageGrid::GetCells method.
The image created by Listing 2 is shown in
Figure: Example of using OEImageGrid.
Listing 2: Example of using OEImageGrid
int main()
{
  vector<string> smiles;
  smiles.push_back("C1CC(C)CCC1");
  smiles.push_back("C1CC(O)CCC1");
  smiles.push_back("C1CC(Cl)CCC1");

  OEImage image(200, 200);

  const auto rows = 2u;
  const auto cols = 2u;
  OEImageGrid grid(image, rows, cols);

  OE2DMolDisplayOptions opts(grid.GetCellWidth(), grid.GetCellHeight(), OEScale::AutoScale);

  OEIter<OEImageBase> cell = grid.GetCells();
  for (auto s = 0u; s != smiles.size() && (bool)cell; ++s, ++cell)
  {
    OEGraphMol mol;
    OESmilesToMol(mol, smiles[s]);
    OEPrepareDepiction(mol);

    OE2DMolDisplay disp(mol, opts);
    OERenderMolecule(cell, disp);
  }
  OEWriteImage("ImageGridSimple.png", image);
  return 0;
}
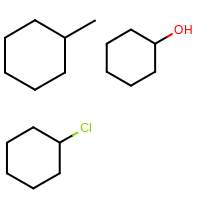
Example of using OEImageGrid
See also
OEImageGrid class
When an OE2DMolDisplay object is initialized, the dimensions of the depicted molecule is controlled by the width, height and scale parameters of the OE2DMolDisplayOptions object.
When only one molecule is depicted then auto scaling of this molecule is preferred
(i.e. scaling the molecule in order to maximally fit it to the given dimensions).
However, when more that one molecule, that are quite different in
sizes, are depicted next to each other, auto scaling of each molecule can be
visually misleading because it emphasizes molecules with greater scaling factors.
See example in Figure: Example of using OEImageGrid
that is generated by Listing 3.
Listing 3: Example of auto scaling of molecules
int main()
{
  const vector<string> smiles = {"c1ccccc1", "c1cccc2c1ccnc2", "c1ccc2c(c1)cc3ccccc3n2"};

  OEImage image(400, 200);

  const auto rows = 1u;
  const auto cols = 3u;
  OEImageGrid grid(image, rows, cols);

  OE2DMolDisplayOptions opts(grid.GetCellWidth(), grid.GetCellHeight(), OEScale::AutoScale);

  auto s = 0u;
  for (OEIter<OEImageBase> ci = grid.GetCells(); (bool)ci && s < smiles.size(); ++ci, ++s)
  {
    OEGraphMol mol;
    OESmilesToMol(mol, smiles[s]);
    OEPrepareDepiction(mol);

    OE2DMolDisplay disp(mol, opts);
    OERenderMolecule(ci, disp);
  }
  OEWriteImage("ImageGridAutoScale.png", image);
  return 0;
}
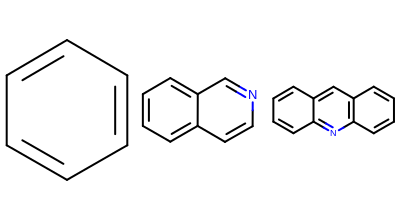
Example of auto scaling of molecules
See also
The following example (Listing 4) shows
how to ensure that all molecules are depicted using the same scaling
factor.
After initializing the molecules, the minimum scaling factor is
determined by looping over the molecules being depicted and calling
the OEGetMoleculeScale function.
This function returns the scaling factor of the molecule considering
the depiction options stored in the given
OE2DMolDisplayOptions object.
After determining the minimum scaling factor, the molecules are
rendered to the cells of the grid by using this fixed scaling factor.
The image created by Listing 4 is shown in
Figure: Example of using OEImageGrid.
Listing 4: Example of identical scaling of molecules
int main()
{
  const vector<string> smiles = {"c1ccccc1", "c1cccc2c1ccnc2", "c1ccc2c(c1)cc3ccccc3n2"};

  vector<OEGraphMol> molvector;
  for (const auto& smi : smiles)
  {
    OEGraphMol mol;
    OESmilesToMol(mol, smi);
    OEPrepareDepiction(mol);
    molvector.push_back(OEGraphMol(mol));
  }

  OEImage image(400, 200);

  const auto rows = 1;
  const auto cols = 3;
  OEImageGrid grid(image, rows, cols);

  OE2DMolDisplayOptions opts(grid.GetCellWidth(), grid.GetCellHeight(), OEScale::AutoScale);

  double minscale = numeric_limits<double>::max();
  for (const auto& mol : molvector)
    minscale = std::min(minscale, OEGetMoleculeScale(mol, opts));
  opts.SetScale(minscale);

  OEIter<OEImageBase> ci = grid.GetCells();
  for (auto m = 0u; (bool)ci && m < molvector.size(); ++ci, ++m)
  {
    OE2DMolDisplay disp(molvector[m], opts);
    OERenderMolecule(ci, disp);
  }

  OEWriteImage("ImageGridFixedScale.png", image);
  return 0;
}
Example of identical scaling of molecules
See also
OEImageGrid::GetCellHeightmethodOEImageGrid::GetCellWidthmethod
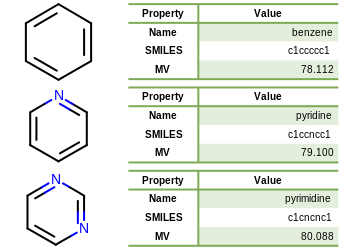
Depicting Molecules in a Table
The following example demonstrates how to depict molecules and display data alongside them by using the OEImageTable. The individual cells of an OEImageTable object can be accessed by calling the any of the following methods:
These methods return an image (OEImageBase) on which
molecule can be drawn or text can be displayed using the
OEImageTable::DrawText method.
The image created by Listing 5 is shown in
Figure: Example of depicting molecules and data using image table.
Listing 5: Example of depicting molecules and data using image table
int main()
{
  const vector<string> smiles = {"C1CC(C)CCC1", "C1CC(O)CCC1", "C1CC(Cl)CCC1"};

  const auto imagewidth = 350u;
  const auto imageheight = 250u;
  OEImage image(imagewidth, imageheight);

  const auto mainrows = 3u;
  const auto maincols = 2u;
  OEImageTableOptions maintableopts(mainrows, maincols, OEImageTableStyle::NoStyle);
  maintableopts.SetHeader(false);
  vector<unsigned int> colwidths = {10u, 20u};
  maintableopts.SetColumnWidths(colwidths);
  OEImageTable maintable(image, maintableopts);

  const auto datarows = 4u;
  const auto datacols = 2u;
  OEImageTableOptions datatableopts(datarows, datacols, OEImageTableStyle::LightGreen);
  datatableopts.SetStubColumn(true);
  datatableopts.SetMargins(5.0);
  datatableopts.SetColumnWidths(colwidths);

  for (auto r = 0u; r < smiles.size() && r < maintable.NumRows(); ++r)
  {
    // depict molecule in first column
    OEImageBase* cell = maintable.GetBodyCell(r + 1, 1);

    OE2DMolDisplayOptions opts(cell->GetWidth(), cell->GetHeight(), OEScale::AutoScale);
    opts.SetTitleLocation(OETitleLocation::Hidden);

    OEGraphMol mol;
    OESmilesToMol(mol, smiles[r]);
    OEPrepareDepiction(mol);

    OE2DMolDisplay disp(mol, opts);
    OERenderMolecule(*cell, disp);

    // depicting data in table
    cell = maintable.GetBodyCell(r + 1u, 2u);

    OEImageTable datatable(*cell, datatableopts);

    datatable.DrawText(datatable.GetHeaderCell(1u, false), "Property");
    datatable.DrawText(datatable.GetHeaderCell(1u), "Value");

    datatable.DrawText(datatable.GetStubColumnCell(1u), "Name");
    datatable.DrawText(datatable.GetBodyCell(1u, 1u), mol.GetTitle());

    datatable.DrawText(datatable.GetStubColumnCell(2u), "SMILES");
    datatable.DrawText(datatable.GetBodyCell(2u, 1u), OEMolToSmiles(mol));

    datatable.DrawText(datatable.GetStubColumnCell(3u), "MV");
    const string mwdata = OENumberToString(OECalculateMolecularWeight(mol), 'f', 3);
    datatable.DrawText(datatable.GetBodyCell(3u, 1u), mwdata);
  }
  OEWriteImage("ImageTable.png", image);

  return 0;
}
Example of depicting molecules and data using image table