Depicting Molecules In a Grid
A program that converts molecular structures into an image with a grid layout. By default the input molecules are depicted in a 3x2 grid.
Command Line Interface
A description of the command line interface can be obtained by executing the program with the –help argument.
prompt> python mols2img.py --help
will generate the following output:
Simple parameter list
 -height : Height of output image
 -width : Width of output image

 image grid options :
   -cols : Number of columns
   -rows : Number of rows

 input/output options :
   -in : Input filename(s)
   -out : Output filename

 molecule display options :
   -aromstyle : Aromatic ring display style
   -atomcolor : Atom coloring style
   -atomlabelfontscale : Atom label font scale
   -atomprop : Atom property display
   -atomstereostyle : Atom stereo display style
   -bondcolor : Bond coloring style
   -bondprop : Bond property display
   -bondstereostyle : Bond stereo display style
   -hydrstyle : Hydrogen display style
   -linewidth : Default bond line width
   -protgroupdisp : Protective group display style
   -scale : Scaling of the depicted molecule
   -superdisp : Super atom display style
   -titleloc : Location of the molecule title

 prepare depiction options :
   -clearcoords : Clear and regenerate 2D coordinates of molecule(s)
   -orientation : Set the preferred orientation of 2D coordinates
   -suppressH : Suppress explicit hydrogens of molecule(s)
Code
Download code
See also
Molecule Layouts chapter
OEConfigureImageWidthfunctionOEConfigureImageHeightfunctionOEConfigureImageGridParamsfunctionOEConfigurePrepareDepictionOptionsfunctionOEConfigure2DMolDisplayOptionsfunctionOEGetImageWidthandOEGetImageHeightfunctionsOEGetImageGridNumRowsandOEGetImageGridNumColumnsfunctionsOEImageGrid class
OESetupPrepareDepictionOptionsfunctionOE2DMolDisplayOptions class
OESetup2DMolDisplayOptionsfunctionOEPrepareDepictionfunctionOERenderMoleculefunctionOEWriteImagefunction
Examples
prompt> python mols2img.py -in amino.ism -out image.png
will generate the image shown in Figure: Example of using the program with default parameters.
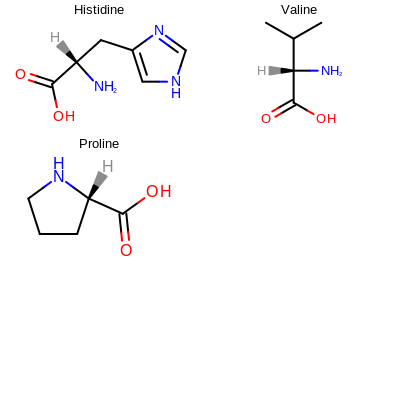
Example of using the program with default parameters
Note
By default the program depicts molecules in a 3x2 grid
prompt> python mols2img.py -in amino.ism -out image.png -rows 2 -cols 3
will generate the image shown in Figure: Example of using the program with user-defined number of rows and columns.
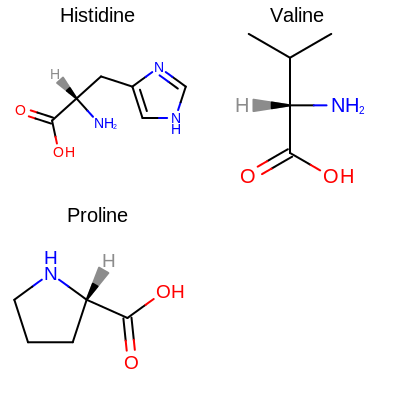
Example of using the program with user-defined number of rows and columns
prompt> python mols2img.py -in amino.ism -out image.png -rows 2 -cols 2 -titleloc Bottom
will generate the image shown in Figure: Example of using the program with molecule titles displayed at the bottom.
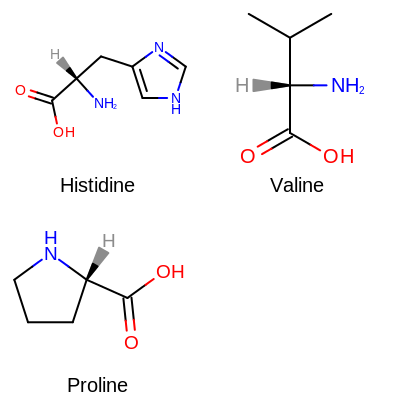
Example of using the program with molecule titles displayed at the bottom
See also
Depicting Molecules in a Grid section