Drawing Fingerprint Score Histogram
Problem
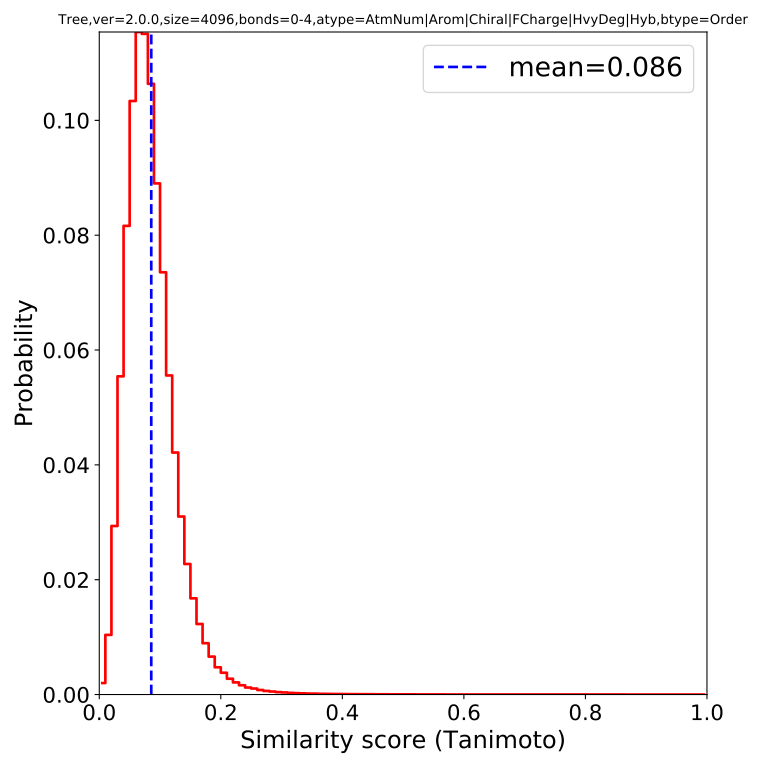
You want to plot a histogram of molecular similarity scores for a dataset (see Figure 1).
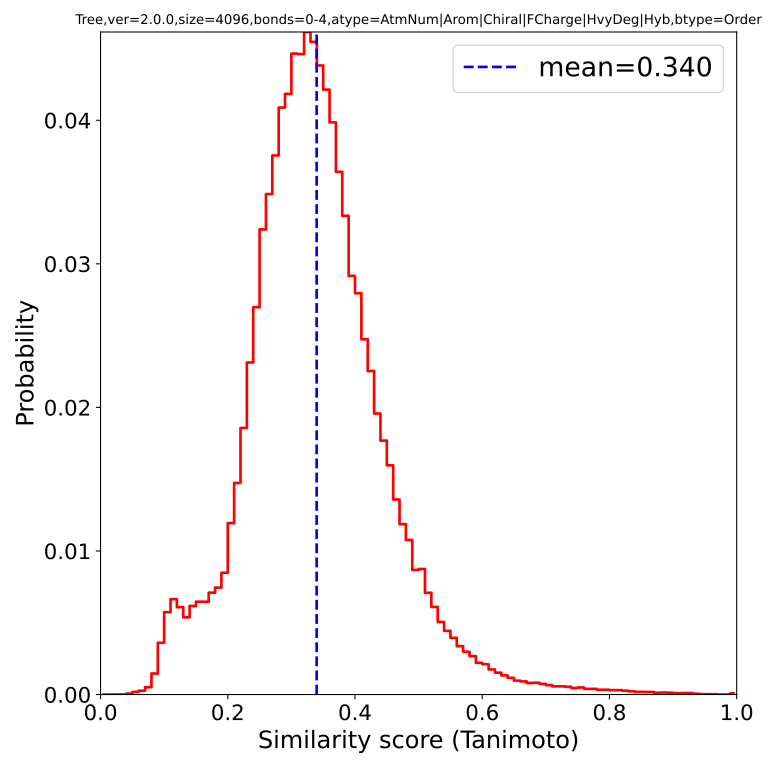
Figure 1. Similarity scores of molecules with the same activity class
Ingredients
|
Difficulty level
🌶️ 🌶️
Download
Source Code
fphist2img
#!/usr/bin/env python3
# (C) 2026 Cadence Design Systems, Inc. (Cadence)
# All rights reserved.
# TERMS FOR USE OF SAMPLE CODE The software below ("Sample Code") is
# provided to current licensees or subscribers of Cadence products or
# SaaS offerings (each a "Customer").
# Customer is hereby permitted to use, copy, and modify the Sample Code,
# subject to these terms. Cadence claims no rights to Customer's
# modifications. Modification of Sample Code is at Customer's sole and
# exclusive risk. Sample Code may require Customer to have a then
# current license or subscription to the applicable Cadence offering.
# THE SAMPLE CODE IS PROVIDED "AS IS", WITHOUT WARRANTY OF ANY KIND,
# EXPRESS OR IMPLIED.  OPENEYE DISCLAIMS ALL WARRANTIES, INCLUDING, BUT
# NOT LIMITED TO, WARRANTIES OF MERCHANTABILITY, FITNESS FOR A
# PARTICULAR PURPOSE AND NONINFRINGEMENT. In no event shall Cadence be
# liable for any damages or liability in connection with the Sample Code
# or its use.

"""Plot the histogram of fingerprint similarity scores."""

import argparse
import os
import sys
from pathlib import Path

import matplotlib.pyplot as plt
from openeye import oechem, oedepict, oegraphsim
from rich.console import Console
from rich_argparse import HelpPreviewAction, RichHelpFormatter

__SCRIPT_NAME__ = Path(__file__).absolute().stem
__SCRIPT_DESC__ = "Plot the histogram of fingerprint similarity scores."
__SCRIPT_TOOLKITS__ = ["oechem", "oegraphsim"]


def parse_args() -> argparse.Namespace:
    """Parse command-line arguments."""
    parser = argparse.ArgumentParser(
        add_help=True,
        formatter_class=RichHelpFormatter,
        description="[yellow]" + __SCRIPT_DESC__ + "[/yellow]",
    )

    input_group = parser.add_argument_group("Input options")
    input_group.add_argument(
        "--fp-database",
        type=str,
        required=True,
        metavar="FP-DATABASE-FILE",
        help="input binary fingerprint database file (.fpbin)",
    )

    output_group = parser.add_argument_group("Output options")
    output_group.add_argument(
        "--image",
        type=str,
        required=True,
        metavar="IMAGE-FILE",
        help="output image file (e.g. PNG, PDF, SVG)",
    )

    hist_group = parser.add_argument_group("Histogram options")
    hist_group.add_argument(
        "--num-bins",
        type=int,
        default=100,
        metavar="N",
        help="number of bins in the histogram (default: %(default)s)",
    )
    hist_group.add_argument(
        "--sim-func",
        type=str,
        default="Tanimoto",
        choices=["Tanimoto", "Cosine", "Dice", "Tversky", "Manhattan", "Euclid"],
        help="similarity function (default: %(default)s)",
    )
    hist_group.add_argument(
        "--mem-type",
        type=str,
        default="in-memory",
        choices=["in-memory", "on-disk"],
        help="database memory type (default: %(default)s)",
    )

    parser.add_argument("--help-image", action=HelpPreviewAction)
    return parser.parse_args()


def main() -> int:
    """Plot the histogram of fingerprint similarity scores."""
    args = parse_args()
    console = Console()

    _check_image_file(args)

    # initialize database
    timer = oechem.OEWallTimer()
    timer.Start()

    mem_type = _get_memory_type(args.mem_type)
    fp_database = oegraphsim.OEFastFPDatabase(args.fp_database, mem_type)
    if not fp_database.IsValid():
        oechem.OEThrow.Fatal("Cannot open fingerprint database file!")

    console.print(f"{timer.Elapsed():5.2f} sec to initialize database")

    fp_type = fp_database.GetFPTypeBase()
    console.print(f"Using fingerprint type {fp_type.GetFPTypeString()}")

    opts = oegraphsim.OEFPDatabaseOptions()
    sim_func = _get_sim_func(args.sim_func)
    opts.SetSimFunc(sim_func)

    plt.figure(figsize=(8, 8), dpi=80)

    plot_similarity_score_histogram(fp_database, opts, args.num_bins)

    plt.tight_layout()
    plt.savefig(args.image)

    console.print(f"Image written to {args.image}")
    return os.EX_OK


def plot_similarity_score_histogram(
    fp_database: oegraphsim.OEFastFPDatabase,
    opts: oegraphsim.OEFPDatabaseOptions,
    num_bins: int,
) -> None:
    """
    Plot a similarity score histogram from a fingerprint database.

    Computes the pairwise similarity score distribution for all fingerprints
    in the database and renders it as a density plot with the mean marked.
    """
    num_fps = fp_database.NumFingerPrints()
    fp_type = fp_database.GetFPTypeBase()
    mem_type_str = fp_database.GetMemoryTypeString()
    sim_func_str = oegraphsim.OEGetSimilarityMeasureName(opts.GetSimFunc())

    # get histogram
    timer = oechem.OEWallTimer()
    timer.Start()
    hist = fp_database.GetHistogram(opts, num_bins)
    oechem.OEThrow.Info(
        f"{timer.Elapsed():5.2f} sec to get histogram for "
        f"{num_fps} fingerprints ({mem_type_str})"
    )

    # plot histogram
    plt.xlim(hist.GetMin(), hist.GetMax())

    centers = list(hist.GetBinCenters())
    densities = list(hist.GetDensity())

    plt.plot(centers, densities, "r", linewidth=2, drawstyle="steps-mid")
    plt.axis([hist.GetMin(), hist.GetMax(), 0.0, max(densities)])

    plt.title(fp_type.GetFPTypeString(), fontsize=10)
    plt.ylabel("Probability", fontsize=18)
    plt.xlabel(f"Similarity score ({sim_func_str})", fontsize=18)
    plt.yticks(fontsize=16)
    plt.xticks(fontsize=16)

    mean = hist.Mean()
    plt.plot(
        [mean, mean],
        [0.0, 1.0],
        linestyle="dashed",
        color="blue",
        linewidth=2,
        label=f"mean={mean:.3f}",
    )

    plt.legend(loc="upper right", fontsize=20)


def _is_supported_image_type(ext: str) -> bool:
    """Check if the file extension is a supported matplotlib image type."""
    fig = plt.figure()
    supported = ext[1:] in fig.canvas.get_supported_filetypes()
    plt.close(fig)
    return supported


def _get_memory_type(mem_type_str: str) -> int:
    """Return the OEFPDatabaseMemoryType constant for the given string."""
    if mem_type_str == "on-disk":
        return oegraphsim.OEFastFPDatabaseMemoryType_MemoryMapped
    return oegraphsim.OEFastFPDatabaseMemoryType_InMemory


def _get_sim_func(sim_func_str: str) -> int:
    """Return the OESimMeasure constant for the given string."""
    sim_function_consts = {
        "Tanimoto": oegraphsim.OESimMeasure_Tanimoto,
        "Cosine": oegraphsim.OESimMeasure_Cosine,
        "Dice": oegraphsim.OESimMeasure_Dice,
        "Tversky": oegraphsim.OESimMeasure_Tversky,
        "Manhattan": oegraphsim.OESimMeasure_Manhattan,
        "Euclid": oegraphsim.OESimMeasure_Euclid,
    }
    return sim_function_consts[sim_func_str]


def _check_image_file(args: argparse.Namespace) -> None:
    # script will terminate if there is some issues
    if not args.image:
        # image will be displayed on the screen
        return
    ext = Path(args.image).suffix[1:].upper()
    if not oedepict.OEIsRegisteredImageFile(ext):
        oechem.OEThrow.Fatal("Unknown image output type!")

    ofs = oechem.oeofstream()
    if not ofs.open(args.image):
        oechem.OEThrow.Fatal("Cannot open output image file!")


setattr(main, "__SCRIPT_NAME__", __SCRIPT_NAME__)
setattr(main, "__SCRIPT_DESC__", __SCRIPT_DESC__)
setattr(main, "__SCRIPT_TOOLKITS__", __SCRIPT_TOOLKITS__)

if __name__ == "__main__":
    sys.exit(main())
Solution
The plot_similarity_score_histogram function shows how to calculate the similarity score histogram by calling the OEFastFPDatabase.GetHistogram method. The OEFastFPDatabase.GetHistogram method calculates the similarity scores for all pairs of fingerprints stored in the fingerprint database and returns the scores in an OEFPHistogram object. The plot is then initialized by iterating over the bins of the OEFPHistogram object. Finally, the average similarity score along with the corresponding legend is plotted.
Note
For symmetric similarity measures, the histogram will only contain upper-triangular similarity scores (excluding the diagonal). In the case of the asymmetric OETversky similarity measure, the histogram for the whole NxN matrix is returned.
 1def plot_similarity_score_histogram(
 2    fp_database: oegraphsim.OEFastFPDatabase,
 3    opts: oegraphsim.OEFPDatabaseOptions,
 4    num_bins: int,
 5) -> None:
 6    """
 7    Plot a similarity score histogram from a fingerprint database.
 8
 9    Computes the pairwise similarity score distribution for all fingerprints
10    in the database and renders it as a density plot with the mean marked.
11    """
12    num_fps = fp_database.NumFingerPrints()
13    fp_type = fp_database.GetFPTypeBase()
14    mem_type_str = fp_database.GetMemoryTypeString()
15    sim_func_str = oegraphsim.OEGetSimilarityMeasureName(opts.GetSimFunc())
16
17    # get histogram
18    timer = oechem.OEWallTimer()
19    timer.Start()
20    hist = fp_database.GetHistogram(opts, num_bins)
21    oechem.OEThrow.Info(
22        f"{timer.Elapsed():5.2f} sec to get histogram for "
23        f"{num_fps} fingerprints ({mem_type_str})"
24    )
25
26    # plot histogram
27    plt.xlim(hist.GetMin(), hist.GetMax())
28
29    centers = list(hist.GetBinCenters())
30    densities = list(hist.GetDensity())
31
32    plt.plot(centers, densities, "r", linewidth=2, drawstyle="steps-mid")
33    plt.axis([hist.GetMin(), hist.GetMax(), 0.0, max(densities)])
34
35    plt.title(fp_type.GetFPTypeString(), fontsize=10)
36    plt.ylabel("Probability", fontsize=18)
37    plt.xlabel(f"Similarity score ({sim_func_str})", fontsize=18)
38    plt.yticks(fontsize=16)
39    plt.xticks(fontsize=16)
40
41    mean = hist.Mean()
42    plt.plot(
43        [mean, mean],
44        [0.0, 1.0],
45        linestyle="dashed",
46        color="blue",
47        linewidth=2,
48        label=f"mean={mean:.3f}",
49    )
50
51    plt.legend(loc="upper right", fontsize=20)
Usage
See Download section to download the script.
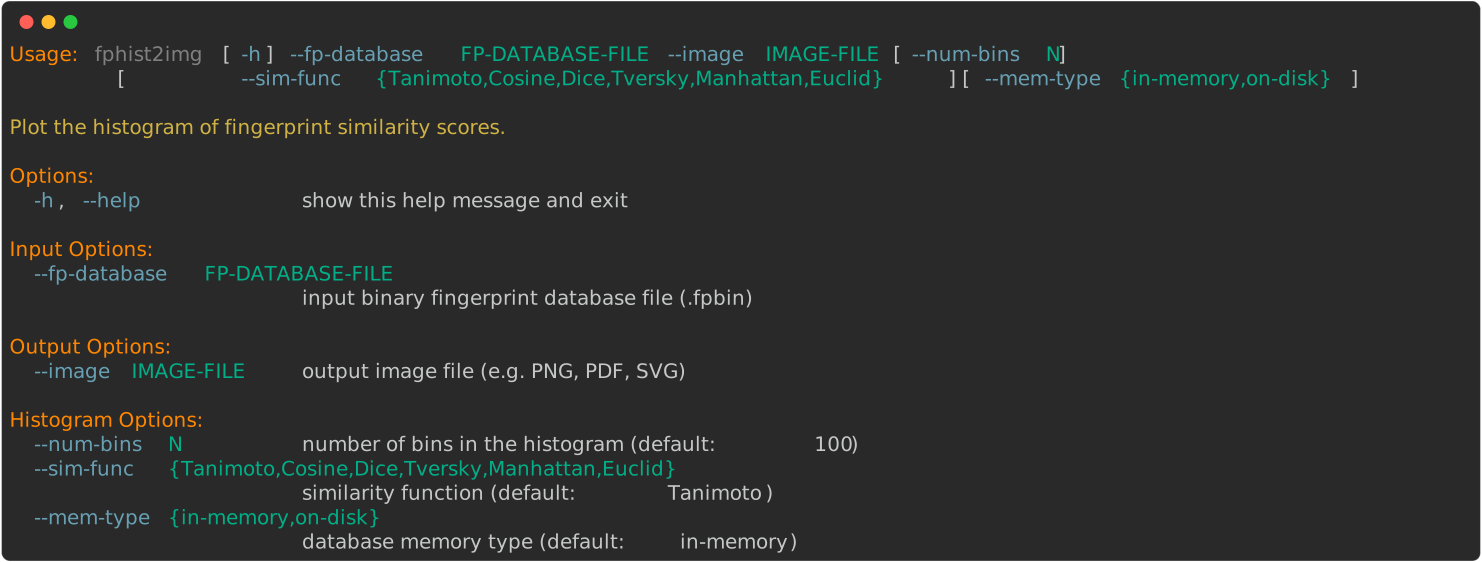
> fphist2img --help
First, run the makefastfp script (described in the Rapid Similarity Searching of Large Molecule Files recipe)
with drugs.sdf supporting data
to generate a binary fingerprint file.
Then the fphist2img script can be used to plot shown in Figure 1).
> fphist2img --fp-database drugs-tree.fpbin --sim-func Tanimoto --image drugs-tree-tanimoto.svg
Discussion
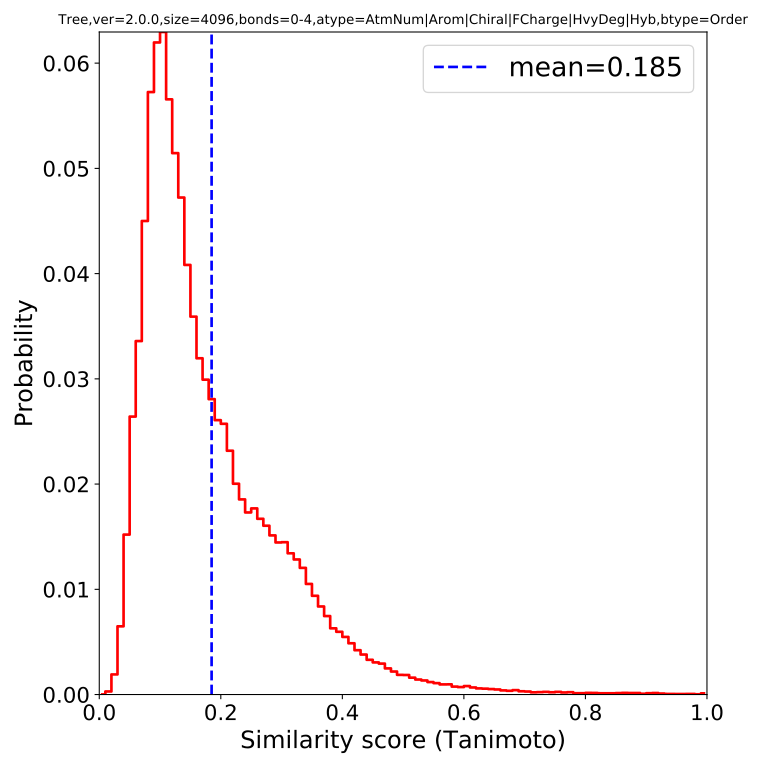
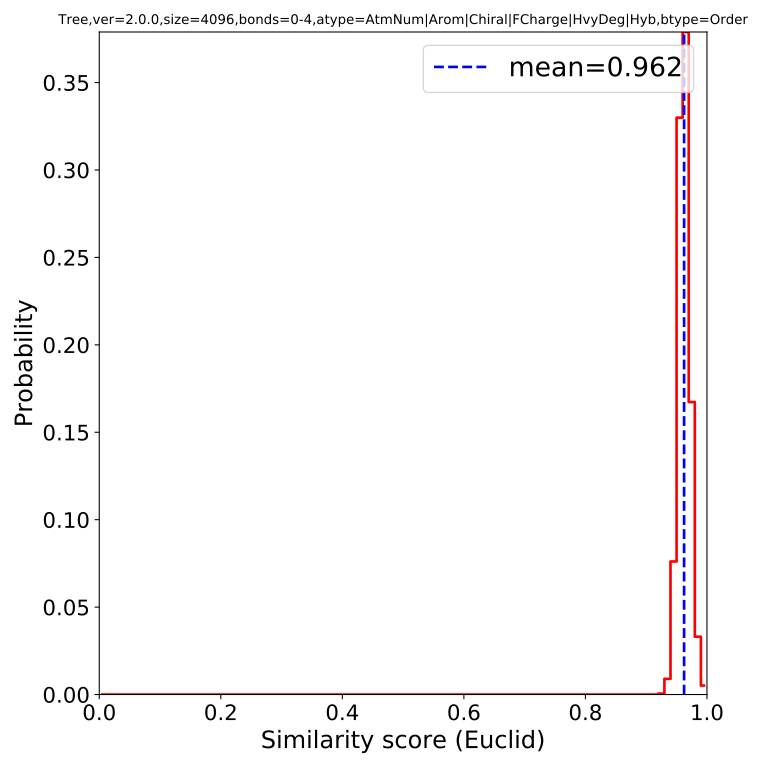
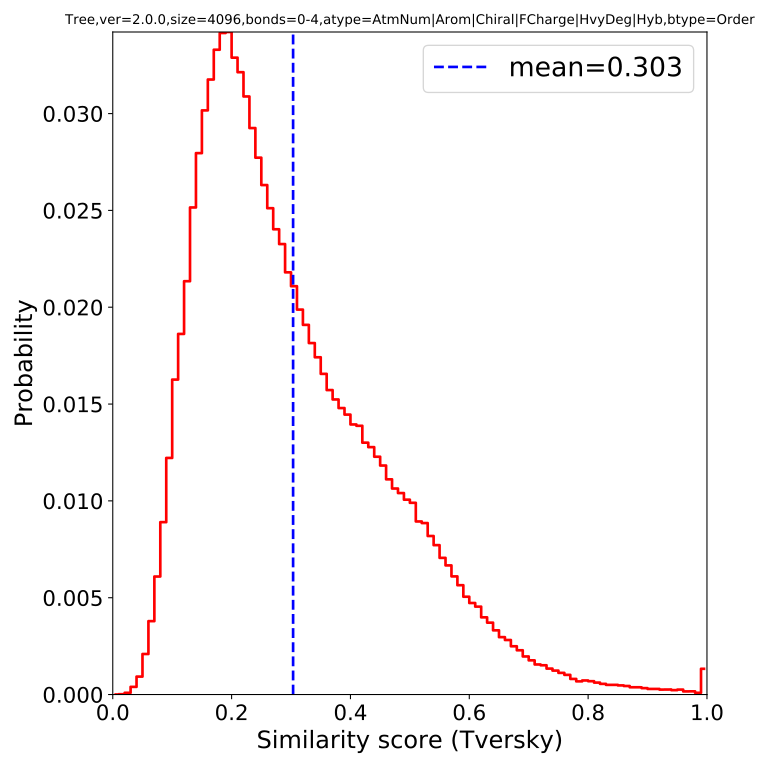
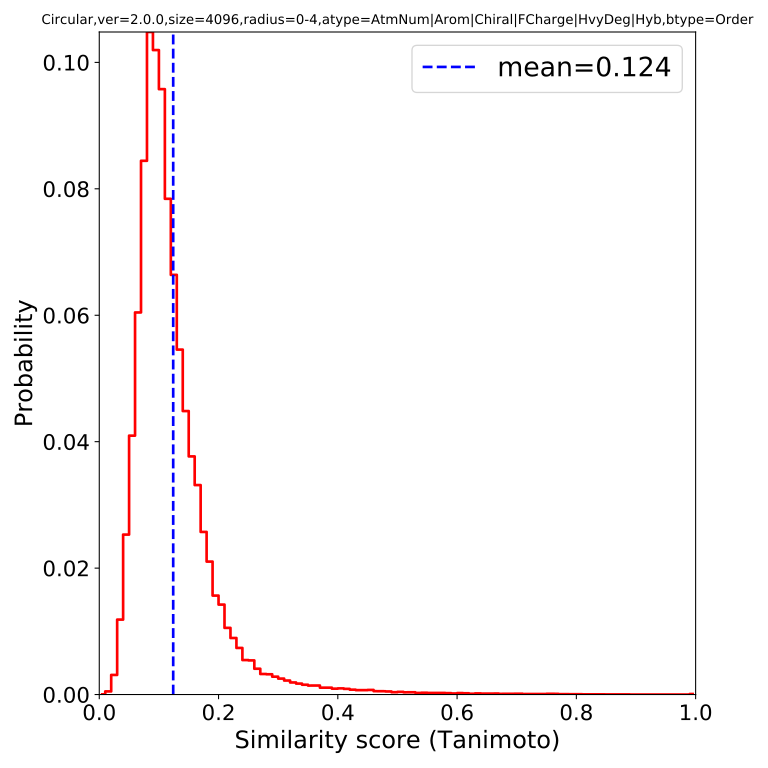
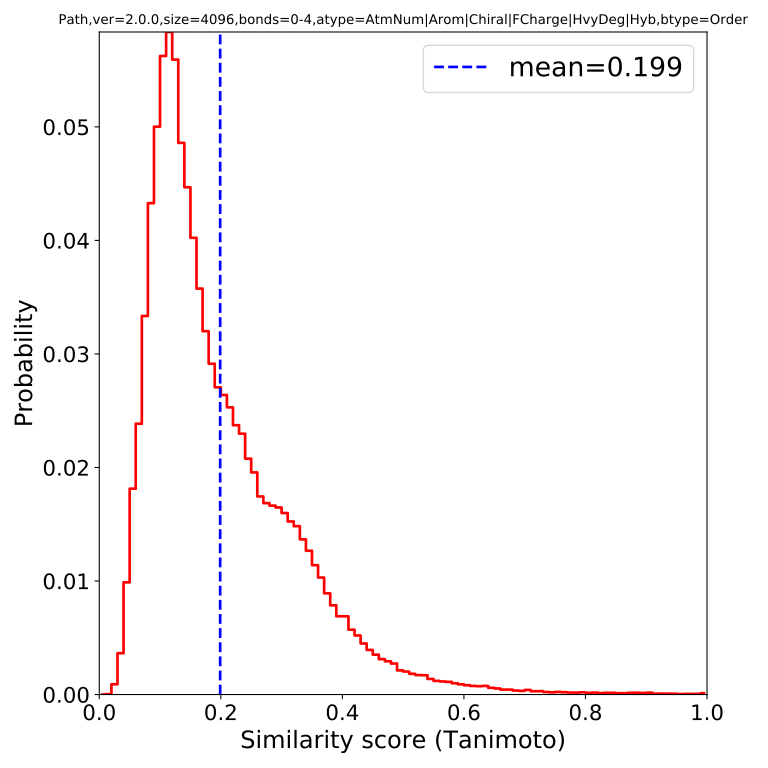
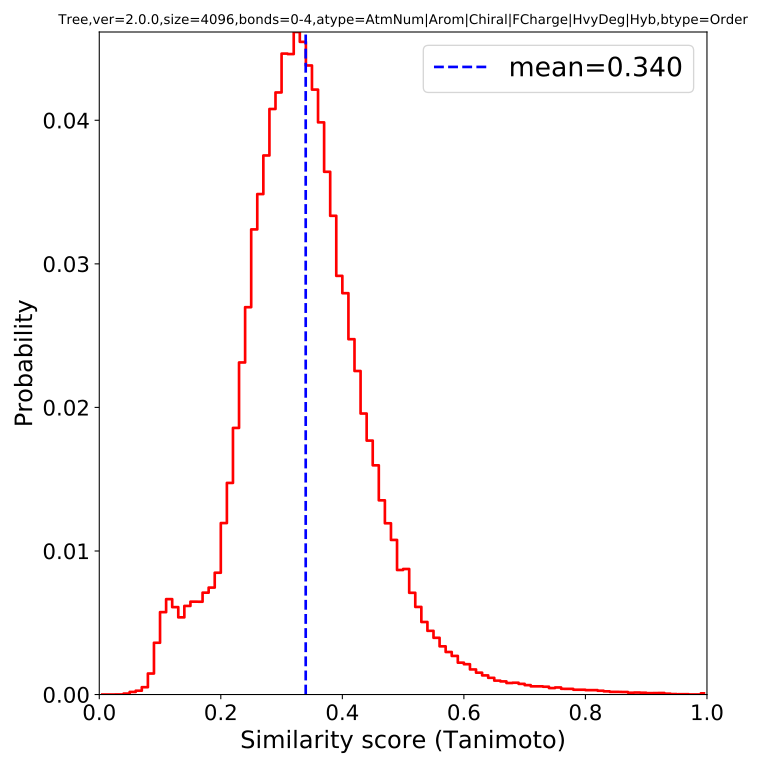
When using GraphSim TK to identify molecules that are similar to a query molecule, no default cutoff value is given. The reason is that the score distribution depends heavily on not only the similarity measure used to calculate the scores (see Table 1) but also the fingerprint type (see Table 2).
Tanimoto |
Euclid |
Tversky |
|
|
|
Tree |
Circular |
Path |
|
|
|
|
Plotting the similarity score distribution of molecules that belong to the same activity class as the query, as well as molecules with different activity classes, can give an idea of what a reasonable cutoff value would be.
molecules with same activity class |
molecules with different activity classes |
|
|
Performance
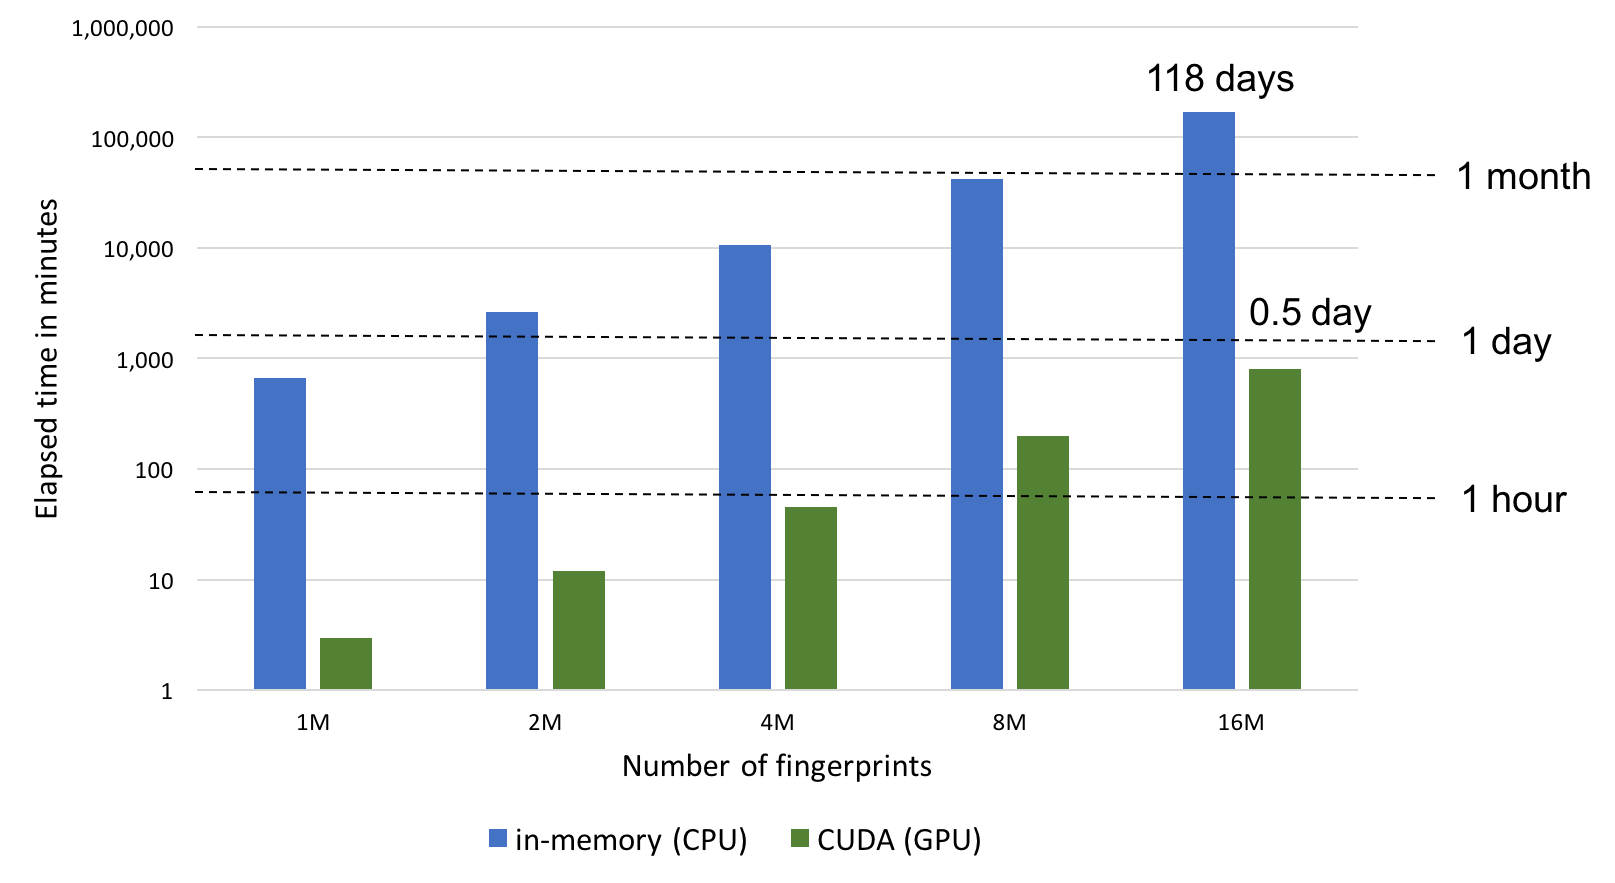
The fphist2img script can run in different modes that determine
how fingerprints are stored and searched in the OEFastFPDatabase object.
The --mem-type option controls this behavior:
See also
OEFastFPDatabaseMemoryType namespace in the GraphSim TK manual
|
|
See also in GraphSim TK manual
Theory
Fingerprint Generation chapter
API
OEGetSimilarityMeasureName function
OEFastFPDatabase class
OEFPDatabaseOptions class
OEFPHistogram class
See also in matplotlib documentation
matplotlib.pyplot