Visualizing Molecular Dipole Moment
Problem
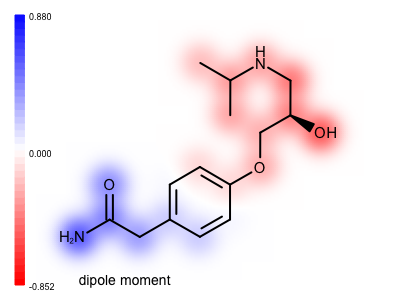
You want to visualize the molecular dipole moment that is a good indicator of the overall polarity of a molecule. See example in Figure 1.

Figure 1. Example of visualizing the molecular dipole moment
Ingredients
|
Difficulty level

Download
Solution
The calculate_dipole_moment function, after assigning the partial charges of the atoms by calling the OEMMFF94PartialCharges function, calculates the center of the positive and negative charges (lines 16-28) using the partial atom charges as a weight. Then its calculates:
the magnitude of the dipole (lines 36-44)
the (unit normalized) direction of the dipole (lines 46-48)
the center of the dipole (lines 50-52)
The dipole inner product is then calculated for each atom.. This is the vector product of the unit dipole with the vector from the dipole center to the atom center (lines 56-58). These numbers are then normalized such that the most positive number is equal to 1.0 and the most negative to -1.0 (lines 54-59). After the normalization, the number are attached to the relevant atom as generic data with the given tag (lines 66-67). For each bond a value is also calculated by averaging the values of its end atoms See more details in the Discussion section.
Note
The dipole inner product numbers represent both the distance and correlation with direction of the dipole, i.e. an atom that is in the positive direction of the dipole will be positive and its value will be bigger the further away it is from the center of the dipole. Atoms that are in a plane orthogonal to the dipole, passing through the dipole center, will have a number close to zero.
 1def calculate_dipole_moment(mol, itag):
 2    """
 3    Calculates dipole moment for each atom.
 4
 5    :type mol: oechem.OEMolBase
 6    :type: itag: int
 7    """
 8
 9    oechem.OEMMFFAtomTypes(mol)
10    oechem.OEMMFF94PartialCharges(mol)
11
12    ncrg = 0.0
13    pcrg = 0.0
14    ncen = [0.0, 0.0, 0.0]
15    pcen = [0.0, 0.0, 0.0]
16    for atom in mol.GetAtoms():
17        charge = atom.GetPartialCharge()
18        x, y, z = mol.GetCoords(atom)
19        if charge < 0.0:
20            ncen[0] -= charge * x
21            ncen[1] -= charge * y
22            ncen[2] -= charge * z
23            ncrg -= charge
24        elif charge > 0.0:
25            pcen[0] += charge * x
26            pcen[1] += charge * y
27            pcen[2] += charge * z
28            pcrg += charge
29
30    for idx in range(0, 3):
31        ncen[idx] = ncen[idx] / ncrg
32        pcen[idx] = pcen[idx] / pcrg
33    if pcrg > ncrg:
34        pcrg = ncrg
35
36    dpmag = 0.0
37    for i in range(0, 3):
38        dpmag += (ncen[i] - pcen[i]) * (ncen[i] - pcen[i])
39
40    if abs(dpmag) < 0.001:
41        # no dipole moment
42        return False
43
44    dpmag *= 4.80324 * pcrg
45
46    dipdir = [0.0, 0.0, 0.0]
47    for idx in range(0, 3):
48        dipdir[idx] = 4.80324 * pcrg * ((pcen[idx] - ncen[idx]) / dpmag)
49
50    dipcen = [0.0, 0.0, 0.0]
51    for idx in range(0, 3):
52        dipcen[idx] = 0.5 * (pcen[idx] + ncen[idx])
53
54    dpip = oechem.OEFloatArray(mol.GetMaxAtomIdx())
55
56    for atom in mol.GetAtoms():
57        x, y, z = mol.GetCoords(atom)
58        dpip[atom.GetIdx()] = sum([(x - dipcen[0]) * dipdir[0],
59                                   (y - dipcen[1]) * dipdir[1],
60                                   (z - dipcen[2]) * dipdir[2]])
61
62    max_dpip = max(dpip)
63    min_dpip = min(dpip)
64
65    dpip = [-i / min_dpip if i < 0.0 else i for i in dpip]
66    dpip = [+i / max_dpip if i > 0.0 else i for i in dpip]
67
68    for atom, dipole in zip(mol.GetAtoms(), dpip):
69        atom.SetData(itag, dipole)
70
71    for bond in mol.GetBonds():
72        avg = (bond.GetBgn().GetData(itag) + bond.GetEnd().GetData(itag)) / 2.0
73        bond.SetData(itag, avg)
74
75    return True
The depict_molecule_with_dipole function below shows how the atom values calculated by the calculate_dipole_moment function are projected onto the property map. This gives you a sense of the direction of the dipole relative to the atoms. Before rendering the molecule the OEPrepareDepictionFrom3D function is called to generate a 2D layout of the molecule that is most similar to the 3D coordinates (line 3). The atom values are then projected onto the 2D diagram using the OE2DPropMap class (lines 10-12).
 1def depict_molecule_with_dipole(image, mol, opts, stag):
 2    """
 3    Depicts the molecule property map.
 4
 5    :type image: oedepict.OEImageBase
 6    :type mol: oechem.OEMolBase
 7    :type opts: oedepict.OE2DMolDisplayOptions
 8    :type stag: string
 9    """
10
11    oegrapheme.OEPrepareDepictionFrom3D(mol, True)
12
13    opts.SetAtomColorStyle(oedepict.OEAtomColorStyle_WhiteMonochrome)
14    opts.SetScale(oegrapheme.OEGetMoleculeSurfaceScale(mol, opts))
15
16    disp = oedepict.OE2DMolDisplay(mol, opts)
17
18    propmap = oegrapheme.OE2DPropMap(opts.GetBackgroundColor())
19    propmap.SetLegendLocation(oegrapheme.OELegendLocation_Left)
20    propmap.Render(disp, stag)
21
22    oedepict.OERenderMolecule(image, disp)
Usage
Usage
dipole2img.py
and atenolol.sdf
molecule file
The following command will generate the image shown in Figure 1.
prompt > python3 dipole2img.py atenolol.sdf atenolol.svg
Command Line Parameters
Simple parameter list
    -height : Height of output image
    -width : Width of output image

    input/output options
      -in : Input molecule filename
      -out : Output filename of the generated image
Discussion
In the calculate_dipole_moment function, after calculating the atom values, a value is calculated for each bond by averaging the values of its end atoms (lines 58-60). When the property map is rendered these bond values are projected at the middle of the bond resulting in a much smoother image. See the difference between the two images shown below. Image (A) is generated by projecting only atom values, while in image (B) both the atom and the bond values are projected onto the property map before applying a Gaussian function to blur out the 2D grid underneath the molecular graph.
( A ) only atom values |
( B ) both atom and bond values |
|
|
See also in OEChem TK manual
Theory
Generic Data chapter
API
OEMMFFAtomTypes function
OEMMFF94PartialCharges function
See also in OEDepict TK manual
Theory
Molecule Depiction chapter
API
OE2DMolDisplay class
OE2DMolDisplayOptions class
OEImage class
OERenderMolecule function
See also in GraphemeTM TK manual
Theory
Depicting Atom Property Maps chapter
API
OE2DPropMap class
OEGetMoleculeSurfaceScale function
OEPrepareDepictionFrom3D function