Depicting Activities of Molecules
activity2pdf
Problem
You want to organize and depict a set of molecules according to given
activity data and common substructure.
See the separate pages of a multi-page PDF in Table 1.
page 1 |
page 2 |
.. |
page 8 |
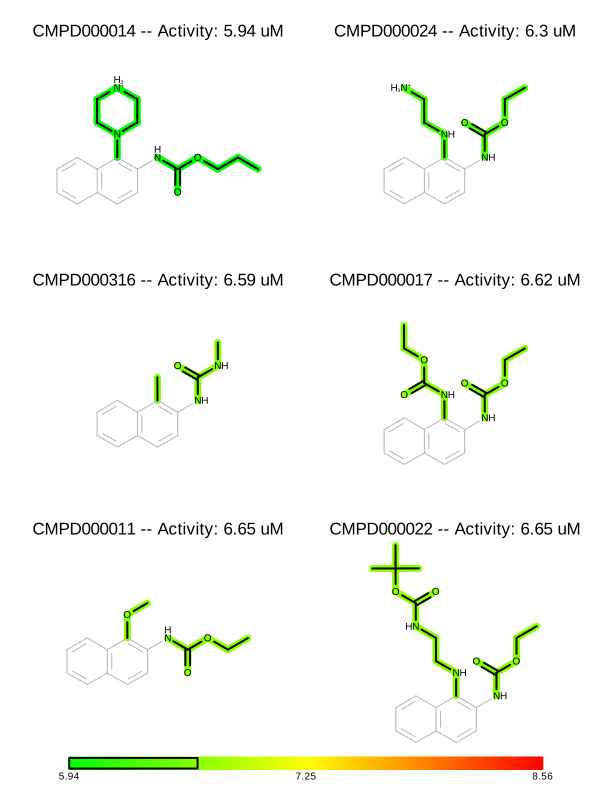
|
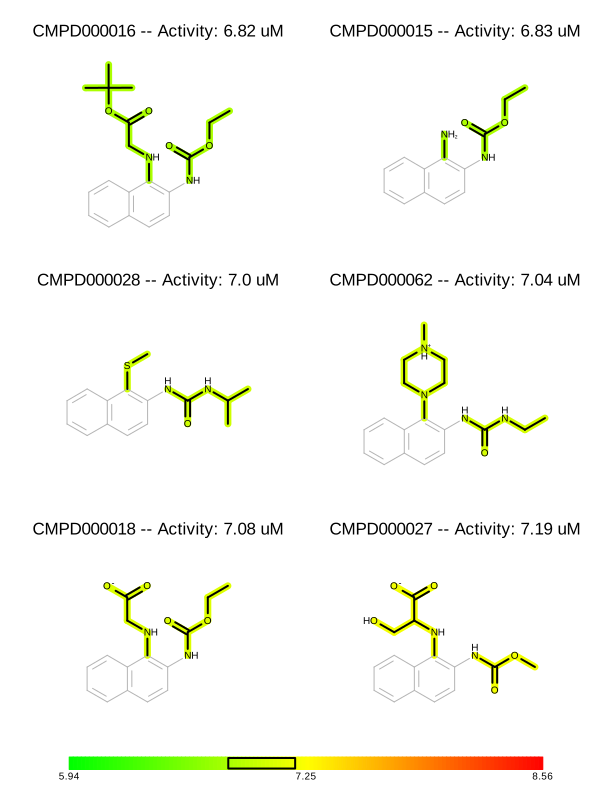
|
.. |
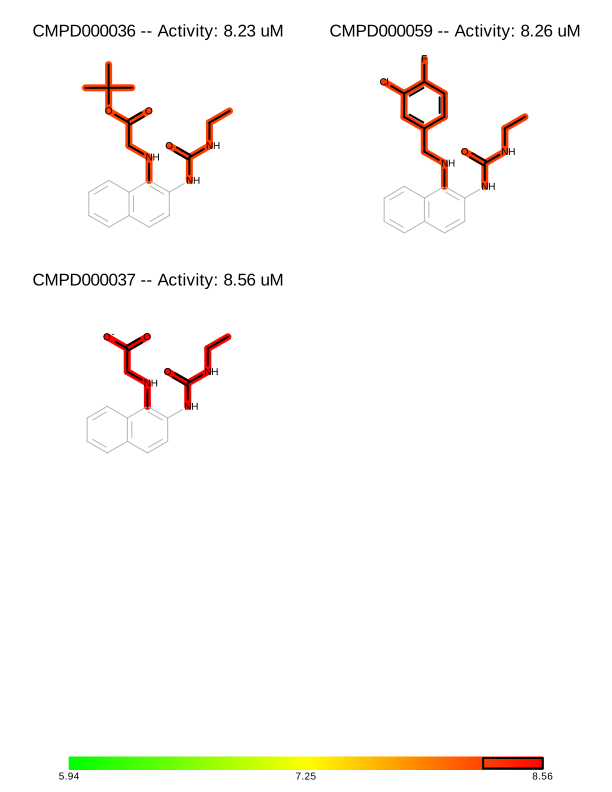
|
Ingredients
|
Difficulty level
🌶️ 🌶️
Download
Source Code
activity2pdf
#!/usr/bin/env python3
# (C) 2023 Cadence Design Systems, Inc. (Cadence)
# All rights reserved.
# TERMS FOR USE OF SAMPLE CODE The software below ("Sample Code") is
# provided to current licensees or subscribers of Cadence products or
# SaaS offerings (each a "Customer").
# Customer is hereby permitted to use, copy, and modify the Sample Code,
# subject to these terms. Cadence claims no rights to Customer's
# modifications. Modification of Sample Code is at Customer's sole and
# exclusive risk. Sample Code may require Customer to have a then
# current license or subscription to the applicable Cadence offering.
# THE SAMPLE CODE IS PROVIDED "AS IS", WITHOUT WARRANTY OF ANY KIND,
# EXPRESS OR IMPLIED.  OPENEYE DISCLAIMS ALL WARRANTIES, INCLUDING, BUT
# NOT LIMITED TO, WARRANTIES OF MERCHANTABILITY, FITNESS FOR A
# PARTICULAR PURPOSE AND NONINFRINGEMENT. In no event shall Cadence be
# liable for any damages or liability in connection with the Sample Code
# or its use.

"""Create a report that visualizes molecule activities."""


import argparse
import os
import pathlib
import sys
from operator import itemgetter

from openeye import oechem, oedepict, oegrapheme
from rich_argparse import HelpPreviewAction, RichHelpFormatter

__SCRIPT_NAME__ = pathlib.Path(__file__).absolute().stem
__SCRIPT_DESC__ = "Create a report that visualizes molecule activities."
__SCRIPT_TOOLKITS__ = ["oechem", "oedepict", "oegrapheme"]
__SCRIPT_CATEGORIES__ = ["depiction"]


def parse_args() -> argparse.Namespace:
    """Parse command-line arguments."""
    parser = argparse.ArgumentParser(
        add_help=True,
        formatter_class=RichHelpFormatter,
        description="[yellow]" + __SCRIPT_DESC__ + "[/yellow]",
    )
    input_group = parser.add_argument_group("Input options")
    input_group.add_argument(
        "--mol",
        type=str,
        required=True,
        metavar="MOL-FILE",
        help="input MOL file (.sdf) with molecule activity data in SD tag 'activity'",
    )
    input_group.add_argument(
        "--core",
        type=str,
        required=True,
        metavar="SMILES",
        help="SMILES of the core substructure",
    )

    report_group = parser.add_argument_group("Report options")
    report_group.add_argument(
        "--report",
        type=str,
        required=True,
        metavar="REPORT-FILE",
        help="output report file (PDF)",
    )
    report_group.add_argument(
        "--rows",
        type=int,
        default=3,
        choices=range(1, 4),
        metavar="N",
        help="number of rows per page (default: %(default)s)",
    )
    report_group.add_argument(
        "--cols",
        type=int,
        default=2,
        choices=range(1, 3),
        metavar="N",
        help="number of columns per page (default: %(default)s)",
    )
    report_group.add_argument(
        "--page-by-page",
        action="store_true",
        help="write pages of report to separate numbered image files (default: %(default)s)",
    )

    parser.add_argument("--help-image", action=HelpPreviewAction)
    return parser.parse_args()


def main() -> int:
    """Create a report that visualizes molecule activities."""
    args = parse_args()
    _check_report_file(args)

    input_stream = oechem.oemolistream()
    if not input_stream.open(args.mol):
        oechem.OEThrow.Fatal("Cannot open input file!")

    # initialize multi-page report
    report_options = oedepict.OEReportOptions(args.rows, args.cols)
    report_options.SetFooterHeight(25)
    report_options.SetCellGap(2)
    report_options.SetPageMargins(10)
    report = oedepict.OEReport(report_options)

    # setup depiction options
    cell_width, cell_height = report.GetCellWidth(), report.GetCellHeight()
    opts = oedepict.OE2DMolDisplayOptions(
        cell_width, cell_height, oedepict.OEScale_AutoScale
    )

    # prepare the substructure search for core
    core = oechem.OEGraphMol()
    oechem.OEParseSmiles(core, args.core)
    oedepict.OEPrepareDepiction(core)
    atom_expr, bond_expr = (
        oechem.OEExprOpts_DefaultAtoms,
        oechem.OEExprOpts_DefaultBonds,
    )
    core_substructure_search = oechem.OESubSearch(core, atom_expr, bond_expr)

    # read molecules
    molecule_list: list[tuple[oechem.OEGraphMol, float]] = []
    import_molecules(input_stream, molecule_list)

    if not molecule_list:
        oechem.OEThrow.Warning("No molecules with activity data found. Exiting.")
        return 0

    # determine the scale factor to depict all molecules with equal size
    for mol, _ in molecule_list:
        oedepict.OEPrepareDepiction(mol)

    molecule_scale = float("inf")
    for mol, _ in molecule_list:
        molecule_scale = min(molecule_scale, oedepict.OEGetMoleculeScale(mol, opts))
    opts.SetScale(molecule_scale)

    # depict molecule with activity
    depict_molecules_with_activity(
        report, molecule_list, core_substructure_search, opts
    )

    if args.page_by_page:
        oedepict.OEWriteReportPageByPage(args.report, report)
    else:
        oedepict.OEWriteReport(args.report, report)

    return os.EX_OK


def import_molecules(
    input_stream: oechem.oemolistream,
    molecule_list: list[tuple[oechem.OEGraphMol, float]],
) -> None:
    """
    Import molecules from an SDF file and extract activity data.

    Molecules with non-numeric or missing activity data in the SD tag 'activity'
    are ignored with a warning.
    """
    if input_stream.GetFormat() != oechem.OEFormat_SDF:
        oechem.OEThrow.Fatal("The input file has to be an SDF file")

    tag = "activity"
    for mol in input_stream.GetOEGraphMols():
        mol_id = mol.GetTitle()
        if not oechem.OEHasSDData(mol, tag):
            oechem.OEThrow.Warning(
                f"No activity data found for molecule '{mol_id}'. Compound will be ignored."
            )
        else:
            activity_str = oechem.OEGetSDData(mol, tag)
            try:
                activity = float(activity_str)
                mol.SetTitle(f"{mol_id} -- Activity: {activity_str} uM")
                molecule_list.append((oechem.OEGraphMol(mol), activity))
            except ValueError:
                oechem.OEThrow.Warning(
                    f"Non-numeric activity data '{activity_str}' found for molecule '{mol_id}'. "
                    "Compound will be ignored."
                )


def fade_core_substructure(
    disp: oedepict.OE2DMolDisplay, core_match: oechem.OEMatchBase
) -> None:
    """
    Fade the core substructure in the depiction.

    Highlights the core substructure bonds with reduced line width in grey color.

    """
    bond_predicate = oechem.OEIsBondMember(core_match.GetTargetBonds())
    line_width_scale = 0.75
    highlight_style = oedepict.OEHighlightByColor(oechem.OEGrey, line_width_scale)
    oedepict.OEAddHighlighting(disp, highlight_style, bond_predicate)


def highlight_by_activity(
    disp: oedepict.OE2DMolDisplay,
    core_match: oechem.OEMatchBase,
    activity: float,
    color_gradient: oechem.OEColorGradientBase,
) -> None:
    """
    Highlight the molecule by activity.

    Colors the non-core side chain atoms based on the activity value using
    the provided color gradient (green=low, yellow=mid, red=high).

    """
    bond_predicate = oechem.OENotBond(
        oechem.OEIsBondMember(core_match.GetTargetBonds())
    )
    color = color_gradient.GetColorAt(activity)
    highlight_style = oedepict.OEHighlightByStick(color)
    oedepict.OEAddHighlighting(disp, highlight_style, bond_predicate)


def depict_molecules_with_activity(
    report: oedepict.OEReport,
    molecule_list: list[tuple[oechem.OEGraphMol, float]],
    core_substructure_search: oechem.OESubSearch,
    opts: oedepict.OE2DMolDisplayOptions,
) -> None:
    """
    Depict molecules with activity on report pages.

    Adds molecule depictions to the report, sorted by activity. Each molecule
    is highlighted with its core structure faded and side chains colored by
    activity. Color gradients are added to each page footer for reference.

    """
    activities = [activity for _, activity in molecule_list]
    min_activity = min(activities)
    max_activity = max(activities)

    mid_value = (min_activity + max_activity) / 2.0
    color_gradient = oechem.OELinearColorGradient(
        oechem.OEColorStop(mid_value, oechem.OEYellow)
    )
    color_gradient.AddStop(oechem.OEColorStop(max_activity, oechem.OERed))
    color_gradient.AddStop(oechem.OEColorStop(min_activity, oechem.OEGreen))

    sorted_molecule_list = sorted(molecule_list, key=itemgetter(1))

    for mol, activity in sorted_molecule_list:
        match = None
        for mi in core_substructure_search.Match(mol, True):
            match = mi
            oedepict.OEPrepareAlignedDepiction(
                mol, core_substructure_search.GetPattern(), match
            )
            break

        cell = report.NewCell()
        disp = oedepict.OE2DMolDisplay(mol, opts)

        if match is not None:
            fade_core_substructure(disp, match)
            highlight_by_activity(disp, match, activity, color_gradient)

        oedepict.OERenderMolecule(cell, disp)

    cells_per_page = report.NumRowsPerPage() * report.NumColsPerPage()
    opts_grad = oegrapheme.OEColorGradientDisplayOptions()

    for page_index, footer in enumerate(report.GetFooters()):
        begin_index = page_index * cells_per_page
        end_index = (page_index + 1) * cells_per_page
        page_activities = [
            activity for _, activity in sorted_molecule_list[begin_index:end_index]
        ]
        if not page_activities:
            continue
        min_page_activities = min(page_activities)
        max_page_activities = max(page_activities)

        opts_grad.ClearMarkedValues()
        if min_page_activities == max_page_activities:
            opts_grad.AddMarkedValue(min_page_activities)
        else:
            opts_grad.SetBoxRange(min_page_activities, max_page_activities)
        oegrapheme.OEDrawColorGradient(footer, color_gradient, opts_grad)


def _check_report_file(args: argparse.Namespace) -> None:
    """
    Validate report file format and options.

    Checks that the output file format is registered with OpenEye. If a
    multi-page format was requested but the format doesn't support it,
    switches to page-by-page mode.

    Raises:
        OEThrow.Fatal: If the output file format is not recognized by OpenEye.

    """
    ext = pathlib.Path(args.report).suffix[1:]
    if not oedepict.OEIsRegisteredImageFile(ext):
        oechem.OEThrow.Fatal("Unknown image output type!")

    if not args.page_by_page and not oedepict.OEIsRegisteredMultiPageImageFile(ext):
        oechem.OEThrow.Warning("Report will be generated into separate pages!")
        args.page_by_page = True


setattr(main, "__SCRIPT_NAME__", __SCRIPT_NAME__)
setattr(main, "__SCRIPT_DESC__", __SCRIPT_DESC__)
setattr(main, "__SCRIPT_TOOLKITS__", __SCRIPT_TOOLKITS__)
setattr(main, "__SCRIPT_CATEGORIES__", __SCRIPT_CATEGORIES__)


if __name__ == "__main__":
    sys.exit(main())
Solution
First you have to import the molecules being depicted with their activity information.
In this example the import_molecule
function reads the molecules and extracts the activity information attached
to the molecule as SD data with the “activity” tag.
(See example in the
activity.sdf input file.)
After converting the SD string to a floating point number the number is added to
the title of the molecule in order to depict it later along with the molecule.
Each imported molecule, along with its corresponding activity, is inserted into
a list of (molecule, activity) tuples.
def import_molecules(
    input_stream: oechem.oemolistream,
    molecule_list: list[tuple[oechem.OEGraphMol, float]],
) -> None:
    """
    Import molecules from an SDF file and extract activity data.

    Molecules with non-numeric or missing activity data in the SD tag 'activity'
    are ignored with a warning.
    """
    if input_stream.GetFormat() != oechem.OEFormat_SDF:
        oechem.OEThrow.Fatal("The input file has to be an SDF file")

    tag = "activity"
    for mol in input_stream.GetOEGraphMols():
        mol_id = mol.GetTitle()
        if not oechem.OEHasSDData(mol, tag):
            oechem.OEThrow.Warning(
                f"No activity data found for molecule '{mol_id}'. Compound will be ignored."
            )
        else:
            activity_str = oechem.OEGetSDData(mol, tag)
            try:
                activity = float(activity_str)
                mol.SetTitle(f"{mol_id} -- Activity: {activity_str} uM")
                molecule_list.append((oechem.OEGraphMol(mol), activity))
            except ValueError:
                oechem.OEThrow.Warning(
                    f"Non-numeric activity data '{activity_str}' found for molecule '{mol_id}'. "
                    "Compound will be ignored."
                )
The depict_molecules_with_activity function is responsible for depicting the molecules with their activities.
First, the activity numbers are extracted from the list of (molecule, activity) tuples in order to find the minimum and maximum activity number of the dataset. These numbers are used to construct a color gradient that will be used to color the molecules by their activity. The molecules are then sorted in decreasing order of their activities. This will be the order in which they are rendered.
Before rendering a substructure search is performed to find the common core substructure of the molecule. The match returned by the substructure search is used to align the molecule by this common core. Then the bonds of the common core are highlighted by calling the fade_core_substructure function, while the bonds that are not in the common core are highlighted by the activity of the molecule by calling the highlight_by_activity function. After rendering the molecules, the color gradient is depicted in the footer of each page along with a box that indicates the range of the activities of the molecule in each page.
def depict_molecules_with_activity(
    report: oedepict.OEReport,
    molecule_list: list[tuple[oechem.OEGraphMol, float]],
    core_substructure_search: oechem.OESubSearch,
    opts: oedepict.OE2DMolDisplayOptions,
) -> None:
    """
    Depict molecules with activity on report pages.

    Adds molecule depictions to the report, sorted by activity. Each molecule
    is highlighted with its core structure faded and side chains colored by
    activity. Color gradients are added to each page footer for reference.

    """
    activities = [activity for _, activity in molecule_list]
    min_activity = min(activities)
    max_activity = max(activities)

    mid_value = (min_activity + max_activity) / 2.0
    color_gradient = oechem.OELinearColorGradient(
        oechem.OEColorStop(mid_value, oechem.OEYellow)
    )
    color_gradient.AddStop(oechem.OEColorStop(max_activity, oechem.OERed))
    color_gradient.AddStop(oechem.OEColorStop(min_activity, oechem.OEGreen))

    sorted_molecule_list = sorted(molecule_list, key=itemgetter(1))

    for mol, activity in sorted_molecule_list:
        match = None
        for mi in core_substructure_search.Match(mol, True):
            match = mi
            oedepict.OEPrepareAlignedDepiction(
                mol, core_substructure_search.GetPattern(), match
            )
            break

        cell = report.NewCell()
        disp = oedepict.OE2DMolDisplay(mol, opts)

        if match is not None:
            fade_core_substructure(disp, match)
            highlight_by_activity(disp, match, activity, color_gradient)

        oedepict.OERenderMolecule(cell, disp)

    cells_per_page = report.NumRowsPerPage() * report.NumColsPerPage()
    opts_grad = oegrapheme.OEColorGradientDisplayOptions()

    for page_index, footer in enumerate(report.GetFooters()):
        begin_index = page_index * cells_per_page
        end_index = (page_index + 1) * cells_per_page
        page_activities = [
            activity for _, activity in sorted_molecule_list[begin_index:end_index]
        ]
        if not page_activities:
            continue
        min_page_activities = min(page_activities)
        max_page_activities = max(page_activities)

        opts_grad.ClearMarkedValues()
        if min_page_activities == max_page_activities:
            opts_grad.AddMarkedValue(min_page_activities)
        else:
            opts_grad.SetBoxRange(min_page_activities, max_page_activities)
        oegrapheme.OEDrawColorGradient(footer, color_gradient, opts_grad)
The fade_core_substructure function shows how to “fade” the bonds detected to be part of the core structure by using the OEHighlightByColor highlighting style.
def fade_core_substructure(
    disp: oedepict.OE2DMolDisplay, core_match: oechem.OEMatchBase
) -> None:
    """
    Fade the core substructure in the depiction.

    Highlights the core substructure bonds with reduced line width in grey color.

    """
    bond_predicate = oechem.OEIsBondMember(core_match.GetTargetBonds())
    line_width_scale = 0.75
    highlight_style = oedepict.OEHighlightByColor(oechem.OEGrey, line_width_scale)
    oedepict.OEAddHighlighting(disp, highlight_style, bond_predicate)
The highlight_by_activity function shows how to color the bonds not part of the core structure by the activity of the molecule by using the OEHighlightByStick highlighting style.
def highlight_by_activity(
    disp: oedepict.OE2DMolDisplay,
    core_match: oechem.OEMatchBase,
    activity: float,
    color_gradient: oechem.OEColorGradientBase,
) -> None:
    """
    Highlight the molecule by activity.

    Colors the non-core side chain atoms based on the activity value using
    the provided color gradient (green=low, yellow=mid, red=high).

    """
    bond_predicate = oechem.OENotBond(
        oechem.OEIsBondMember(core_match.GetTargetBonds())
    )
    color = color_gradient.GetColorAt(activity)
    highlight_style = oedepict.OEHighlightByStick(color)
    oedepict.OEAddHighlighting(disp, highlight_style, bond_predicate)
Usage
See Download section to download the scripts.
> activity2pdf --help
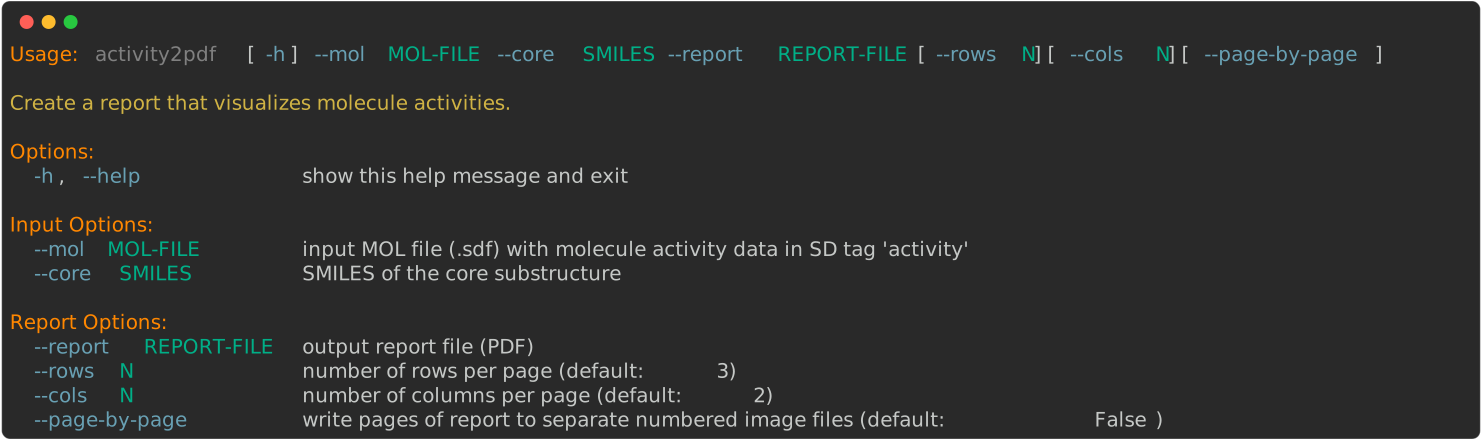
The command below will generate a multi-page PDF report (activity2pdf.pdf)
with the molecules depicted in Table 1
for input activity.sdf.
> activity2pdf --core 'c1ccc2cc(ccc2c1)N' --mol activity.sdf --report report.pdf
See also in OEChem TK manual
Theory
SD Tagged Data Manipulation section
API
OEGetSDData function
OEHasSDData function
OELinearColorGradient class
OEMatch class
OESubSearch class
See also in OEDepict TK manual
Theory
Highlighting chapter
Multi Page Reports section
API
OE2DMolDisplay class
OE2DMolDisplayOptions class
OEAddHighlighting function
OEHighlightByColor class
OEHighlightByStick class
OEPrepareAlignedDepiction function
OERenderMolecule function
OEReport class
See also in GraphemeTM TK manual
API
OEDrawColorGradient function