Visualizing Electron Density
Problem
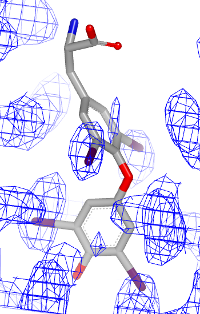
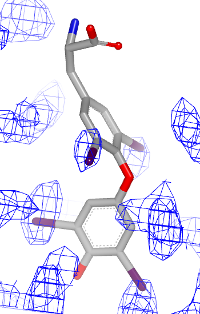
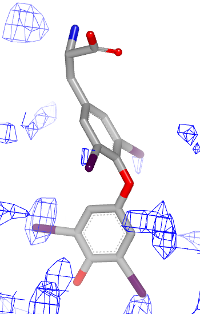
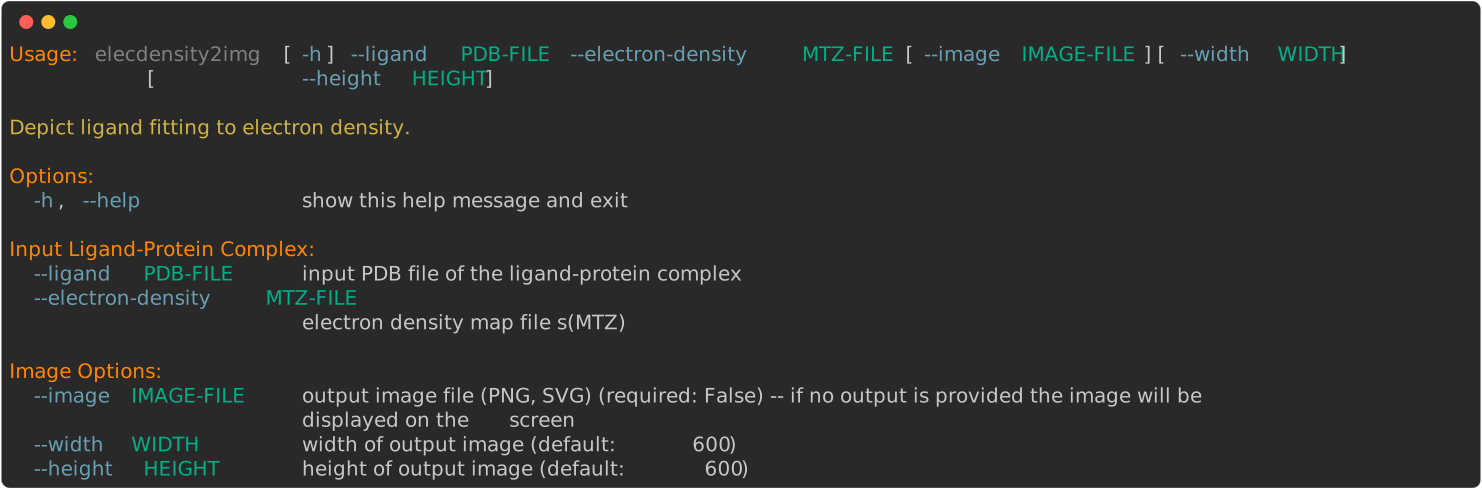
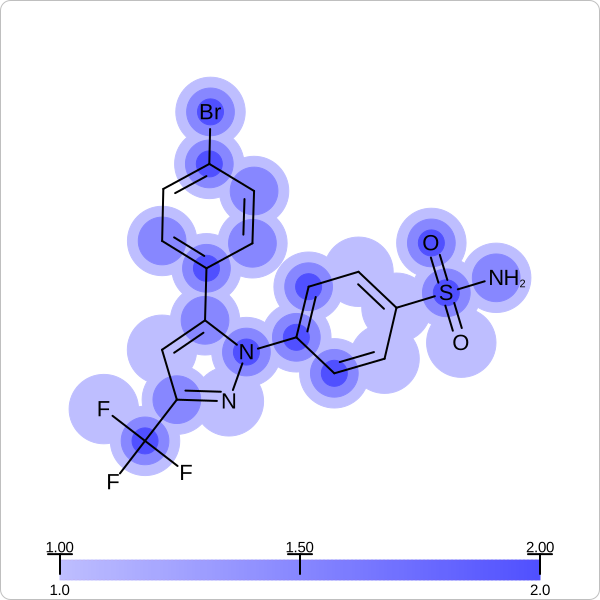
You want to visualize how a ligand fits into an electron density grid in a 2D molecule diagram (see Figure 1). The electron density grid with various contour levels and the 3D molecule is shown in Table 1.
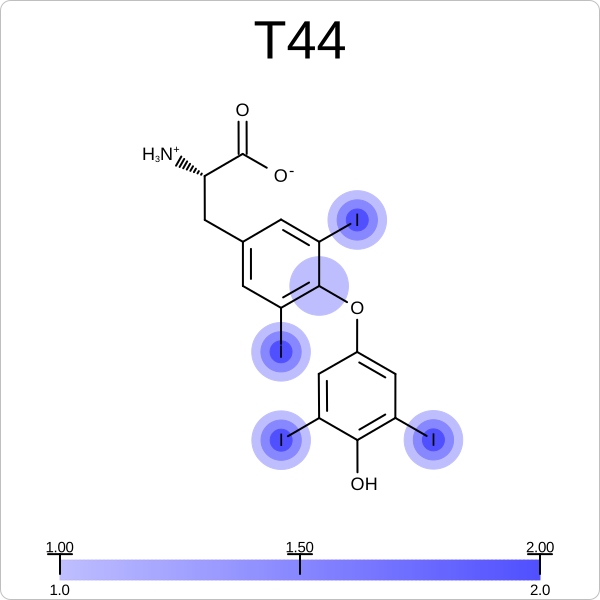
Figure 1. Example of visualizing ligand electron density fit (PDB: 1ETS)
contour 1.0 |
contour 1.5 |
contour 2.0 |
|
|
|
Ingredients
|
Difficulty Level
🌶️ 🌶️ 🌶️
Download
Source Code
elecdensity2img
#!/usr/bin/env python3
# (C) 2023 Cadence Design Systems, Inc. (Cadence)
# All rights reserved.
# TERMS FOR USE OF SAMPLE CODE The software below ("Sample Code") is
# provided to current licensees or subscribers of Cadence products or
# SaaS offerings (each a "Customer").
# Customer is hereby permitted to use, copy, and modify the Sample Code,
# subject to these terms. Cadence claims no rights to Customer's
# modifications. Modification of Sample Code is at Customer's sole and
# exclusive risk. Sample Code may require Customer to have a then
# current license or subscription to the applicable Cadence offering.
# THE SAMPLE CODE IS PROVIDED "AS IS", WITHOUT WARRANTY OF ANY KIND,
# EXPRESS OR IMPLIED.  OPENEYE DISCLAIMS ALL WARRANTIES, INCLUDING, BUT
# NOT LIMITED TO, WARRANTIES OF MERCHANTABILITY, FITNESS FOR A
# PARTICULAR PURPOSE AND NONINFRINGEMENT. In no event shall Cadence be
# liable for any damages or liability in connection with the Sample Code
# or its use.

"""Depict ligand fitting to electron density."""


import argparse
import io
import os
import sys
from pathlib import Path

from openeye import oechem, oedepict, oegrapheme, oegrid
from PIL import Image
from rich_argparse import HelpPreviewAction, RichHelpFormatter

__SCRIPT_NAME__ = Path(__file__).absolute().stem
__SCRIPT_DESC__ = "Depict ligand fitting to electron density."
__SCRIPT_TOOLKITS__ = ["oechem", "oegrid", "oedepict", "oegrapheme"]
__SCRIPT_CATEGORIES__ = ["visualization"]


def parse_options() -> argparse.Namespace:
    """Set up command line options."""
    parser = argparse.ArgumentParser(
        add_help=True,
        formatter_class=RichHelpFormatter,
        description="[yellow]" + __SCRIPT_DESC__ + "[/yellow]",
    )
    parser.add_argument("--help-image", action=HelpPreviewAction)

    # input options
    input_group = parser.add_argument_group("Input ligand-protein complex")
    input_group.add_argument(
        "--ligand",
        type=str,
        required=True,
        metavar="PDB-FILE",
        help="input PDB file of the ligand-protein complex",
    )
    input_group.add_argument(
        "--electron-density",
        type=str,
        required=True,
        metavar="MTZ-FILE",
        help="electron density map file s(MTZ)",
    )
    image_group = parser.add_argument_group("Image options")
    image_group.add_argument(
        "--image",
        type=str,
        required=False,
        metavar="IMAGE-FILE",
        help="output image file (PNG, SVG) (required: %(required)s) -- if no output is provided the image will be displayed on the  screen",
    )
    image_group.add_argument(
        "--width",
        type=int,
        default=600,
        help="width of output image (default: %(default)s)",
    )
    image_group.add_argument(
        "--height",
        type=int,
        default=600,
        help="height of output image (default: %(default)s)",
    )

    return parser.parse_args()


def main() -> int:
    """Depict electron density."""
    args = parse_options()

    _check_image_file(args)

    # read ligand and electron density map (grid)

    ifs = oechem.oemolistream()
    if not ifs.open(args.ligand):
        oechem.OEThrow.Fatal("Cannot open input ligand file!")

    mol = oechem.OEGraphMol()
    if not oechem.OEReadMolecule(ifs, mol):
        oechem.OEThrow.Fatal("Cannot read molecule from file!")

    electron_density_grid = oegrid.OESkewGrid()
    if not oegrid.OEReadMTZ(
        args.electron_density, electron_density_grid, oegrid.OEMTZMapType_Fwt
    ):
        oechem.OEThrow.Fatal("Cannot read MTZ electron density map file!")

    # create image
    image = oedepict.OEImage(args.width, args.height)

    # setup display options
    opts = oedepict.OE2DMolDisplayOptions(
        args.width, args.height, oedepict.OEScale_AutoScale
    )
    opts.SetAtomColorStyle(oedepict.OEAtomColorStyle_WhiteMonochrome)

    depict_electron_density_fit(image, mol, electron_density_grid, opts)

    oedepict.OEDrawCurvedBorder(image, oedepict.OELightGreyPen, 10.0)

    if args.image:
        oedepict.OEWriteImage(args.image, image)
    else:
        _img = Image.open(io.BytesIO(oedepict.OEWriteImageToBytes("png", image)))
        _img.show()
    return os.EX_OK


def depict_electron_density_fit(
    image: oedepict.OEImageBase,
    ligand: oechem.OEMolBase,
    electron_density_grid: oegrid.OESkewGrid,
    opts: oedepict.OE2DMolDisplayOptions,
) -> None:
    """Depict the molecule with electron density fit."""
    # generate image frames

    width, height = image.GetWidth(), image.GetHeight()
    main_frame = oedepict.OEImageFrame(
        image, width, height * 0.90, oedepict.OE2DPoint(0.0, 0.0)
    )
    legend_frame = oedepict.OEImageFrame(
        image, width, height * 0.10, oedepict.OE2DPoint(0.0, height * 0.90)
    )

    # calculate fit to electron density at various contours
    contours = [1.0, 1.5, 2.0]
    for contour in contours:
        set_electron_density_contour_overlap(
            ligand,
            electron_density_grid,
            contour,
            oechem.OEGetTag(f"contour-{contour:.2f}"),
        )

    # prepare molecule for depiction

    width, height = main_frame.GetWidth(), main_frame.GetHeight()
    opts.SetDimensions(width, height, oedepict.OEScale_AutoScale)

    oegrapheme.OEPrepareDepictionFrom3D(ligand)
    opts.SetScale(oedepict.OEGetMoleculeScale(ligand, opts) * 0.95)
    disp = oedepict.OE2DMolDisplay(ligand, opts)

    # create color gradient

    color_gradient = oechem.OELinearColorGradient()
    color_gradient.AddStop(
        oechem.OEColorStop(min(contours), oechem.OEColor(190, 190, 255))
    )  # light blue
    color_gradient.AddStop(
        oechem.OEColorStop(max(contours), oechem.OEColor(80, 80, 255))
    )  # medium blue

    # visualize electron density fit

    layer = disp.GetLayer(oedepict.OELayerPosition_Below)
    for contour in contours:
        contour_tag: int = oechem.OEGetTag(f"contour-{contour:.2f}")
        radius: float = _get_contour_radius(contour, contours, disp)
        color: oechem.OEColor = color_gradient.GetColorAt(contour)
        pen = oedepict.OEPen(color, color, oedepict.OEFill_On, 1.0)
        for atom in ligand.GetAtoms():
            if atom.HasData(contour_tag):
                atom_display = disp.GetAtomDisplay(atom)
                layer.DrawCircle(atom_display.GetCoords(), radius, pen)

    # render molecule
    oedepict.OERenderMolecule(main_frame, disp)

    # draw color gradient

    color_opts = oegrapheme.OEColorGradientDisplayOptions()
    color_opts.SetColorStopPrecision(1)
    color_opts.AddMarkedValues(contours)
    oegrapheme.OEDrawColorGradient(legend_frame, color_gradient, color_opts)


def _get_contour_radius(
    contour: float, contours: list[float], disp: oedepict.OE2DMolDisplay
) -> float:
    max_radius = disp.GetScale() / 1.5
    min_radius = disp.GetScale() / 4.0
    radius_range = max_radius - min_radius

    contour_range = max(contours) - min(contours)
    if contour_range == 0.0:
        return (max_radius - min_radius) / 2.0
    if contour < min(contours):
        return min_radius
    if contour > max(contours):
        return max_radius

    return max_radius - ((radius_range / contour_range) * (contour - min(contours)))


def set_electron_density_contour_overlap(
    ligand: oechem.OEMolBase,
    electron_density_grid: oegrid.OESkewGrid,
    contour: float,
    contour_tag: int,
) -> None:
    """Set whether atoms are inside the electron density grid at the given contour level."""
    center = oechem.OEFloatArray(3)
    extents = oechem.OEFloatArray(3)
    oechem.OEGetCenterAndExtents(ligand, center, extents)

    sub_grid = oegrid.OEScalarGrid()

    # expand the grid a bit for proper overlaps

    extents[0] += 2.5
    extents[1] += 2.5
    extents[2] += 2.5
    oegrid.OEMakeRegularSubGrid(
        sub_grid,
        electron_density_grid,
        center,
        extents,
        0.5,
        electron_density_grid.GetReentrant() >= 7,  # noqa: PLR2004
    )

    for atom in ligand.GetAtoms(oechem.OEIsHeavy()):
        xyz = ligand.GetCoords(atom)
        val = sub_grid.GetValue(xyz[0], xyz[1], xyz[2])
        if val > contour:
            atom.SetData(contour_tag, val)


def _check_image_file(args: argparse.Namespace) -> None:
    # script will terminate if there is some issues
    if not args.image:
        # image will be displayed on the screen
        return
    ext = Path(args.image).suffix[1:].upper()
    if not oedepict.OEIsRegisteredImageFile(ext):
        oechem.OEThrow.Fatal("Unknown image output type!")

    ofs = oechem.oeofstream()
    if not ofs.open(args.image):
        oechem.OEThrow.Fatal("Cannot open output image file!")


setattr(main, "__SCRIPT_NAME__", __SCRIPT_NAME__)
setattr(main, "__SCRIPT_DESC__", __SCRIPT_DESC__)
setattr(main, "__SCRIPT_TOOLKITS__", __SCRIPT_TOOLKITS__)
setattr(main, "__SCRIPT_CATEGORIES__", __SCRIPT_CATEGORIES__)

if __name__ == "__main__":
    sys.exit(main())
Solution
The set_electron_density_contour_overlap function tags an atom if its coordinates inside the grid at the given contour level.
def set_electron_density_contour_overlap(
    ligand: oechem.OEMolBase,
    electron_density_grid: oegrid.OESkewGrid,
    contour: float,
    contour_tag: int,
) -> None:
    """Set whether atoms are inside the electron density grid at the given contour level."""
    center = oechem.OEFloatArray(3)
    extents = oechem.OEFloatArray(3)
    oechem.OEGetCenterAndExtents(ligand, center, extents)

    sub_grid = oegrid.OEScalarGrid()

    # expand the grid a bit for proper overlaps

    extents[0] += 2.5
    extents[1] += 2.5
    extents[2] += 2.5
    oegrid.OEMakeRegularSubGrid(
        sub_grid,
        electron_density_grid,
        center,
        extents,
        0.5,
        electron_density_grid.GetReentrant() >= 7,  # noqa: PLR2004
    )

    for atom in ligand.GetAtoms(oechem.OEIsHeavy()):
        xyz = ligand.GetCoords(atom)
        val = sub_grid.GetValue(xyz[0], xyz[1], xyz[2])
        if val > contour:
            atom.SetData(contour_tag, val)
The depict_electron_density_fit function shows how to project the electron density fit with various contour levels into a 2D molecule diagram. First the image is divided into two image frames since both a molecule and a color gradient will be depicted. Then the set_electron_density_contour_overlap function is called that calculates whether the atoms of the molecule are inside the electron density grid at various contour levels. The molecule is then prepared for depiction generating its 2D coordinates by calling the OEPrepareDepictionFrom3D function. After constructing a color gradient that will assign colors to various contour levels, the function loops over the atoms and draws a circle around them if they are embedded into the electron density grid (> 0.2) with a color and radius that corresponds to the given contour level. Finally, the molecule along with the color gradient is rendered to the image. You can see the result in Figure 1.
def depict_electron_density_fit(
    image: oedepict.OEImageBase,
    ligand: oechem.OEMolBase,
    electron_density_grid: oegrid.OESkewGrid,
    opts: oedepict.OE2DMolDisplayOptions,
) -> None:
    """Depict the molecule with electron density fit."""
    # generate image frames

    width, height = image.GetWidth(), image.GetHeight()
    main_frame = oedepict.OEImageFrame(
        image, width, height * 0.90, oedepict.OE2DPoint(0.0, 0.0)
    )
    legend_frame = oedepict.OEImageFrame(
        image, width, height * 0.10, oedepict.OE2DPoint(0.0, height * 0.90)
    )

    # calculate fit to electron density at various contours
    contours = [1.0, 1.5, 2.0]
    for contour in contours:
        set_electron_density_contour_overlap(
            ligand,
            electron_density_grid,
            contour,
            oechem.OEGetTag(f"contour-{contour:.2f}"),
        )

    # prepare molecule for depiction

    width, height = main_frame.GetWidth(), main_frame.GetHeight()
    opts.SetDimensions(width, height, oedepict.OEScale_AutoScale)

    oegrapheme.OEPrepareDepictionFrom3D(ligand)
    opts.SetScale(oedepict.OEGetMoleculeScale(ligand, opts) * 0.95)
    disp = oedepict.OE2DMolDisplay(ligand, opts)

    # create color gradient

    color_gradient = oechem.OELinearColorGradient()
    color_gradient.AddStop(
        oechem.OEColorStop(min(contours), oechem.OEColor(190, 190, 255))
    )  # light blue
    color_gradient.AddStop(
        oechem.OEColorStop(max(contours), oechem.OEColor(80, 80, 255))
    )  # medium blue

    # visualize electron density fit

    layer = disp.GetLayer(oedepict.OELayerPosition_Below)
    for contour in contours:
        contour_tag: int = oechem.OEGetTag(f"contour-{contour:.2f}")
        radius: float = _get_contour_radius(contour, contours, disp)
        color: oechem.OEColor = color_gradient.GetColorAt(contour)
        pen = oedepict.OEPen(color, color, oedepict.OEFill_On, 1.0)
        for atom in ligand.GetAtoms():
            if atom.HasData(contour_tag):
                atom_display = disp.GetAtomDisplay(atom)
                layer.DrawCircle(atom_display.GetCoords(), radius, pen)

    # render molecule
    oedepict.OERenderMolecule(main_frame, disp)

    # draw color gradient

    color_opts = oegrapheme.OEColorGradientDisplayOptions()
    color_opts.SetColorStopPrecision(1)
    color_opts.AddMarkedValues(contours)
    oegrapheme.OEDrawColorGradient(legend_frame, color_gradient, color_opts)
Usage
See Download section to download the script.
> elecdensity2img --help
The following command shows how to generate Figure 1
using
1eta_ligand.pdb
and 1eta_sigma.mtz files.
> elecdensity2img --ligand 1eta_ligand.oeb --electron-density 1eta_sigma.mtz --image image.svg
Discussion
Visualizing electron density helps to evaluate the quality of protein-ligand structures. The Iridium database divides the protein-ligand structures into three categories:
Iridium-NT (not trustworthy)
Iridium-MT (moderately trustworthy)
Iridium-HT (highly trustworthy)
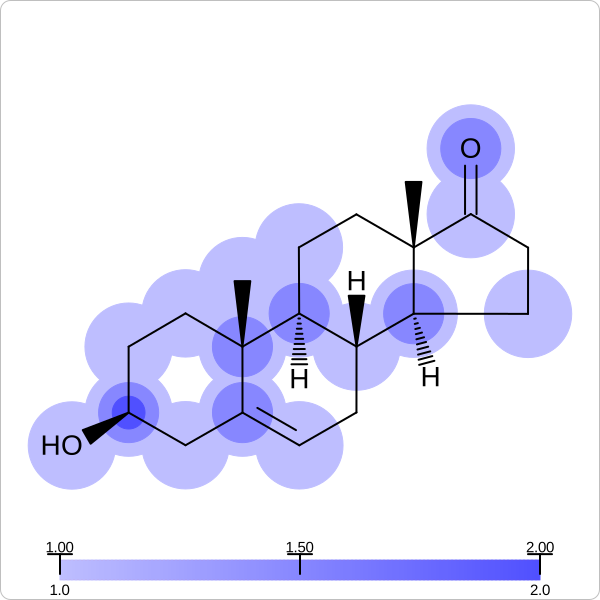
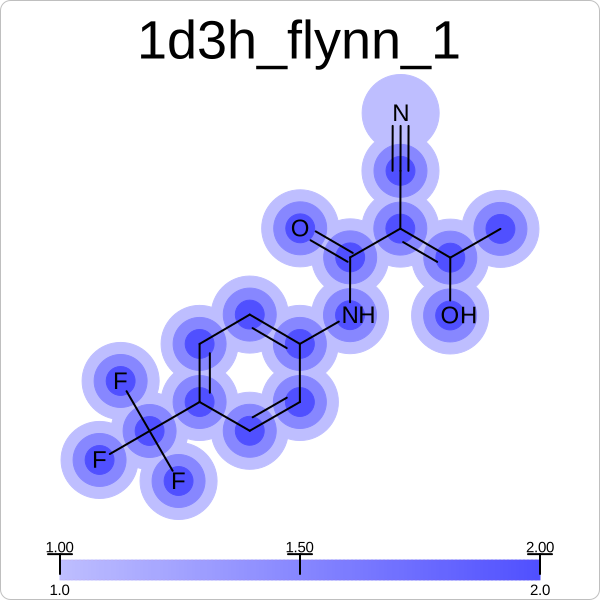
Not surprisingly the 1ETS complex (Figure 1 is considered “not trustworthy” by the Iridium database. The Table 2 shows examples from the MT and HT categories of the Iridium database
1COY - Iridium MT |
1D3H - Iridium HT |
|
|
The visualization also helps to compare the “deposited” starting models of the Iridium database with the models that are refined by AFITT. See example in Table 3.
deposited starting model |
model after AFITT refinement |
|
|
See also in OEChem TK manual
API
OEColorStop class
OELinearColorGradient class
OEMakeRegularSubGrid function
OEScalarGrid class
Theory
OEGrid Theory chapter
See also in OEDepict TK manual
Theory
Molecule Depiction chapter
API
OE2DMolDisplay class
OE2DMolDisplayOptions class
OEImage class
OEImageFrame class
OERenderMolecule function
See also in GraphemeTM TK manual
API
OEPrepareDepictionFrom3D function
OEDrawColorGradient function