Visualizing Protein-Ligand B-factor Heat Map
Problem
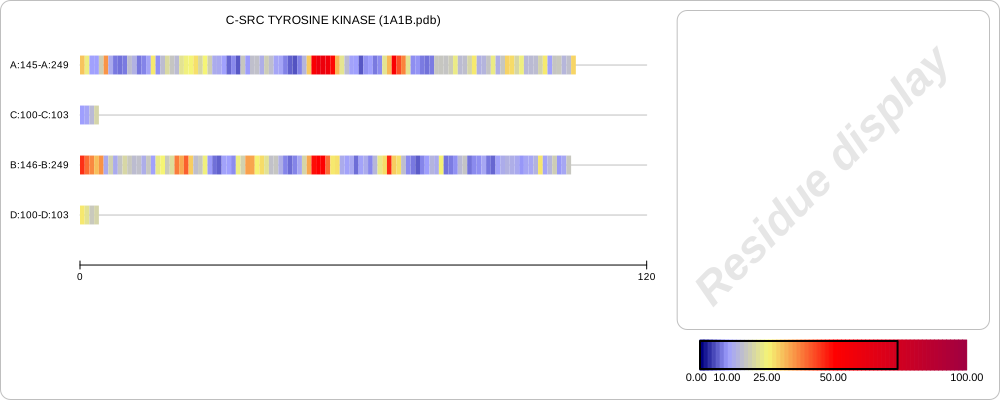
You want to visualize the B-factor of a protein-ligand complex in a heat-map style. See example in Figure 1. In the sequence chain view (on the left) each residue is colored by the average B-factors of its atoms. When hovering over a residue in the chain sequence view, the corresponding residue will appear in the residue display window (on the right). The atoms of these displayed residues are colored according to their B-factors.
The utilized color gradient is depicted at the bottom right corner of the image. Residues and atoms with high B-factor (i.e. high flexibility) are colored red, while blue color indicates low B-factors.
hover the mouse over the sequence chain to display residue B-factor
Figure 1. Example of depicting the B-factor heat-map of 2A1B complex
Ingredients
|
Difficulty level
🌶️ 🌶️ 🌶️
Download
Source Code
bfactormap2img
#!/usr/bin/env python3
# (C) 2023 Cadence Design Systems, Inc. (Cadence)
# All rights reserved.
# TERMS FOR USE OF SAMPLE CODE The software below ("Sample Code") is
# provided to current licensees or subscribers of Cadence products or
# SaaS offerings (each a "Customer").
# Customer is hereby permitted to use, copy, and modify the Sample Code,
# subject to these terms. Cadence claims no rights to Customer's
# modifications. Modification of Sample Code is at Customer's sole and
# exclusive risk. Sample Code may require Customer to have a then
# current license or subscription to the applicable Cadence offering.
# THE SAMPLE CODE IS PROVIDED "AS IS", WITHOUT WARRANTY OF ANY KIND,
# EXPRESS OR IMPLIED.  OPENEYE DISCLAIMS ALL WARRANTIES, INCLUDING, BUT
# NOT LIMITED TO, WARRANTIES OF MERCHANTABILITY, FITNESS FOR A
# PARTICULAR PURPOSE AND NONINFRINGEMENT. In no event shall Cadence be
# liable for any damages or liability in connection with the Sample Code
# or its use.

"""Depicts the B-factor of a protein-ligand complex in a "heat-map" style."""

import argparse
import io
import math
import os
import pathlib
import statistics
import sys
import uuid
from pathlib import Path

import rich.console
from openeye import oechem, oedepict, oegrapheme
from PIL import Image
from rich_argparse import HelpPreviewAction, RichHelpFormatter

__SCRIPT_NAME__ = Path(__file__).absolute().stem
__SCRIPT_DESC__ = "Depict B-factor of a protein-ligand complex in a 'heat-map' style."
__SCRIPT_TOOLKITS__ = ["oechem", "oedepict", "oegrapheme"]
__SCRIPT_KEYWORDS__ = ["bfactor", "visualization"]
__SCRIPT_CATEGORIES__ = ["visualization"]


def parse_options() -> argparse.Namespace:
    """Set up command line options."""
    parser = argparse.ArgumentParser(
        add_help=True,
        formatter_class=RichHelpFormatter,
        description="[yellow]" + __SCRIPT_DESC__ + "[/yellow]",
    )
    parser.add_argument("--help-image", action=HelpPreviewAction)

    # input options
    input_group = parser.add_argument_group("Input ligand-protein complex")
    exclusive_input_group = input_group.add_mutually_exclusive_group(required=True)
    exclusive_input_group.add_argument(
        "--complex",
        type=str,
        required=False,
        metavar="PDB-FILE",
        help="input PDB file of the ligand-protein complex",
    )
    exclusive_input_group.add_argument(
        "--design-unit",
        "--du",
        type=str,
        metavar="DU-FILE",
        help="input design unit file",
    )
    # image options
    image_group = parser.add_argument_group("Image options")
    image_group.add_argument(
        "--image",
        type=str,
        required=False,
        metavar="IMAGE-FILE",
        help="output image file (PNG, SVG) (required: %(required)s) -- if no output is provided the image will be displayed on the  screen",
    )
    image_group.add_argument(
        "--width",
        type=int,
        default=600,
        help="width of output image (default: %(default)s)",
    )
    image_group.add_argument(
        "--height",
        type=int,
        default=400,
        help="height of output image (default: %(default)s)",
    )

    viz_group = parser.add_argument_group("Visualization options")
    viz_group.add_argument(
        "--ignore-water",
        action="store_true",
        help="remove water molecule prior to depiction",
    )
    viz_group.add_argument(
        "--ignore-isolated",
        action="store_true",
        help="remove isolated atoms prior to depiction",
    )
    viz_group.add_argument(
        "--max-residues",
        type=int,
        default=200,
        help="maximum number of residues to depict in each line (default: %(default)s)",
    )

    return parser.parse_args()


def main() -> int:
    """Depict B-factor."""
    args = parse_options()

    _check_image_file(args)

    complex_mol = get_complex(args)
    console = rich.console.Console()

    image_width, image_height = 1000, 400
    image = oedepict.OEImage(image_width, image_height)

    title_frame, sequence_frame, residue_frame, color_frame = _get_main_image_frames(
        image
    )

    # # draw title
    title_font = oedepict.OEFont(
        oedepict.OEFontFamily_Default,
        oedepict.OEFontStyle_Default,
        12,
        oedepict.OEAlignment_Left,
        oechem.OEBlack,
    )
    file_name = (
        pathlib.Path(args.complex).name
        if args.complex
        else pathlib.Path(args.design_unit).name
    )
    title = f"{complex_mol.GetTitle()} ({file_name})"
    oedepict.OEDrawTextToCenter(title_frame, title, title_font)

    prepare_complex(complex_mol, args.ignore_water, args.ignore_isolated, console)

    min_value, max_value = get_min_max_bfactor(complex_mol)
    console.print(f"B-factor range [{min_value:.3f}-{max_value:.3f}]")
    if min_value == float("inf") or max_value == float("-inf"):
        oedepict.OEAddWatermark(image, "No B-factor to depict!")
        oedepict.OEWriteImage(args.image, image)
        console.print("[red] No B-factor to depict![/red]")
        return os.EX_DATAERR

    oedepict.OEAddWatermark(residue_frame, "Residue display")

    color_gradient = _get_bfactor_color_gradient()
    _draw_color_gradient(color_frame, color_gradient, min_value, max_value)

    hier_view = oechem.OEHierView(complex_mol)
    residue_groups = split_residues(hier_view, args.max_residues)

    depict_bfactor_heatmap(
        sequence_frame,
        residue_frame,
        complex_mol,
        residue_groups,
        args.max_residues,
        color_gradient,
    )

    oedepict.OEDrawCurvedBorder(residue_frame, oedepict.OELightGreyPen, 10)
    oedepict.OEDrawCurvedBorder(image, oedepict.OELightGreyPen, 10)

    if args.image:
        oedepict.OEWriteImage(args.image, image)
    else:
        _img = Image.open(io.BytesIO(oedepict.OEWriteImageToBytes("png", image)))
        _img.show()

    return os.EX_OK


def depict_bfactor_heatmap(
    image: oedepict.OEImageBase,
    residue_frame: oedepict.OEImageBase,
    protein: oechem.OEMolBase,
    residue_groups: list[list[oechem.OEHierResidue]],
    max_residues_per_line: int,
    color_gradient: oechem.OEColorGradientBase,
) -> None:
    """Depicts the residues and the b-factor heat-map."""
    nr_residue_groups = len(residue_groups)

    line_gap = image.GetHeight() * 0.85 / (nr_residue_groups + 1)
    line_gap = min(line_gap, 50.0)
    bgn_line = oedepict.OE2DPoint(80, line_gap / 2.0)
    end_line = oedepict.OE2DPoint(image.GetWidth() - 20, line_gap / 2.0)
    line_offset = oedepict.OE2DPoint(0, line_gap)

    line_length = _get_distance(bgn_line, end_line)

    res_box_width = line_length / max_residues_per_line
    res_box_height = min(line_gap / 1.5, res_box_width * 4.0)

    res_group_font = oedepict.OEFont(
        oedepict.OEFontFamily_Default,
        oedepict.OEFontStyle_Default,
        10,
        oedepict.OEAlignment_Left,
        oechem.OEBlack,
    )
    if nr_residue_groups > 20:  # noqa: PLR2004
        res_group_font.SetSize(8)

    res_font = oedepict.OEFont(
        oedepict.OEFontFamily_Default,
        oedepict.OEFontStyle_Bold,
        9,
        oedepict.OEAlignment_Center,
        oechem.OEBlack,
    )

    for res_group in residue_groups:
        image.DrawLine(bgn_line, end_line, oedepict.OELightGreyPen)

        label = _get_residue_group_label(res_group)
        image.DrawText(
            bgn_line + oedepict.OE2DPoint(-70, res_group_font.GetSize() * 0.33),
            label,
            res_group_font,
        )

        box_offset = oedepict.OE2DPoint(res_box_width, 0)
        tr_box = oedepict.OE2DPoint(bgn_line) - oedepict.OE2DPoint(
            0, res_box_height / 2.0
        )
        bl_box = oedepict.OE2DPoint(bgn_line) + oedepict.OE2DPoint(
            res_box_width, res_box_height / 2.0
        )

        for res in res_group:
            area_group, target_group = add_residue_svg_groups(image)

            avg_value = get_average_bfactor(res)
            color = color_gradient.GetColorAt(avg_value)

            # area group

            image.PushGroup(area_group)
            pen = oedepict.OEPen(
                color, color, oedepict.OEFill_On, 1.0, oedepict.OEStipple_NoLine
            )
            image.DrawRectangle(tr_box, bl_box, pen)
            image.PopGroup(area_group)

            # target group

            image.PushGroup(target_group)

            label_box_width, label_box_height = 60, 30
            label_offset = (tr_box + bl_box) / 2.0
            label_offset -= oedepict.OE2DPoint(
                label_box_width / 2.0, label_box_height * 1.2 + res_box_height / 2.0
            )
            box_frame = oedepict.OEImageFrame(
                image, label_box_width, label_box_height, label_offset
            )

            draw_residue_info_label_box(box_frame, color)

            res_label = _get_residue_label(res.GetOEResidue())
            center = oedepict.OEGetCenter(box_frame)
            box_frame.DrawText(center - oedepict.OE2DPoint(0, 3), res_label, res_font)
            box_frame.DrawText(
                center + oedepict.OE2DPoint(0, 6), f"avg: {avg_value:.2f}", res_font
            )

            depict_residue(residue_frame, protein, res, res_label, color_gradient)

            image.PopGroup(target_group)

            tr_box += box_offset
            bl_box += box_offset

        bgn_line += line_offset
        end_line += line_offset

    draw_x_axis(image, bgn_line, end_line, max_residues_per_line)


def depict_residue(
    image: oedepict.OEImageBase,
    complex_mol: oechem.OEMolBase,
    residue: oechem.OEHierResidue,
    residue__label: str,
    color_gradient: oechem.OEColorGradientBase,
) -> None:
    """Depict the given residue with b-factor."""
    residue_mol = oechem.OEGraphMol()
    residue_pred = oechem.OEAtomIsInResidue(residue.GetOEResidue())
    adjust_hcount, rgroup = False, True
    oechem.OESubsetMol(residue_mol, complex_mol, residue_pred, adjust_hcount, rgroup)
    residue_mol.SetTitle(residue__label)

    prep_opts = oedepict.OEPrepareDepictionOptions()
    prep_opts.SetDepictOrientation(oedepict.OEDepictOrientation_Vertical)
    oedepict.OEPrepareDepiction(residue_mol, prep_opts)

    disp_opts = oedepict.OE2DMolDisplayOptions(
        image.GetWidth(), image.GetHeight(), oedepict.OEScale_AutoScale
    )
    disp_opts.SetScale(oedepict.OEGetMoleculeScale(residue_mol, disp_opts) * 0.9)
    disp_opts.SetAtomColorStyle(oedepict.OEAtomColorStyle_WhiteMonochrome)
    disp = oedepict.OE2DMolDisplay(residue_mol, disp_opts)

    residue_groups = oechem.OEAtomBondSet()
    for atom_disp in disp.GetAtomDisplays():
        if not atom_disp.IsVisible():
            continue
        atom = atom_disp.GetAtom()
        if atom.GetAtomicNum() == 0 and atom.GetMapIdx() > 0:
            atom_disp.SetVisible(False)
            residue_groups.AddAtom(atom)

    diagonal = True
    zigzag_glyph = oegrapheme.OEBondGlyphZigZag(
        oedepict.OEBlackPen, 0.25, oedepict.OELayerPosition_Above, diagonal
    )

    tpen = oedepict.OEPen(
        oechem.OEWhite, oechem.OEColor(0, 0, 0, 1), oedepict.OEFill_On, 1.0
    )
    for bond_disp in disp.GetBondDisplays():
        bond = bond_disp.GetBond()
        atom_bgn = bond.GetBgn()
        atom_end = bond.GetEnd()

        if residue_groups.HasAtom(atom_bgn):
            bond_disp.SetBgnPen(tpen)
            oegrapheme.OEAddGlyph(
                disp, zigzag_glyph, oechem.OEHasBondIdx(bond.GetIdx())
            )
        if residue_groups.HasAtom(atom_end):
            bond_disp.SetEndPen(tpen)
            oegrapheme.OEAddGlyph(
                disp, zigzag_glyph, oechem.OEHasBondIdx(bond.GetIdx())
            )

    for atom_disp in disp.GetAtomDisplays():
        if not atom_disp.IsVisible():
            continue
        atom = atom_disp.GetAtom()
        if not oechem.OEHasResidue(atom):
            continue
        res = oechem.OEAtomGetResidue(atom)
        bfactor = res.GetBFactor()
        color = color_gradient.GetColorAt(bfactor)
        pen = oedepict.OEPen(color, color, oedepict.OEFill_On, 1.0)
        radius_scale = 1.2
        circle_glyph = oegrapheme.OEAtomGlyphCircle(
            pen, oegrapheme.OECircleStyle_Default, radius_scale
        )
        oegrapheme.OEAddGlyph(disp, circle_glyph, oechem.OEHasAtomIdx(atom.GetIdx()))

    oedepict.OERenderMolecule(image, disp)


def prepare_complex(
    complex_mol: oechem.OEMolBase,
    ignore_water: bool,
    ignore_isolated: bool,
    console: rich.console.Console,
) -> None:
    """Remove water and isolated atom from complex on request."""
    if ignore_water:
        waters = list(complex_mol.GetAtoms(oechem.OEIsWater()))
        if len(waters) != 0:
            console.print(f"Removing {len(waters)} waters")
            for atom in waters:
                complex_mol.DeleteAtom(atom)
    if ignore_isolated:
        isolated_atoms = list(complex_mol.GetAtoms(oechem.OEHasHvyDegree(0)))
        if len(isolated_atoms) != 0:
            console.print(f"Removing {len(isolated_atoms)} isolated atoms")
            for atom in isolated_atoms:
                complex_mol.DeleteAtom(atom)


def draw_x_axis(
    image: oedepict.OEImageBase,
    bgn_line: oedepict.OE2DPoint,
    end_line: oedepict.OE2DPoint,
    nr_residues: int,
) -> None:
    """Draw the x-axis for the residue heatmap."""
    axis_pen = oedepict.OEBlackPen
    image.DrawLine(bgn_line, end_line, oedepict.OEBlackPen)
    image.DrawLine(
        bgn_line + oedepict.OE2DPoint(0, 4),
        bgn_line - oedepict.OE2DPoint(0, 4),
        axis_pen,
    )
    image.DrawLine(
        end_line + oedepict.OE2DPoint(0, 4),
        end_line - oedepict.OE2DPoint(0, 4),
        axis_pen,
    )

    font = oedepict.OEFont(
        oedepict.OEFontFamily_Default,
        oedepict.OEFontStyle_Default,
        10,
        oedepict.OEAlignment_Center,
        oechem.OEBlack,
    )

    image.DrawText(bgn_line + oedepict.OE2DPoint(0, 15), "0", font)
    image.DrawText(end_line + oedepict.OE2DPoint(0, 15), str(nr_residues), font)


def add_residue_svg_groups(
    image: oedepict.OEImageBase,
) -> tuple[oedepict.OESVGGroup, oedepict.OESVGGroup]:
    """Add SVG groups for residue representation."""
    uniqueid = uuid.uuid4().hex

    area_group = image.NewSVGGroup("rb_a_" + uniqueid)
    target_group = image.NewSVGGroup("rb_l_" + uniqueid)
    oedepict.OEAddSVGHover(area_group, target_group)
    return area_group, target_group


def draw_residue_info_label_box(
    image: oedepict.OEImageBase, color: oechem.OEColor
) -> None:
    """Draw a label box for residue information."""
    path = oedepict.OE2DPath()
    path.AddStartPoint(oedepict.OE2DPoint(0, 0))
    path.AddLineSegment(oedepict.OE2DPoint(image.GetWidth(), 0))
    path.AddLineSegment(oedepict.OE2DPoint(image.GetWidth(), image.GetHeight()))
    path.AddLineSegment(oedepict.OE2DPoint(image.GetWidth() * 0.60, image.GetHeight()))
    path.AddLineSegment(
        oedepict.OE2DPoint(image.GetWidth() * 0.50, image.GetHeight() * 1.2)
    )
    path.AddLineSegment(oedepict.OE2DPoint(image.GetWidth() * 0.40, image.GetHeight()))
    path.AddLineSegment(oedepict.OE2DPoint(0.0, image.GetHeight()))

    pen = oedepict.OEPen(oechem.OEWhite, color, oedepict.OEFill_On, 1.0)
    image.DrawPath(path, pen)


def split_residues(
    hier_view: oechem.OEHierView, nr_residues: int
) -> list[list[oechem.OEHierResidue]]:
    """Split the residues of the chains of the protein-ligand complex into equal sizes."""
    residue_groups = []
    for chain in hier_view.GetChains():
        for frag in chain.GetFragments():
            residues: list[oechem.OEHierResidue] = list(frag.GetResidues())
            residue_slices = [
                residues[i : i + nr_residues]
                for i in range(0, len(residues), nr_residues)
            ]
            residue_groups.extend(residue_slices)
    return residue_groups


def _get_hier_residue_label(hier_res: oechem.OEHierResidue) -> str:
    res = hier_res.GetOEResidue()
    return f"{res.GetChainID()}:{res.GetResidueNumber()}"


def _get_residue_group_label(res_group: list[oechem.OEHierResidue]) -> str:
    if len(res_group) == 1:
        return _get_hier_residue_label(res_group[0])
    return (
        _get_hier_residue_label(res_group[0])
        + "-"
        + _get_hier_residue_label(res_group[-1])
    )


def _get_residue_label(residue: oechem.OEResidue) -> str:
    return f"{residue.GetName()}-{residue.GetResidueNumber()}-{residue.GetChainID()}"


def get_min_max_bfactor(mol: oechem.OEMolBase) -> tuple[float, float]:
    """Calculate the range of the b-factor."""
    min_bfactor, max_bfactor = float("inf"), float("-inf")

    for atom in mol.GetAtoms():
        if not oechem.OEHasResidue(atom):
            continue
        res = oechem.OEAtomGetResidue(atom)
        bfactor = res.GetBFactor()
        min_bfactor = min(min_bfactor, bfactor)
        max_bfactor = max(max_bfactor, bfactor)

    return min_bfactor, max_bfactor


def get_average_bfactor(hier_res: oechem.OEHierResidue) -> float:
    """Calculate the average B-factor of a residue."""
    bfactor_values = []
    for atom in hier_res.GetAtoms():
        if not oechem.OEHasResidue(atom):
            continue
        res = oechem.OEAtomGetResidue(atom)
        bfactor_values.append(res.GetBFactor())
    return statistics.mean(bfactor_values)


def _get_main_image_frames(
    image: oedepict.OEImageBase,
) -> tuple[
    oedepict.OEImageBase,
    oedepict.OEImageBase,
    oedepict.OEImageBase,
    oedepict.OEImageBase,
]:
    image_width, image_height = image.GetWidth(), image.GetHeight()

    title_frame = oedepict.OEImageFrame(
        image, image_width * (1 / 3 * 2), image_height * 0.1, oedepict.OE2DPoint(0, 0)
    )
    sequence_frame = oedepict.OEImageFrame(
        image,
        image_width * (1 / 3 * 2),
        image_height,
        oedepict.OE2DPoint(0, image_height * 0.1),
    )
    residue_frame = oedepict.OEImageFrame(
        image,
        image_width * (1 / 3) - 20,
        image_height * 0.85 - 20,
        oedepict.OE2DPoint(image_width * (1 / 3 * 2) + 10, 0 + 10),
    )
    color_frame = oedepict.OEImageFrame(
        image,
        image_width * (1 / 3),
        image_height * 0.15,
        oedepict.OE2DPoint(image_width * (1 / 3 * 2), image_height * 0.85),
    )
    return (title_frame, sequence_frame, residue_frame, color_frame)


def _get_bfactor_color_gradient() -> oechem.OEColorGradientBase:
    color_gradient = oechem.OELinearColorGradient()

    color_gradient.AddStop(oechem.OEColorStop(0.0, oechem.OEDarkBlue))
    color_gradient.AddStop(oechem.OEColorStop(10.0, oechem.OELightBlue))
    color_gradient.AddStop(oechem.OEColorStop(25.0, oechem.OEYellowTint))
    color_gradient.AddStop(oechem.OEColorStop(50.0, oechem.OERed))
    color_gradient.AddStop(oechem.OEColorStop(100.0, oechem.OEDarkRose))
    return color_gradient


def _draw_color_gradient(
    image: oedepict.OEImageBase,
    color_gradient: oechem.OEColorGradientBase,
    min_value: float,
    max_value: float,
) -> None:
    copts = oegrapheme.OEColorGradientDisplayOptions()
    copts.SetColorStopPrecision(2)
    min_value = max(min_value, color_gradient.GetMinValue())
    max_value = min(max_value, color_gradient.GetMaxValue())
    copts.SetBoxRange(min_value, max_value)
    oegrapheme.OEDrawColorGradient(image, color_gradient, copts)


def _get_distance(p_a: oedepict.OE2DPoint, p_b: oedepict.OE2DPoint) -> float:
    dx = p_a.GetX() - p_b.GetX()
    dy = p_a.GetY() - p_b.GetY()
    return math.sqrt(dx * dx + dy * dy)


def get_complex(args: argparse.Namespace) -> oechem.OEMolBase:
    """Read complex from from pdb/cif file or design unit file."""
    complex_mol = oechem.OEGraphMol()
    if args.complex:
        ifs = oechem.oemolistream()
        if not ifs.open(args.complex):
            oechem.OEThrow.Fatal(f"Unable to open {args.complex} for reading")
        if not oechem.OEReadMolecule(ifs, complex_mol):
            oechem.OEThrow.Fatal(f"Unable to read complex from {args.complex}")

        if not oechem.OEHasResidues(complex_mol):
            oechem.OEPerceiveResidues(complex_mol, oechem.OEPreserveResInfo_All)
        return complex_mol

    if args.design_unit:
        du = oechem.OEDesignUnit()
        if not oechem.OEIsReadableDesignUnit(
            args.design_unit
        ) or not oechem.OEReadDesignUnit(args.design_unit, du):
            oechem.OEThrow.Fatal(f"Cannot read design unit from {args.design_unit}.")

        if not du.GetComponents(
            complex_mol,
            oechem.OEDesignUnitComponents_TargetComplex
            | oechem.OEDesignUnitComponents_Ligand,
        ):
            oechem.OEThrow.Fatal(
                "Could not extract protein and ligand from the design unit."
            )

    return complex_mol


def _check_image_file(args: argparse.Namespace) -> None:
    # script will terminate if there is some issues
    if not args.image:
        # image will be displayed on the screen
        return
    ext = Path(args.image).suffix[1:].upper()
    if not oedepict.OEIsRegisteredImageFile(ext):
        oechem.OEThrow.Fatal("Unknown image output type!")

    ofs = oechem.oeofstream()
    if not ofs.open(args.image):
        oechem.OEThrow.Fatal("Cannot open output image file!")


setattr(main, "__SCRIPT_NAME__", __SCRIPT_NAME__)
setattr(main, "__SCRIPT_DESC__", __SCRIPT_DESC__)
setattr(main, "__SCRIPT_TOOLKITS__", __SCRIPT_TOOLKITS__)
setattr(main, "__SCRIPT_KEYWORDS__", __SCRIPT_KEYWORDS__)
setattr(main, "__SCRIPT_CATEGORIES__", __SCRIPT_CATEGORIES__)

if __name__ == "__main__":
    sys.exit(main())
Solution
The depict_bfactor_heatmap function shows how to generate the color coded sequence view with hover mode: It takes groups of residues that are split into equal sizes by the split_residues function. These residues are then visualized in a sequence view:
First the parameters are calculated that determine the layout of the sequence view and the font that is used to render information.
Then iterating over the pre-chunked residue groups the label for each sequence line is rendered.
The inside loop iterates over the residues of each group and rendering a rectangle for each residue when the color of the rectangle indicates the average B-factors of the residue atoms.
For each residue, two SVG groups are generated to accomplish the hover effect. The rectangle representing the residue in the sequence view is drawn into a group called area group (See also OEAddSVGHover function). When hovering the mouse over objects drawn inside the area group the objects drawn in the second group, called target group, will pop up. In this example, both the residue label box and the residue molecule (rendered by depict_residue) are drawn inside the target group. Everything that is rendered between the OEImageBase.PushGroup and the corresponding OEImageBase.PopGroup methods is considered “inside” a group.
def depict_bfactor_heatmap(
    image: oedepict.OEImageBase,
    residue_frame: oedepict.OEImageBase,
    protein: oechem.OEMolBase,
    residue_groups: list[list[oechem.OEHierResidue]],
    max_residues_per_line: int,
    color_gradient: oechem.OEColorGradientBase,
) -> None:
    """Depicts the residues and the b-factor heat-map."""
    nr_residue_groups = len(residue_groups)

    line_gap = image.GetHeight() * 0.85 / (nr_residue_groups + 1)
    line_gap = min(line_gap, 50.0)
    bgn_line = oedepict.OE2DPoint(80, line_gap / 2.0)
    end_line = oedepict.OE2DPoint(image.GetWidth() - 20, line_gap / 2.0)
    line_offset = oedepict.OE2DPoint(0, line_gap)

    line_length = _get_distance(bgn_line, end_line)

    res_box_width = line_length / max_residues_per_line
    res_box_height = min(line_gap / 1.5, res_box_width * 4.0)

    res_group_font = oedepict.OEFont(
        oedepict.OEFontFamily_Default,
        oedepict.OEFontStyle_Default,
        10,
        oedepict.OEAlignment_Left,
        oechem.OEBlack,
    )
    if nr_residue_groups > 20:  # noqa: PLR2004
        res_group_font.SetSize(8)

    res_font = oedepict.OEFont(
        oedepict.OEFontFamily_Default,
        oedepict.OEFontStyle_Bold,
        9,
        oedepict.OEAlignment_Center,
        oechem.OEBlack,
    )

    for res_group in residue_groups:
        image.DrawLine(bgn_line, end_line, oedepict.OELightGreyPen)

        label = _get_residue_group_label(res_group)
        image.DrawText(
            bgn_line + oedepict.OE2DPoint(-70, res_group_font.GetSize() * 0.33),
            label,
            res_group_font,
        )

        box_offset = oedepict.OE2DPoint(res_box_width, 0)
        tr_box = oedepict.OE2DPoint(bgn_line) - oedepict.OE2DPoint(
            0, res_box_height / 2.0
        )
        bl_box = oedepict.OE2DPoint(bgn_line) + oedepict.OE2DPoint(
            res_box_width, res_box_height / 2.0
        )

        for res in res_group:
            area_group, target_group = add_residue_svg_groups(image)

            avg_value = get_average_bfactor(res)
            color = color_gradient.GetColorAt(avg_value)

            # area group

            image.PushGroup(area_group)
            pen = oedepict.OEPen(
                color, color, oedepict.OEFill_On, 1.0, oedepict.OEStipple_NoLine
            )
            image.DrawRectangle(tr_box, bl_box, pen)
            image.PopGroup(area_group)

            # target group

            image.PushGroup(target_group)

            label_box_width, label_box_height = 60, 30
            label_offset = (tr_box + bl_box) / 2.0
            label_offset -= oedepict.OE2DPoint(
                label_box_width / 2.0, label_box_height * 1.2 + res_box_height / 2.0
            )
            box_frame = oedepict.OEImageFrame(
                image, label_box_width, label_box_height, label_offset
            )

            draw_residue_info_label_box(box_frame, color)

            res_label = _get_residue_label(res.GetOEResidue())
            center = oedepict.OEGetCenter(box_frame)
            box_frame.DrawText(center - oedepict.OE2DPoint(0, 3), res_label, res_font)
            box_frame.DrawText(
                center + oedepict.OE2DPoint(0, 6), f"avg: {avg_value:.2f}", res_font
            )

            depict_residue(residue_frame, protein, res, res_label, color_gradient)

            image.PopGroup(target_group)

            tr_box += box_offset
            bl_box += box_offset

        bgn_line += line_offset
        end_line += line_offset

    draw_x_axis(image, bgn_line, end_line, max_residues_per_line)
The depict_residue function shows how to depict residues with color coded atom B-factors:
First, the residue is extracted from the protein, 2D coordinates are generated, and a monochrome molecule display is created.
Next, the residue’s R-group atoms are identified and set to be invisible.
Every bond connected to an R-group atom is then marked with a zigzag line.
Finally, a colored circle is drawn beneath each atom in the molecule display to indicate its corresponding B-factor.
def depict_residue(
    image: oedepict.OEImageBase,
    complex_mol: oechem.OEMolBase,
    residue: oechem.OEHierResidue,
    residue__label: str,
    color_gradient: oechem.OEColorGradientBase,
) -> None:
    """Depict the given residue with b-factor."""
    residue_mol = oechem.OEGraphMol()
    residue_pred = oechem.OEAtomIsInResidue(residue.GetOEResidue())
    adjust_hcount, rgroup = False, True
    oechem.OESubsetMol(residue_mol, complex_mol, residue_pred, adjust_hcount, rgroup)
    residue_mol.SetTitle(residue__label)

    prep_opts = oedepict.OEPrepareDepictionOptions()
    prep_opts.SetDepictOrientation(oedepict.OEDepictOrientation_Vertical)
    oedepict.OEPrepareDepiction(residue_mol, prep_opts)

    disp_opts = oedepict.OE2DMolDisplayOptions(
        image.GetWidth(), image.GetHeight(), oedepict.OEScale_AutoScale
    )
    disp_opts.SetScale(oedepict.OEGetMoleculeScale(residue_mol, disp_opts) * 0.9)
    disp_opts.SetAtomColorStyle(oedepict.OEAtomColorStyle_WhiteMonochrome)
    disp = oedepict.OE2DMolDisplay(residue_mol, disp_opts)

    residue_groups = oechem.OEAtomBondSet()
    for atom_disp in disp.GetAtomDisplays():
        if not atom_disp.IsVisible():
            continue
        atom = atom_disp.GetAtom()
        if atom.GetAtomicNum() == 0 and atom.GetMapIdx() > 0:
            atom_disp.SetVisible(False)
            residue_groups.AddAtom(atom)

    diagonal = True
    zigzag_glyph = oegrapheme.OEBondGlyphZigZag(
        oedepict.OEBlackPen, 0.25, oedepict.OELayerPosition_Above, diagonal
    )

    tpen = oedepict.OEPen(
        oechem.OEWhite, oechem.OEColor(0, 0, 0, 1), oedepict.OEFill_On, 1.0
    )
    for bond_disp in disp.GetBondDisplays():
        bond = bond_disp.GetBond()
        atom_bgn = bond.GetBgn()
        atom_end = bond.GetEnd()

        if residue_groups.HasAtom(atom_bgn):
            bond_disp.SetBgnPen(tpen)
            oegrapheme.OEAddGlyph(
                disp, zigzag_glyph, oechem.OEHasBondIdx(bond.GetIdx())
            )
        if residue_groups.HasAtom(atom_end):
            bond_disp.SetEndPen(tpen)
            oegrapheme.OEAddGlyph(
                disp, zigzag_glyph, oechem.OEHasBondIdx(bond.GetIdx())
            )

    for atom_disp in disp.GetAtomDisplays():
        if not atom_disp.IsVisible():
            continue
        atom = atom_disp.GetAtom()
        if not oechem.OEHasResidue(atom):
            continue
        res = oechem.OEAtomGetResidue(atom)
        bfactor = res.GetBFactor()
        color = color_gradient.GetColorAt(bfactor)
        pen = oedepict.OEPen(color, color, oedepict.OEFill_On, 1.0)
        radius_scale = 1.2
        circle_glyph = oegrapheme.OEAtomGlyphCircle(
            pen, oegrapheme.OECircleStyle_Default, radius_scale
        )
        oegrapheme.OEAddGlyph(disp, circle_glyph, oechem.OEHasAtomIdx(atom.GetIdx()))

    oedepict.OERenderMolecule(image, disp)
The split_residues function iterates over the chains of the OEHierView and splits the residues into equal sizes.
def split_residues(
    hier_view: oechem.OEHierView, nr_residues: int
) -> list[list[oechem.OEHierResidue]]:
    """Split the residues of the chains of the protein-ligand complex into equal sizes."""
    residue_groups = []
    for chain in hier_view.GetChains():
        for frag in chain.GetFragments():
            residues: list[oechem.OEHierResidue] = list(frag.GetResidues())
            residue_slices = [
                residues[i : i + nr_residues]
                for i in range(0, len(residues), nr_residues)
            ]
            residue_groups.extend(residue_slices)
    return residue_groups
Usage
See Download section to download the script.
> bfactorheatmap2img --help
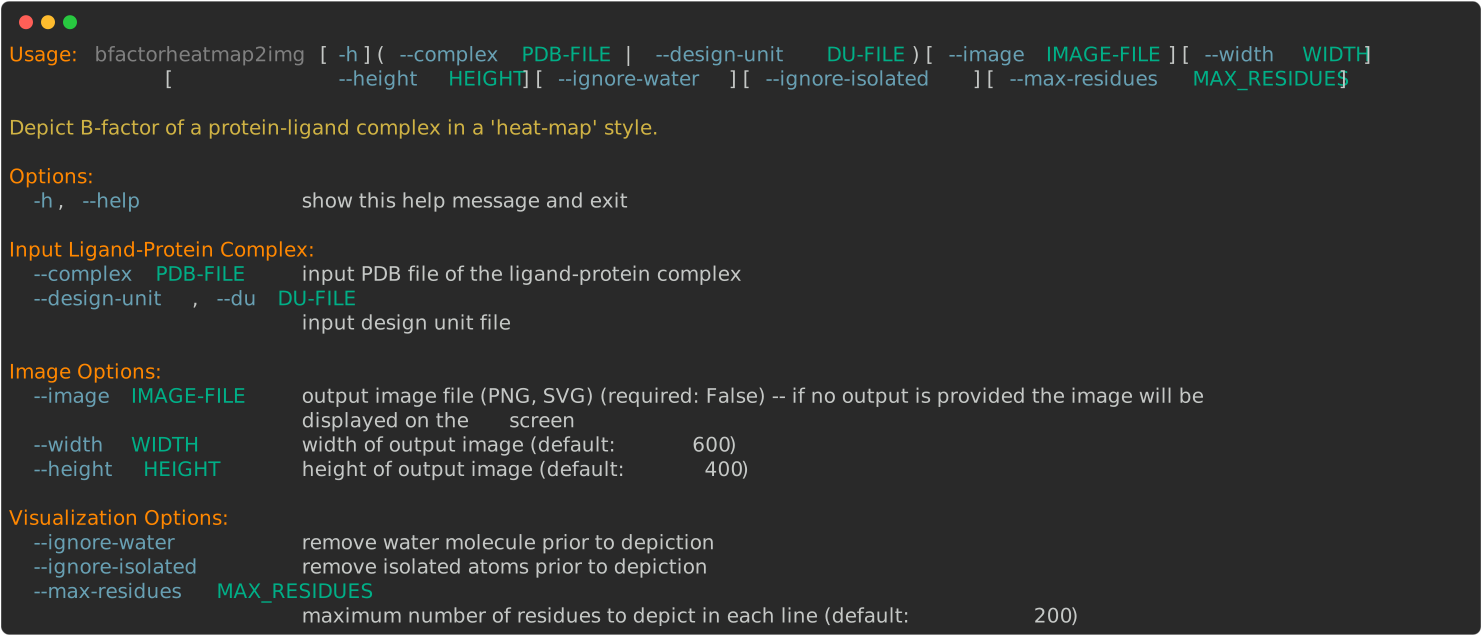
The following commands will generate the image shown in
Figure 1 for the input file
1A1B.pdb
> bfactorheatmap2img --max-residues 120 --ignore-water --complex 1A1B.pdb --image image.svg
Discussion
See Discussion subsection of the Visualizing Protein-Ligand B-factor recipe.
See also in OEChem TK manual
Theory
Biopolymers chapter
Protein Preparation chapter
API
OEAtomGetResidue function
OEAtomIsInResidue predicate
OEHasResidue function
OELinearColorGradient class
OEHierChain class
OEHierResidue class
OEHierView class
OEIsWater predicate
OEResidue class
OESubsetMol function
See also in OEDepict TK manual
Theory
Molecule Depiction chapter
API
OE2DMolDisplay class
OE2DMolDisplayOptions class
OE2DPath class
OEAddSVGHover function
OEAddWatermark function
OEDrawTextToCenter function
OEFont class
OEImage class
OEImageFrame class
OEPen class
OEPrepareDepiction function
OERenderMolecule function
See also in GraphemeTM TK manual
API
OEAddGlyph function
OEAtomGlyphCircle class
OEBondGlyphZigZag class
OEDrawColorGradient function
OEDrawColorGradient function