Depicting Molecular Properties
Problem
You want to visualize molecules with their properties in order to identify the ones that can be considered as drug-like. In this example, five such properties are calculated and color coded in a property pie (see example in Table 1):
MW – molecular weight
XLogP – octanol/water partition coefficient
TPSA – topological polar surface area
Sol – solubility
Rof5 – Lipinski rules [Lipinski-1997]
When hovering over the slices of the property pie, more information can be revealed about the properties (and the color gradients that are used to visualize them). Each property is colored similarly: red color indicates that the property is outside the desired range, while green color indicates drug-likeness.
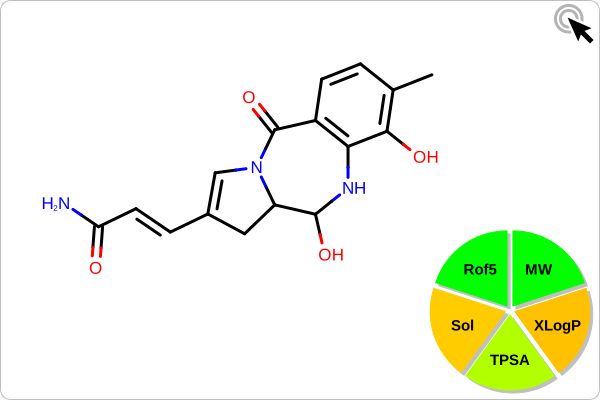
|
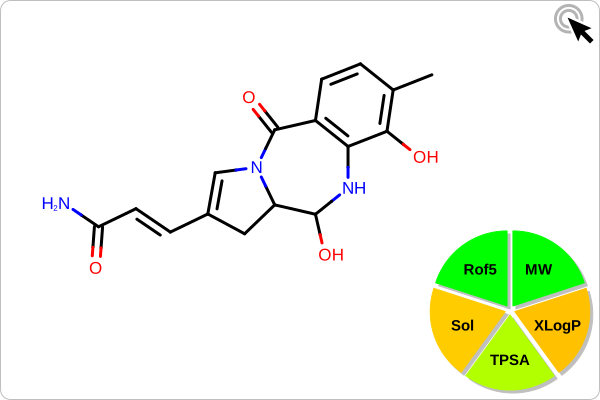
|
Ingredients
|
Difficulty level
🌶️ 🌶️ 🌶️
Download
Source Code
properties2img
#!/usr/bin/env python3
# (C) 2026 Cadence Design Systems, Inc. (Cadence)
# All rights reserved.
# TERMS FOR USE OF SAMPLE CODE The software below ("Sample Code") is
# provided to current licensees or subscribers of Cadence products or
# SaaS offerings (each a "Customer").
# Customer is hereby permitted to use, copy, and modify the Sample Code,
# subject to these terms. Cadence claims no rights to Customer's
# modifications. Modification of Sample Code is at Customer's sole and
# exclusive risk. Sample Code may require Customer to have a then
# current license or subscription to the applicable Cadence offering.
# THE SAMPLE CODE IS PROVIDED "AS IS", WITHOUT WARRANTY OF ANY KIND,
# EXPRESS OR IMPLIED.  OPENEYE DISCLAIMS ALL WARRANTIES, INCLUDING, BUT
# NOT LIMITED TO, WARRANTIES OF MERCHANTABILITY, FITNESS FOR A
# PARTICULAR PURPOSE AND NONINFRINGEMENT. In no event shall Cadence be
# liable for any damages or liability in connection with the Sample Code
# or its use.

"""Depict a molecule with interactive property pie chart and color gradients."""

import argparse
import io
import math
import os
import pathlib
import sys

from openeye import oechem, oedepict, oegrapheme, oemolprop
from PIL import Image
from rich_argparse import HelpPreviewAction, RichHelpFormatter

__SCRIPT_NAME__ = pathlib.Path(__file__).absolute().stem
__SCRIPT_DESC__ = (
    "Depict a molecule with interactive property pie chart and color gradients."
)
__SCRIPT_TOOLKITS__ = ["oechem", "oedepict", "oegrapheme", "oemolprop"]
__SCRIPT_CATEGORIES__ = ["depiction"]


def parse_args() -> argparse.Namespace:
    """Parse command-line arguments."""
    parser = argparse.ArgumentParser(
        add_help=True,
        formatter_class=RichHelpFormatter,
        description="[yellow]" + __SCRIPT_DESC__ + "[/yellow]",
    )

    input_group = parser.add_argument_group("Input options")
    input_group.add_argument(
        "--mol",
        type=str,
        required=True,
        metavar="MOL-FILE",
        help="input molecule file",
    )

    image_group = parser.add_argument_group("Image options")
    image_group.add_argument(
        "--image",
        type=str,
        required=False,
        metavar="IMAGE-FILE",
        help="output image file (SVG)",
    )

    image_group.add_argument(
        "--width",
        type=int,
        default=800,
        help="width of output image (default: %(default)s)",
    )
    image_group.add_argument(
        "--height",
        type=int,
        default=600,
        help="height of output image (default: %(default)s)",
    )

    display_group = parser.add_argument_group("Display options")
    display_group.add_argument(
        "--color-gradient",
        action="store_true",
        help="display property value on color gradient (default: %(default)s)",
    )

    parser.add_argument("--help-image", action=HelpPreviewAction)
    return parser.parse_args()


def main() -> int:
    """Depict a molecule with interactive property pie chart and color gradients."""
    args = parse_args()
    _check_image_file(args)

    input_stream = oechem.oemolistream()
    if not input_stream.open(args.mol):
        oechem.OEThrow.Fatal("Cannot open input file!")

    mol = oechem.OEGraphMol()
    if not oechem.OEReadMolecule(input_stream, mol):
        oechem.OEThrow.Fatal("Cannot read input file!")

    width, height = args.width, args.height
    opts = oedepict.OE2DMolDisplayOptions(width, height, oedepict.OEScale_AutoScale)
    opts.SetMargin(oedepict.OEMargin_Right, 25.0)
    opts.SetMargin(oedepict.OEMargin_Bottom, 20.0)
    opts.SetBondWidthScaling(True)

    clear_coords, suppress_h = True, True
    prep_opts = oedepict.OEPrepareDepictionOptions(clear_coords, suppress_h)
    prep_opts.SetDepictOrientation(oedepict.OEDepictOrientation_Horizontal)
    oedepict.OEPrepareDepiction(mol, prep_opts)

    prop_displays = _get_property_displays()
    set_properties(mol, prop_displays)

    image = oedepict.OEImage(width, height)
    render_properties(image, mol, opts, prop_displays, args.color_gradient)
    oedepict.OEDrawCurvedBorder(image, oedepict.OELightGreyPen, 10.0)

    if args.image:
        if args.image.lower().endswith(".svg"):
            icon_scale = 0.5
            oedepict.OEAddInteractiveIcon(
                image, oedepict.OEIconLocation_TopRight, icon_scale
            )
        oedepict.OEWriteImage(args.image, image)
    else:
        _img = Image.open(io.BytesIO(oedepict.OEWriteImageToBytes("png", image)))
        _img.show()

    return os.EX_OK


class OEPropertyDisplay:
    """Container for a single molecule property display configuration."""

    def __init__(
        self,
        prop_id: str,
        label: str,
        filter_name: bytes,
        color_gradient: oechem.OELinearColorGradient,
        value_dict: dict[str, int] | None = None,
    ) -> None:
        """Initialize a property display configuration."""
        self._id = prop_id
        self._label = label
        self._filter_name = filter_name
        self._color_gradient = oechem.OELinearColorGradient(color_gradient)
        self._orig_value: str | None = None
        self._value: float | None = None
        self._value_dict = value_dict

    def __str__(self) -> str:
        """Return a string representation of the property display."""
        return f"{self._label} = {self._value}"

    def get_id(self) -> str:
        """Return the property identifier."""
        return self._id

    def get_label(self) -> str:
        """Return the display label."""
        return self._label

    def get_filter_name(self) -> bytes:
        """Return the OEFilter field name."""
        return self._filter_name

    def set_value(self, value: str) -> None:
        """Set the property value from a filter output string."""
        self._orig_value = value
        if self._value_dict is not None:
            self._value = float(self._value_dict[value])
        else:
            self._value = float(value)

    def get_orig_value(self) -> str | None:
        """Return the original string value."""
        return self._orig_value

    def get_value(self) -> float | None:
        """Return the numeric property value."""
        return self._value

    def get_color_gradient(self) -> oechem.OELinearColorGradient:
        """Return the color gradient for this property."""
        return self._color_gradient

    def get_color(self) -> oechem.OEColor:
        """Return the color corresponding to the current value."""
        if self.get_value() is None:
            return oechem.OEWhite
        return self._color_gradient.GetColorAt(self.get_value())

    def get_pie_pen(self) -> oedepict.OEPen:
        """Return a filled pen for drawing the pie slice."""
        color = self.get_color()
        return oedepict.OEPen(color, color, oedepict.OEFill_On, 1.0)

    def get_label_border_pen(self) -> oedepict.OEPen:
        """Return a pen for drawing the label border."""
        color = self.get_color()
        return oedepict.OEPen(oechem.OEWhite, color, oedepict.OEFill_On, 3.0)


def render_properties(
    image: oedepict.OEImageBase,
    mol: oechem.OEMolBase,
    opts: oedepict.OE2DMolDisplayOptions,
    properties: list[OEPropertyDisplay],
    color_gradient: bool,
) -> None:
    """
    Render molecule with an interactive property pie chart overlay.

    Draws the molecule into the image, then overlays an interactive pie chart
    showing molecular properties. Hovering over a pie slice displays
    the property value either as a color gradient or as a text label.
    """
    disp = oedepict.OE2DMolDisplay(mol, opts)
    oedepict.OERenderMolecule(image, disp)

    image_w, image_h = image.GetWidth(), image.GetHeight()

    pie_frame_size = opts.GetMargin(oedepict.OEMargin_Right) * image_w / 100.0
    pie_frame = oedepict.OEImageFrame(
        image,
        pie_frame_size,
        pie_frame_size,
        oedepict.OE2DPoint(
            image_w - pie_frame_size * 1.1, image_h - pie_frame_size * 1.1
        ),
    )

    color_frame_w = image_w - pie_frame.GetWidth() * 1.25
    color_frame_h = opts.GetMargin(oedepict.OEMargin_Bottom) * 0.75 * image_h / 100.0
    color_frame = oedepict.OEImageFrame(
        image,
        color_frame_w,
        color_frame_h,
        oedepict.OE2DPoint(10.0, image_h - color_frame_h - 10.0),
    )

    center = oedepict.OEGetCenter(pie_frame)
    radius = pie_frame_size / 2.0

    inc_angle = 360.0 / len(properties)
    bgn_angle = 0.0

    group_prefix = "property_hover_"
    for prop in properties:
        area_group = image.NewSVGGroup(prop.get_id())
        hover_group = image.NewSVGGroup(group_prefix + prop.get_id())
        oedepict.OEAddSVGHover(area_group, hover_group)

        image.PushGroup(area_group)
        _draw_property_pie(
            pie_frame, prop, center, bgn_angle, bgn_angle + inc_angle, radius
        )
        image.PopGroup(area_group)

        image.PushGroup(hover_group)
        label_text = f"{prop.get_label()} = {prop.get_orig_value()}"
        if color_gradient:
            _draw_property_color_gradient(color_frame, prop, label_text)
        else:
            _draw_property_label(image, prop, label_text)
        image.PopGroup(hover_group)

        bgn_angle += inc_angle


def _draw_property_color_gradient(
    image: oedepict.OEImageBase,
    prop: OEPropertyDisplay,
    label_text: str,
) -> None:
    """Draw the property value on a color gradient bar."""
    opts = oegrapheme.OEColorGradientDisplayOptions()
    opts.SetColorStopPrecision(1)
    opts.SetColorStopLabelFontScale(0.5)
    opts.AddLabel(oegrapheme.OEColorGradientLabel(prop.get_value(), label_text))
    oegrapheme.OEDrawColorGradient(image, prop.get_color_gradient(), opts)


def _draw_property_label(
    image: oedepict.OEImageBase,
    prop: OEPropertyDisplay,
    label_text: str,
) -> None:
    """Draw the property value as a text label."""
    font = oedepict.OEFont(
        oedepict.OEFontFamily_Default,
        oedepict.OEFontStyle_Bold,
        18,
        oedepict.OEAlignment_Center,
        oechem.OEBlack,
    )
    label = oedepict.OEHighlightLabel(label_text, font)
    label.SetFont(font)
    label.SetBoundingBoxPen(prop.get_label_border_pen())
    label_pos = oedepict.OE2DPoint(image.GetWidth() / 2.0, image.GetHeight() - 25.0)
    oedepict.OEAddLabel(image, label_pos, label)


def _draw_property_pie(
    image: oedepict.OEImageBase,
    prop: OEPropertyDisplay,
    center: oedepict.OE2DPoint,
    bgn_angle: float,
    end_angle: float,
    radius: float,
) -> None:
    """Draw a single pie slice for a property."""
    pos = _get_pie_label_position(center, bgn_angle, end_angle, radius / 10.0)
    shadow_offset = oedepict.OE2DPoint(3.0, 3.0)

    image.DrawPie(
        pos + shadow_offset, bgn_angle, end_angle, radius, oedepict.OELightGreyBoxPen
    )
    image.DrawPie(pos, bgn_angle, end_angle, radius, prop.get_pie_pen())

    label_text = prop.get_id()
    font_size = int(radius / 5)
    font = oedepict.OEFont(
        oedepict.OEFontFamily_Default,
        oedepict.OEFontStyle_Bold,
        font_size,
        oedepict.OEAlignment_Center,
        oechem.OEBlack,
    )

    label = oedepict.OEHighlightLabel(label_text, font)
    label.SetBoundingBoxPen(oedepict.OETransparentPen)

    text_center = _get_pie_label_position(center, bgn_angle, end_angle, radius)
    oedepict.OEAddLabel(image, text_center, label)


def _get_pie_label_position(
    center: oedepict.OE2DPoint,
    bgn_angle: float,
    end_angle: float,
    radius: float,
) -> oedepict.OE2DPoint:
    """Compute the label position for a pie slice."""
    p = oedepict.OE2DPoint(0.0, -radius / 1.5)
    mid_angle = (bgn_angle + end_angle) / 2.0
    rad = math.radians(mid_angle)
    cos_rad = math.cos(rad)
    sin_rad = math.sin(rad)
    return center + oedepict.OE2DPoint(
        cos_rad * p.GetX() - sin_rad * p.GetY(),
        sin_rad * p.GetX() + cos_rad * p.GetY(),
    )


def set_properties(mol: oechem.OEMolBase, properties: list[OEPropertyDisplay]) -> None:
    """Compute molecular properties using OEFilter and assign values."""
    ifs = oechem.oeisstream(_get_filter_rules())
    mol_filter = oemolprop.OEFilter(ifs)

    level = oechem.OEThrow.GetLevel()
    oechem.OEThrow.SetLevel(oechem.OEErrorLevel_Warning)

    output_str = oechem.oeosstream()
    pwnd = False
    mol_filter.SetTable(output_str, pwnd)

    headers = output_str.str().split(b"\t")
    output_str.clear()

    mol_filter(mol)

    fields = output_str.str().decode("UTF-8").split("\t")
    output_str.clear()

    filter_dict = dict(zip(headers, fields, strict=False))

    for prop in properties:
        if prop.get_filter_name() in filter_dict:
            prop.set_value(filter_dict[prop.get_filter_name()])

    oechem.OEThrow.SetLevel(level)


def _get_filter_rules() -> str:
    """Return the OEFilter rules string for property computation."""
    return """
# This file defines the rules for filtering multi-structure files based on
# properties and substructure patterns.

MIN_MOLWT      130       "Minimum molecular weight"
MAX_MOLWT      781       "Maximum molecular weight"

MIN_XLOGP      -3.0      "Minimum XLogP"
MAX_XLOGP       6.85     "Maximum XLogP"

PSA_USE_SandP   false    "Count S and P as polar atoms"
MIN_2D_PSA      0.0      "Minimum 2-Dimensional (SMILES) Polar Surface Area"
MAX_2D_PSA      205.0    "Maximum 2-Dimensional (SMILES) Polar Surface Area"

# choices are insoluble<poorly<moderately<soluble<very<highly
MIN_SOLUBILITY insoluble "Minimum solubility"

MIN_LIPINSKI_DONORS  0      "Minimum number of hydrogens on O & N atoms"
MAX_LIPINSKI_DONORS  6      "Maximum number of hydrogens on O & N atoms"

MIN_LIPINSKI_ACCEPTORS  1   "Minimum number of oxygen & nitrogen atoms"
MAX_LIPINSKI_ACCEPTORS  14  "Maximum number of oxygen & nitrogen atoms"

MAX_LIPINSKI   3         "Maximum number of Lipinski violations"
"""


def _get_property_displays() -> list[OEPropertyDisplay]:
    """Build the list of property display configurations."""
    sol_dict = {
        "insoluble": 1,
        "poorly": 2,
        "moderately": 3,
        "soluble": 4,
        "very": 5,
        "highly": 6,
    }

    return [
        OEPropertyDisplay(
            "MW",
            "Molecular weight",
            b"molecular weight",
            _get_mol_weight_color_gradient(),
        ),
        OEPropertyDisplay("XLogP", "XLogP", b"XLogP", _get_xlogp_color_gradient()),
        OEPropertyDisplay(
            "TPSA", "Topological PSA", b"2d PSA", _get_tpsa_color_gradient()
        ),
        OEPropertyDisplay(
            "Sol",
            "Solubility",
            b"Solubility",
            _get_solubility_color_gradient(),
            sol_dict,
        ),
        OEPropertyDisplay(
            "Rof5",
            "Rule of five",
            b"Lipinski violations",
            _get_lipinski_color_gradient(),
        ),
    ]


def _get_mol_weight_color_gradient() -> oechem.OELinearColorGradient:
    """Return color gradient for molecular weight."""
    mol_weight_mean = 314.0
    mol_weight_sigma = 128

    color_gradient = oechem.OELinearColorGradient()
    color_gradient.AddStop(oechem.OEColorStop(0.0, oechem.OERed))
    color_gradient.AddStop(oechem.OEColorStop(mol_weight_mean / 2.0, oechem.OEYellow))
    color_gradient.AddStop(oechem.OEColorStop(mol_weight_mean, oechem.OEGreen))
    color_gradient.AddStop(
        oechem.OEColorStop(mol_weight_mean + 1.5 * mol_weight_sigma, oechem.OEYellow)
    )
    color_gradient.AddStop(
        oechem.OEColorStop(mol_weight_mean + 3 * mol_weight_sigma, oechem.OERed)
    )

    return color_gradient


def _get_xlogp_color_gradient() -> oechem.OELinearColorGradient:
    """Return color gradient for XLogP."""
    log_p_mean = 2.472
    log_p_sigma = 2.013

    color_gradient = oechem.OELinearColorGradient()
    color_gradient.AddStop(
        oechem.OEColorStop(log_p_mean - 3 * log_p_sigma, oechem.OERed)
    )
    color_gradient.AddStop(
        oechem.OEColorStop(log_p_mean - 1.5 * log_p_sigma, oechem.OEYellow)
    )
    color_gradient.AddStop(oechem.OEColorStop(log_p_mean, oechem.OEGreen))
    color_gradient.AddStop(
        oechem.OEColorStop(log_p_mean + 1.5 * log_p_sigma, oechem.OEYellow)
    )
    color_gradient.AddStop(
        oechem.OEColorStop(log_p_mean + 3 * log_p_sigma, oechem.OERed)
    )

    return color_gradient


def _get_tpsa_color_gradient() -> oechem.OELinearColorGradient:
    """Return color gradient for topological PSA."""
    t_psa_mean = 62.8
    t_psa_sigma = 50.5

    color_gradient = oechem.OELinearColorGradient()
    color_gradient.AddStop(oechem.OEColorStop(0.0, oechem.OERed))
    color_gradient.AddStop(oechem.OEColorStop(t_psa_mean / 2.0, oechem.OEYellow))
    color_gradient.AddStop(oechem.OEColorStop(t_psa_mean, oechem.OEGreen))
    color_gradient.AddStop(
        oechem.OEColorStop(t_psa_mean + 1.5 * t_psa_sigma, oechem.OEYellow)
    )
    color_gradient.AddStop(
        oechem.OEColorStop(t_psa_mean + 3 * t_psa_sigma, oechem.OERed)
    )

    return color_gradient


def _get_solubility_color_gradient() -> oechem.OELinearColorGradient:
    """Return color gradient for solubility."""
    color_gradient = oechem.OELinearColorGradient()
    color_gradient.AddStop(oechem.OEColorStop(1.0, oechem.OERed))
    color_gradient.AddStop(oechem.OEColorStop(3.5, oechem.OEYellow))
    color_gradient.AddStop(oechem.OEColorStop(6.0, oechem.OEGreen))

    return color_gradient


def _get_lipinski_color_gradient() -> oechem.OELinearColorGradient:
    """Return color gradient for Lipinski violations."""
    color_gradient = oechem.OELinearColorGradient()
    color_gradient.AddStop(oechem.OEColorStop(0.0, oechem.OEGreen))
    color_gradient.AddStop(oechem.OEColorStop(2.0, oechem.OEYellow))
    color_gradient.AddStop(oechem.OEColorStop(3.0, oechem.OERed))

    return color_gradient


def _check_image_file(args: argparse.Namespace) -> None:
    # script will terminate if there is some issues
    if not args.image:
        # image will be displayed on the screen
        return
    ext = pathlib.Path(args.image).suffix[1:].upper()
    if not oedepict.OEIsRegisteredImageFile(ext):
        oechem.OEThrow.Fatal("Unknown image output type!")

    ofs = oechem.oeofstream()
    if not ofs.open(args.image):
        oechem.OEThrow.Fatal("Cannot open output image file!")


setattr(main, "__SCRIPT_NAME__", __SCRIPT_NAME__)
setattr(main, "__SCRIPT_DESC__", __SCRIPT_DESC__)
setattr(main, "__SCRIPT_TOOLKITS__", __SCRIPT_TOOLKITS__)
setattr(main, "__SCRIPT_CATEGORIES__", __SCRIPT_CATEGORIES__)

if __name__ == "__main__":
    sys.exit(main())
Solution
The five properties that are depicted in this example are calculated using MolProp TK, which is designed to eliminate inappropriate or undesirable compounds from a large set based on user-defined criteria such as physical properties, functional group content, or molecular topology.
While MolProp TK has been designed for filtering molecules, there is a way (even though it is not straightforward) to access the calculated properties that are used during the filtering process. First, the filter rule has to be defined (see _get_filter_rules).
 1def _get_filter_rules() -> str:
 2    """Return the OEFilter rules string for property computation."""
 3    return """
 4# This file defines the rules for filtering multi-structure files based on
 5# properties and substructure patterns.
 6
 7MIN_MOLWT      130       "Minimum molecular weight"
 8MAX_MOLWT      781       "Maximum molecular weight"
 9
10MIN_XLOGP      -3.0      "Minimum XLogP"
11MAX_XLOGP       6.85     "Maximum XLogP"
12
13PSA_USE_SandP   false    "Count S and P as polar atoms"
14MIN_2D_PSA      0.0      "Minimum 2-Dimensional (SMILES) Polar Surface Area"
15MAX_2D_PSA      205.0    "Maximum 2-Dimensional (SMILES) Polar Surface Area"
16
17# choices are insoluble<poorly<moderately<soluble<very<highly
18MIN_SOLUBILITY insoluble "Minimum solubility"
19
20MIN_LIPINSKI_DONORS  0      "Minimum number of hydrogens on O & N atoms"
21MAX_LIPINSKI_DONORS  6      "Maximum number of hydrogens on O & N atoms"
22
23MIN_LIPINSKI_ACCEPTORS  1   "Minimum number of oxygen & nitrogen atoms"
24MAX_LIPINSKI_ACCEPTORS  14  "Maximum number of oxygen & nitrogen atoms"
25
26MAX_LIPINSKI   3         "Maximum number of Lipinski violations"
27"""
Note
The minimum and maximum values associated with properties in _get_filter_rules are irrelevant in this example since we are not going to use MolProp TK as a filtering tool.
See also
Filter Files section of the MolProp TK manual
The OEFilter object can then be initialized to calculate the properties defined in the filter rule file. When passing a molecule into the OEFilter object, it returns whether or not the molecule satisfies all the requirements:
if filter(mol):
   # pass
else:
   # reject
In this example, we do not use the return value, but rather access the calculated properties that are returned in an output stream associated with the filter object. The rest of the code is just parsing the results that are returned in a format similar to this:
SMILES                                        molecular weight XLogP Solubility  2d PSA Lipinski violations Filter
Cc1ccc2c(c1O)NC(C3CC(=CN3C2=O)/C=C/C(=O)N)O   315.32           -1.28 moderately  115.89 0                   Pass
 1def set_properties(mol: oechem.OEMolBase, properties: list[OEPropertyDisplay]) -> None:
 2    """Compute molecular properties using OEFilter and assign values."""
 3    ifs = oechem.oeisstream(_get_filter_rules())
 4    mol_filter = oemolprop.OEFilter(ifs)
 5
 6    level = oechem.OEThrow.GetLevel()
 7    oechem.OEThrow.SetLevel(oechem.OEErrorLevel_Warning)
 8
 9    output_str = oechem.oeosstream()
10    pwnd = False
11    mol_filter.SetTable(output_str, pwnd)
12
13    headers = output_str.str().split(b"\t")
14    output_str.clear()
15
16    mol_filter(mol)
17
18    fields = output_str.str().decode("UTF-8").split("\t")
19    output_str.clear()
20
21    filter_dict = dict(zip(headers, fields, strict=False))
22
23    for prop in properties:
24        if prop.get_filter_name() in filter_dict:
25            prop.set_value(filter_dict[prop.get_filter_name()])
26
27    oechem.OEThrow.SetLevel(level)
After the properties are calculated, the following code snippet illustrates how
the properties are visualized with the hover effect in an SVG image file format.
In order to add either a hover or a toggle effect to an image, SVG groups are utilized.
You can generate an SVG group for an image by calling the OEImageBase.NewSVGGroup
method. In the example below, two groups are generated for each property.
These two groups are associated by calling the OEAddSVGHover function:
while hovering the mouse over objects drawn inside the area_group, the objects drawn in
the hover_group are displayed.
Everything that is rendered between the OEImageBase.PushGroup and the corresponding
OEImageBase.PopGroup methods is considered “inside” the group.
Note
The OEAddSVGHover function should always be called prior to pushing / popping the OESVGGroup objects.
 1def render_properties(
 2    image: oedepict.OEImageBase,
 3    mol: oechem.OEMolBase,
 4    opts: oedepict.OE2DMolDisplayOptions,
 5    properties: list[OEPropertyDisplay],
 6    color_gradient: bool,
 7) -> None:
 8    """
 9    Render molecule with an interactive property pie chart overlay.
10
11    Draws the molecule into the image, then overlays an interactive pie chart
12    showing molecular properties. Hovering over a pie slice displays
13    the property value either as a color gradient or as a text label.
14    """
15    disp = oedepict.OE2DMolDisplay(mol, opts)
16    oedepict.OERenderMolecule(image, disp)
17
18    image_w, image_h = image.GetWidth(), image.GetHeight()
19
20    pie_frame_size = opts.GetMargin(oedepict.OEMargin_Right) * image_w / 100.0
21    pie_frame = oedepict.OEImageFrame(
22        image,
23        pie_frame_size,
24        pie_frame_size,
25        oedepict.OE2DPoint(
26            image_w - pie_frame_size * 1.1, image_h - pie_frame_size * 1.1
27        ),
28    )
29
30    color_frame_w = image_w - pie_frame.GetWidth() * 1.25
31    color_frame_h = opts.GetMargin(oedepict.OEMargin_Bottom) * 0.75 * image_h / 100.0
32    color_frame = oedepict.OEImageFrame(
33        image,
34        color_frame_w,
35        color_frame_h,
36        oedepict.OE2DPoint(10.0, image_h - color_frame_h - 10.0),
37    )
38
39    center = oedepict.OEGetCenter(pie_frame)
40    radius = pie_frame_size / 2.0
41
42    inc_angle = 360.0 / len(properties)
43    bgn_angle = 0.0
44
45    group_prefix = "property_hover_"
46    for prop in properties:
47        area_group = image.NewSVGGroup(prop.get_id())
48        hover_group = image.NewSVGGroup(group_prefix + prop.get_id())
49        oedepict.OEAddSVGHover(area_group, hover_group)
50
51        image.PushGroup(area_group)
52        _draw_property_pie(
53            pie_frame, prop, center, bgn_angle, bgn_angle + inc_angle, radius
54        )
55        image.PopGroup(area_group)
56
57        image.PushGroup(hover_group)
58        label_text = f"{prop.get_label()} = {prop.get_orig_value()}"
59        if color_gradient:
60            _draw_property_color_gradient(color_frame, prop, label_text)
61        else:
62            _draw_property_label(image, prop, label_text)
63        image.PopGroup(hover_group)
64
65        bgn_angle += inc_angle
Usage
See Download section to download the script.
> properties2img --help
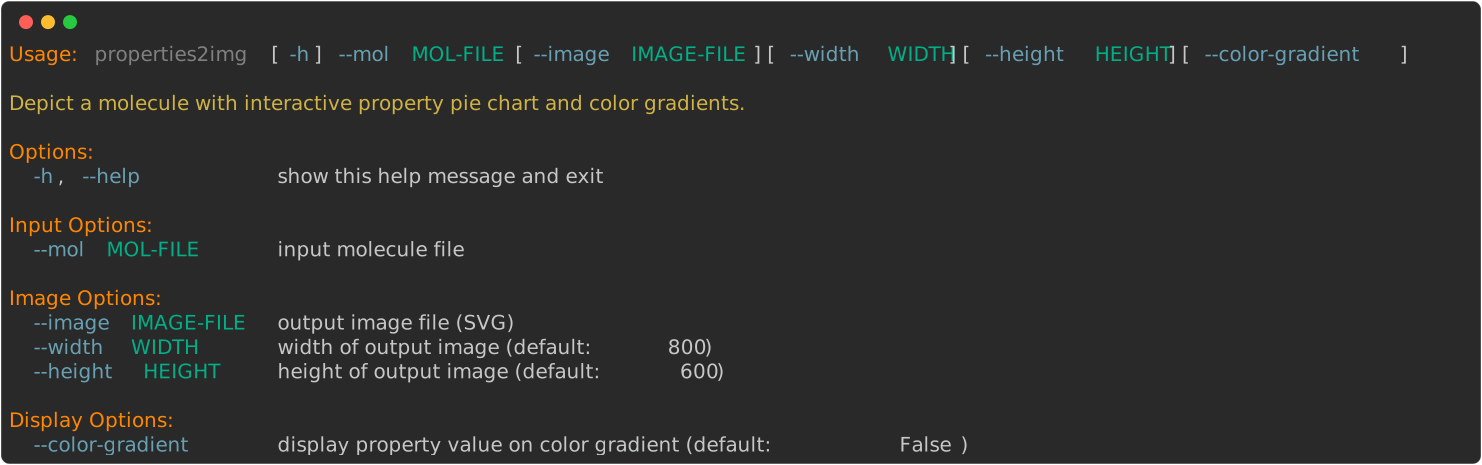
The following commands will generate the images shown in Table 1.
> properties2img --mol example-01.ism --image output.svg
> properties2img --color-gradient --mol example-01.ism --image output.svg
See also in OEChem TK manual
API
OEColorStop class
OELinearColorGradient class
See also in MolProp TK manual
Theory
Filter Files chapter
API
See also in OEDepict TK manual
Theory
Molecule Depiction chapter
API
OE2DMolDisplay class
OE2DMolDisplayOptions class
OEAddLabel function
OEAddSVGHover function
OEFont class
OEImage class
OEImageFrame class
OEPen class
OEPrepareDepiction function
OERenderMolecule function
OESVGGroup class
See also in GraphemeTM TK manual
API
OEDrawColorGradient function