🔄 Ramachandran Plot
Problem
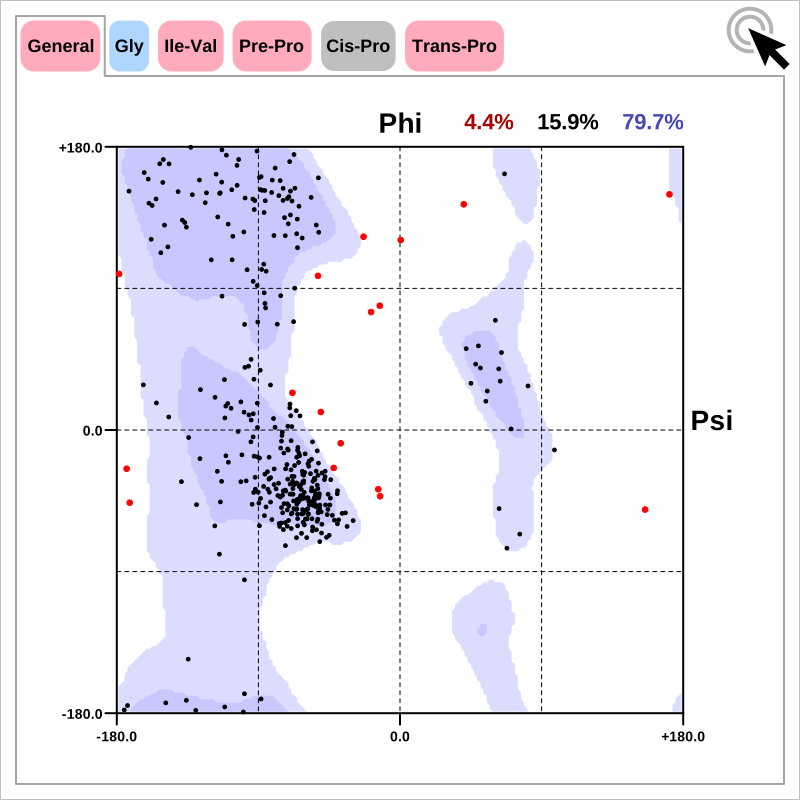
You want to visualize dihedral angles phi (φ) and psi (ψ) of a protein. See example in Figure 1. The contours indicate the extent of allowed (light) and most favored (dark) combinations of (φ, ψ). See also Discussion section.
hover over the red circles to reveal the names of the outliers residues
Figure 1. Example of visualizing Ramachandran plot(PDB: 1CX2)
Ingredients
|
Difficulty level
🌶️
Download
Source Code
rama2img
#!/usr/bin/env python3
# (C) 2026 Cadence Design Systems, Inc. (Cadence)
# All rights reserved.
# TERMS FOR USE OF SAMPLE CODE The software below ("Sample Code") is
# provided to current licensees or subscribers of Cadence products or
# SaaS offerings (each a "Customer").
# Customer is hereby permitted to use, copy, and modify the Sample Code,
# subject to these terms. Cadence claims no rights to Customer's
# modifications. Modification of Sample Code is at Customer's sole and
# exclusive risk. Sample Code may require Customer to have a then
# current license or subscription to the applicable Cadence offering.
# THE SAMPLE CODE IS PROVIDED "AS IS", WITHOUT WARRANTY OF ANY KIND,
# EXPRESS OR IMPLIED.  OPENEYE DISCLAIMS ALL WARRANTIES, INCLUDING, BUT
# NOT LIMITED TO, WARRANTIES OF MERCHANTABILITY, FITNESS FOR A
# PARTICULAR PURPOSE AND NONINFRINGEMENT. In no event shall Cadence be
# liable for any damages or liability in connection with the Sample Code
# or its use.

"""Depict the Ramachandran plots of a protein in single interactive image."""

import argparse
import io
import os
import pathlib
import sys
from pathlib import Path

from openeye import oechem, oedepict, oegrapheme
from PIL import Image
from rich_argparse import HelpPreviewAction, RichHelpFormatter

__SCRIPT_NAME__ = pathlib.Path(__file__).absolute().stem
__SCRIPT_DESC__ = (
    "Depict the Ramachandran plots of a protein (supported image formats: svg, png)."
)
__SCRIPT_TOOLKITS__ = ["oechem", "oedepict", "oegrapheme"]
__SCRIPT_KEYWORDS__ = ["Ramachandran", "visualization"]
__SCRIPT_CATEGORIES__ = ["visualization"]


def parse_options() -> argparse.Namespace:
    """Set up command line options."""
    parser = argparse.ArgumentParser(
        add_help=True,
        formatter_class=RichHelpFormatter,
        description="[yellow]" + __SCRIPT_DESC__ + "[/yellow]",
    )

    # input options
    input_group = parser.add_argument_group("Input ligand-protein complex")
    exclusive_input_group = input_group.add_mutually_exclusive_group(required=True)
    exclusive_input_group.add_argument(
        "--complex",
        type=str,
        required=False,
        metavar="PDB-FILE",
        help="input PDB file of the ligand-protein complex",
    )
    exclusive_input_group.add_argument(
        "--design-unit",
        "--du",
        type=str,
        metavar="DU-FILE",
        help="input design unit file",
    )

    image_group = parser.add_argument_group("Image options")
    image_group.add_argument(
        "--image",
        type=str,
        required=False,
        metavar="IMAGE-FILE",
        help="output image file (SVG, PNG) (required: %(required)s) -- if no output is provided the image will be displayed on the screen",
    )
    image_group.add_argument(
        "--width",
        type=int,
        default=800,
        help="width of output image (default: %(default)s)",
    )
    image_group.add_argument(
        "--height",
        type=int,
        default=800,
        help="height of output image (default: %(default)s)",
    )
    image_group.add_argument(
        "--grid",
        default=False,
        action="store_true",
        help="depict Ramachandran plots in a grid (default: %(default)s)",
    )

    parser.add_argument("--help-image", action=HelpPreviewAction)

    return parser.parse_args()


def main() -> int:
    """Depict B-factor."""
    args = parse_options()

    _check_image_file(args)

    protein = get_protein(args)
    image = oedepict.OEImage(args.width, args.height)

    if not args.grid:
        depict_rama(image, protein)
    else:
        depict_rama_in_grid(image, protein)

    if args.image:
        oedepict.OEWriteImage(args.image, image)
    else:
        _img = Image.open(io.BytesIO(oedepict.OEWriteImageToBytes("png", image)))
        _img.show()

    return os.EX_OK


def depict_rama(image: oedepict.OEImageBase, protein: oechem.OEMolBase) -> None:
    """Depict Ramachandran plots in one interactive image."""
    rama_plot = oegrapheme.OERamachandranPlot()
    rama_plot.AddMolecule(protein)
    oegrapheme.OERenderRamachandranPlot(image, rama_plot)


def depict_rama_in_grid(image: oedepict.OEImageBase, protein: oechem.OEMolBase) -> None:
    """Depicts individual Ramachandran plots in a grid."""
    grid = oedepict.OEImageGrid(image, 2, 3)
    grid.SetMargins(5.0)
    grid.SetCellGap(10.0)

    rama_plot = oegrapheme.OERamachandranPlot()

    out_pen = oedepict.OEPen(
        oechem.OEDarkRed, oechem.OEDarkRed, oedepict.OEFill_On, 1.0
    )
    out_marker = oegrapheme.OEPlotMarker(
        out_pen, oegrapheme.OEPlotMarkerStyle_Square, 3.0
    )
    in_pen = oedepict.OEPen(oechem.OEBlack, oechem.OEBlack, oedepict.OEFill_On, 1.0)
    in_marker = oegrapheme.OEPlotMarker(
        in_pen, oegrapheme.OEPlotMarkerStyle_Circle, 1.5
    )

    rama_plot.AddMolecule(protein, out_marker, in_marker)

    pink_pen = oedepict.OEPen(
        oechem.OEBlack, oechem.OEPinkTint, oedepict.OEFill_Off, 2.0
    )
    blue_pen = oedepict.OEPen(
        oechem.OEBlack, oechem.OEBlueTint, oedepict.OEFill_Off, 2.0
    )
    grey_pen = oedepict.OEPen(
        oechem.OEBlack, oechem.OELightGrey, oedepict.OEFill_Off, 2.0
    )

    rama_types = range(oechem.OERamaType_General, oechem.OERamaType_Max)
    for cell, rama_type in zip(grid.GetCells(), rama_types, strict=False):
        oegrapheme.OERenderRamachandranPlot(cell, rama_plot, rama_type)

        num_outliers = rama_plot.NumDataPoints(rama_type, oechem.OERamaCategory_Outlier)
        num_allowed = rama_plot.NumDataPoints(rama_type, oechem.OERamaCategory_Allowed)
        num_favored = rama_plot.NumDataPoints(rama_type, oechem.OERamaCategory_Favored)
        if num_outliers != 0:
            oedepict.OEDrawCurvedBorder(cell, pink_pen, 10)
        elif num_favored != 0 or num_allowed != 0:
            oedepict.OEDrawCurvedBorder(cell, blue_pen, 10)
        else:
            oedepict.OEDrawCurvedBorder(cell, grey_pen, 10)


def get_protein(args: argparse.Namespace) -> oechem.OEMolBase:
    """Read protein from from pdb/cif file or design unit file."""
    protein = oechem.OEGraphMol()
    if args.complex:
        complex_mol = oechem.OEGraphMol()
        ifs = oechem.oemolistream()
        if not ifs.open(args.complex):
            oechem.OEThrow.Fatal(f"Unable to open {args.complex} for reading")
        if not oechem.OEReadMolecule(ifs, complex_mol):
            oechem.OEThrow.Fatal(f"Unable to read complex from {args.complex}")

        if not oechem.OEHasResidues(complex_mol):
            oechem.OEPerceiveResidues(complex_mol, oechem.OEPreserveResInfo_All)

        #  separate ligand and protein
        split_opts = oechem.OESplitMolComplexOptions()
        ligand = oechem.OEGraphMol()
        water = oechem.OEGraphMol()
        other = oechem.OEGraphMol()
        oechem.OESplitMolComplex(ligand, protein, water, other, complex_mol, split_opts)

        return protein

    if args.design_unit:
        du = oechem.OEDesignUnit()
        if not oechem.OEIsReadableDesignUnit(
            args.design_unit
        ) or not oechem.OEReadDesignUnit(args.design_unit, du):
            oechem.OEThrow.Fatal(f"Cannot read design unit from {args.design_unit}.")

        if not du.GetComponents(protein, oechem.OEDesignUnitComponents_Protein):
            oechem.OEThrow.Fatal("Could not extract protein from design unit.")

    return protein


def _check_image_file(args: argparse.Namespace) -> None:
    # script will terminate if there is some issues
    if not args.image:
        # image will be displayed on the screen
        if not args.grid:
            oechem.OEThrow.Fatal("Requires --grid option!")
        else:
            return

    ext = Path(args.image).suffix[1:].lower()
    if ext != "svg" and not args.grid:
        oechem.OEThrow.Fatal("Requires SVG image extension or use --grid option!")

    ofs = oechem.oeofstream()
    if not ofs.open(args.image):
        oechem.OEThrow.Fatal("Cannot open output image file!")


setattr(main, "__SCRIPT_NAME__", __SCRIPT_NAME__)
setattr(main, "__SCRIPT_DESC__", __SCRIPT_DESC__)
setattr(main, "__SCRIPT_TOOLKITS__", __SCRIPT_TOOLKITS__)
setattr(main, "__SCRIPT_KEYWORDS__", __SCRIPT_KEYWORDS__)
setattr(main, "__SCRIPT_CATEGORIES__", __SCRIPT_CATEGORIES__)

if __name__ == "__main__":
    sys.exit(main())
Solution
The depict_rama function illustrates how simple it is to generate a Ramachandran as shown on. Figure 2. After initializing an OERamachandranPlot object a protein is added to the plot and the OERenderRamachandranPlot function is called to render the plot into the given image.
1def depict_rama(image: oedepict.OEImageBase, protein: oechem.OEMolBase) -> None:
2    """Depict Ramachandran plots in one interactive image."""
3    rama_plot = oegrapheme.OERamachandranPlot()
4    rama_plot.AddMolecule(protein)
5    oegrapheme.OERenderRamachandranPlot(image, rama_plot)
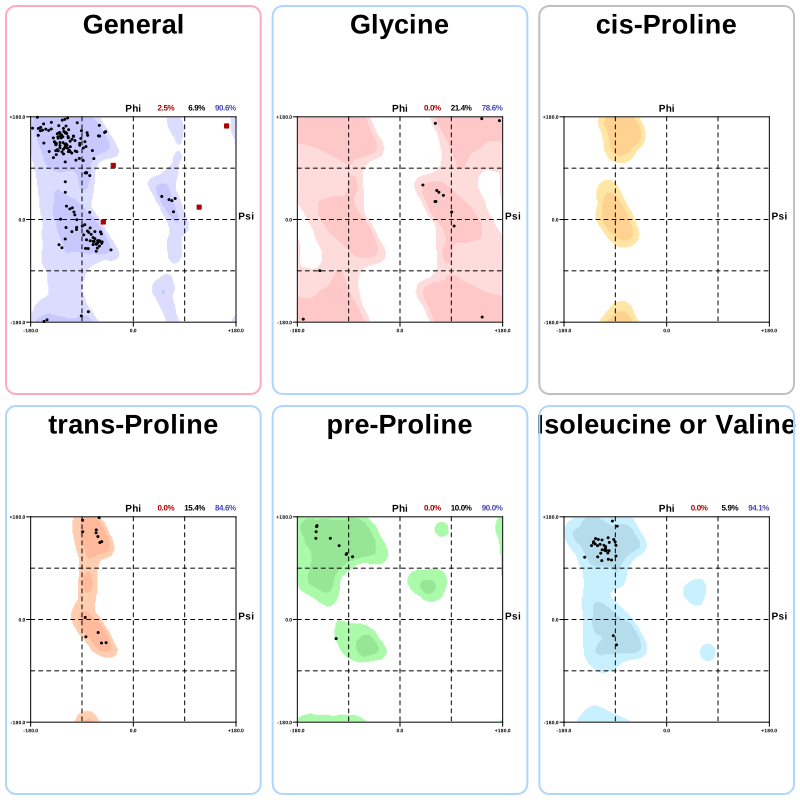
The depict_rama_in_grid function illustrates how the six plots can be depicted in a grid and how the Ramachandran plot can be customized to generate the image shown in Figure 3.
 1def depict_rama_in_grid(image: oedepict.OEImageBase, protein: oechem.OEMolBase) -> None:
 2    """Depicts individual Ramachandran plots in a grid."""
 3    grid = oedepict.OEImageGrid(image, 2, 3)
 4    grid.SetMargins(5.0)
 5    grid.SetCellGap(10.0)
 6
 7    rama_plot = oegrapheme.OERamachandranPlot()
 8
 9    out_pen = oedepict.OEPen(
10        oechem.OEDarkRed, oechem.OEDarkRed, oedepict.OEFill_On, 1.0
11    )
12    out_marker = oegrapheme.OEPlotMarker(
13        out_pen, oegrapheme.OEPlotMarkerStyle_Square, 3.0
14    )
15    in_pen = oedepict.OEPen(oechem.OEBlack, oechem.OEBlack, oedepict.OEFill_On, 1.0)
16    in_marker = oegrapheme.OEPlotMarker(
17        in_pen, oegrapheme.OEPlotMarkerStyle_Circle, 1.5
18    )
19
20    rama_plot.AddMolecule(protein, out_marker, in_marker)
21
22    pink_pen = oedepict.OEPen(
23        oechem.OEBlack, oechem.OEPinkTint, oedepict.OEFill_Off, 2.0
24    )
25    blue_pen = oedepict.OEPen(
26        oechem.OEBlack, oechem.OEBlueTint, oedepict.OEFill_Off, 2.0
27    )
28    grey_pen = oedepict.OEPen(
29        oechem.OEBlack, oechem.OELightGrey, oedepict.OEFill_Off, 2.0
30    )
31
32    rama_types = range(oechem.OERamaType_General, oechem.OERamaType_Max)
33    for cell, rama_type in zip(grid.GetCells(), rama_types, strict=False):
34        oegrapheme.OERenderRamachandranPlot(cell, rama_plot, rama_type)
35
36        num_outliers = rama_plot.NumDataPoints(rama_type, oechem.OERamaCategory_Outlier)
37        num_allowed = rama_plot.NumDataPoints(rama_type, oechem.OERamaCategory_Allowed)
38        num_favored = rama_plot.NumDataPoints(rama_type, oechem.OERamaCategory_Favored)
39        if num_outliers != 0:
40            oedepict.OEDrawCurvedBorder(cell, pink_pen, 10)
41        elif num_favored != 0 or num_allowed != 0:
42            oedepict.OEDrawCurvedBorder(cell, blue_pen, 10)
43        else:
44            oedepict.OEDrawCurvedBorder(cell, grey_pen, 10)
Usage
See Download section to download the script.
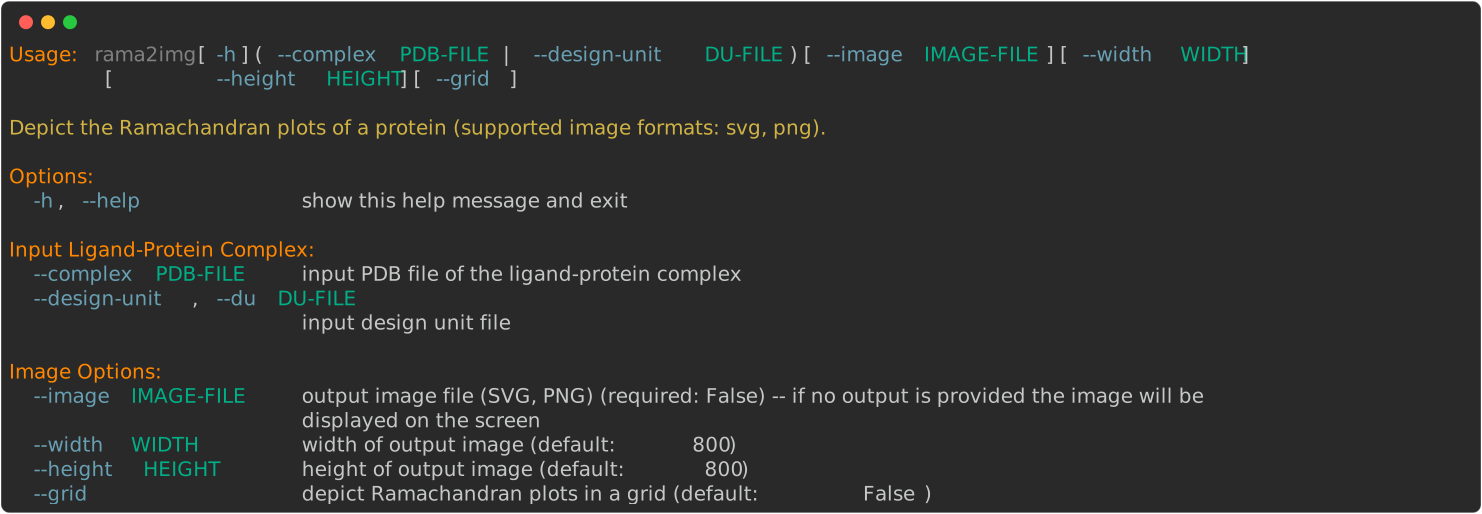
> rama2img --help
The following commands will generate the image shown in Figure 2.
> rama2img --complex 2ROX.cif --image image.svg
The following commands will generate the image shown in Figure 3.
> rama2img --complex 2ROX.cif --image image.svg --grid
Discussion
The Ramachandran plot is a graph of the main backbone dihedral angles phi (φ) and psi (ψ) of amino acid residues in protein structure. The plot in Figure 2 shows the empirical distribution of (φ, ψ) observed in a single protein structure (in this case 2ROX) that can be used for structure validation. The data points are classified by their residue types ([Vincent-2010]) and plotted into corresponding image tabs.
The black circles in the plot indicate the locations of the ideal (φ, ψ) values. Outside the contours, the conformations are disfavored and they are colored red. When hovering over these red dots the names of the outlier residues are revealed.
If there is any outlier in a specific type the label of the corresponding image tab is colored pink (see Figure 1). If there are only favored or allowed (φ, ψ) values in a specific type the label is colored blue (see Figure 2). Gray label indicates that there is no data point for the specific type. This coloring scheme enables rapid structure validation.
The three numbers in each tab shows the percentages of outlier (red), allowed (black) and favored (blue) data points in a specific plot.
Figure 2. Example of visualizing Ramachandran plot (PDB: 2ROX)
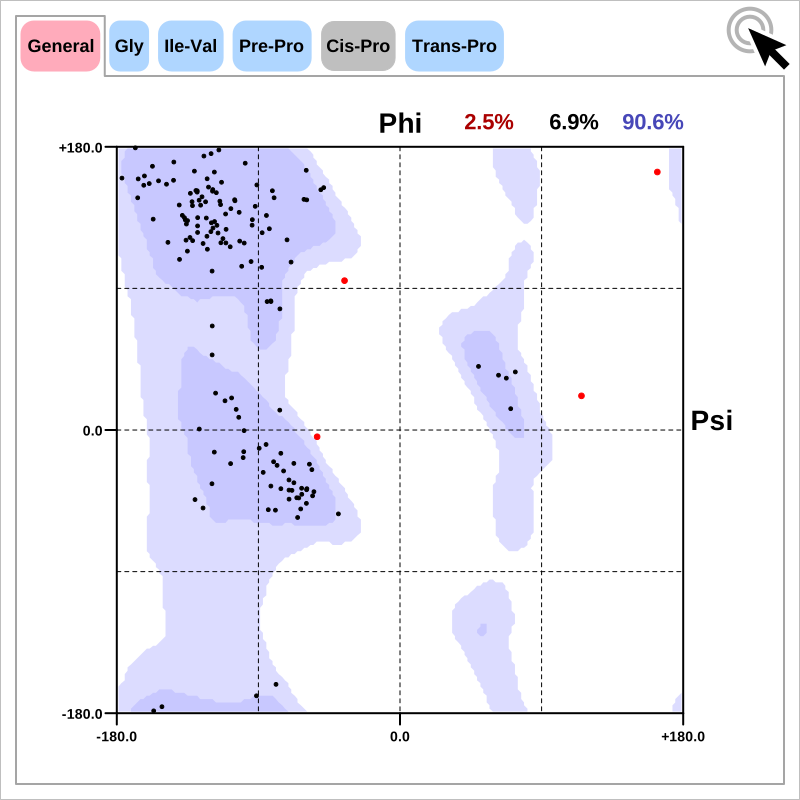
Figure 3. Example of visualizing individual Ramachandran plots (PDB: 2ROX)
See also
OERamachandranAnalysis class
OERamaCategory namespace
OERamaType namespace
See also
Ramachandran Plot in Wikipedia
See also in OEChem TK manual
Theory
Biopolymers chapter
Protein Preparation chapter
API
OEAltLocationFactory class
OERamaCategory namespace
OERamaType namespace
See also in OEDepict TK manual
API
OEImage class
OEImageGrid class
OEPen class
See also in GraphemeTM TK manual
API
OEPlotMarker class
OEPlotMarkerStyle namespace
OERamachandranPlot class
OERenderRamachandranPlot function