Depicting Fragment Contributions of XLogP
Problem
You want to depict the contribution of fragments to the total XLogP on your molecule diagram. See example in Figure 1.
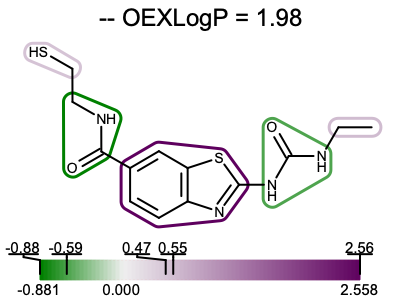
Figure 1. Example of depicting the fragment contributions of XLogP
Ingredients
|
Difficulty Level

Download
Download code
fragxlogp2img.py
and
fragxlogp2pdf.py
See also the Usage (fragxlogp2img) and Usage (fragxlogp2pdf) subsections.
Solution
The code snippet below shows how to calculate the total XLogP of a molecule along with the atom contributions by calling the OEGetXLogP function. Each atom contribution is then attached to the relevant atom as generic data with the given tag.
 1def set_atom_properties(mol, datatag):
 2    """
 3    Attaches the XLogP atom contribution to each atom with the given tag.
 4
 5    :type mol: oechem.OEMolBase
 6    :type datatag: string
 7    """
 8
 9    oequacpac.OERemoveFormalCharge(mol)
10
11    avals = oechem.OEFloatArray(mol.GetMaxAtomIdx())
12    logp = oemolprop.OEGetXLogP(mol, avals)
13
14    mol.SetTitle(mol.GetTitle() + " -- OEXLogP = %.2f" % logp)
15
16    for atom in mol.GetAtoms():
17        val = avals[atom.GetIdx()]
18        atom.SetData(datatag, val)
The fragment_molecule function fragments a molecule by using either the OEGetRingChainFragments, the OEGetRingLinkerSideChainFragments or the OEGetFuncGroupFragments function. Each enumerated fragment is then added to the molecule as a new group with the given tag.
 1def fragment_molecule(mol, fragfunc, grouptag):
 2    """
 3    Fragments the molecule and stores each fragment as a group on the molecule.
 4
 5    :type mol: oechem.OEMolBase
 6    :type fragfunc: function()
 7    :type grouptag: string
 8    """
 9
10    for frag in fragfunc(mol):
11
12        atoms = oechem.OEAtomVector()
13        for atom in frag.GetAtoms():
14            atoms.append(atom)
15        bonds = oechem.OEBondVector()
16        for bond in frag.GetBonds():
17            bonds.append(bond)
18
19        mol.NewGroup(grouptag, atoms, bonds)
The set_fragment_properties function should be called after the atom contributions are calculated (see set_atom_properties) and the molecule is fragmented (see fragment_molecule). It iterates over the fragments, adds together the atom contributions and attaches this accumulated value to each group (fragment). It also returns the minimum and maximum fragment contribution.
 1def set_fragment_properties(mol, datatag, grouptag):
 2    """
 3    Calculates the fragment contribution based on attached atom properties
 4    for pre-generated fragments.
 5
 6    :type mol: oechem.OEMolBase
 7    :type datatag: string
 8    :type grouptag: string
 9    """
10
11    minvalue = float("inf")
12    maxvalue = float("-inf")
13
14    for group in mol.GetGroups(oechem.OEHasGroupType(grouptag)):
15
16        sumprop = 0.0
17        for atom in group.GetAtoms():
18            sumprop += atom.GetData(datatag)
19        group.SetData(datatag, sumprop)
20
21        minvalue = min(minvalue, sumprop)
22        maxvalue = max(maxvalue, sumprop)
23
24    return minvalue, maxvalue
The depict_molecule_fragment_xlogp function below shows how to project the fragment contributions of the total XLogP into a 2D molecular diagram. First the atom contributions are calculated by calling the set_atom_properties function (see lines 13-15). Then a molecule is fragmented (lines 19-21) and the fragment contributions are calculated (line 25). Using the minimum and maximum fragment contributions a color gradient is constructed (lines 29-32). Since both the molecule and the color gradient will be depicted, the image has to be divided into two image frames (lines 36-40). The molecule display is then initialized (lines 44-45) along with the highlighting style (lines 49-50) and the display option for the color gradient (line 52). Then fragment contributions are visualized by iterating over them and highlighting them on the molecule diagram using the color corresponding to their contributions (lines 54-64). Finally, the molecule along with the color gradient is rendered to the image (lines 68-69). You can see the result in Figure 1.
 1def depict_molecule_fragment_xlogp(image, mol, fragfunc, opts):
 2    """
 3    Generates an image of a molecule depicting the fragment contribution of XLogP.
 4
 5    :type image: oedepict.OEImageBase
 6    :type mol: oechem.OEMolBase
 7    :type fragfunc: function()
 8    :type opts: oedepict.OE2DMolDiplayOptions
 9    """
10
11    # calculate atom contributions of XLogP
12
13    sdatatag = "XLogP"
14    idatatag = oechem.OEGetTag(sdatatag)
15    set_atom_properties(mol, idatatag)
16
17    # fragment molecule
18
19    sgrouptag = "fragment"
20    igrouptag = oechem.OEGetTag(sgrouptag)
21    fragment_molecule(mol, fragfunc, igrouptag)
22
23    # calculate fragment contributions
24
25    minvalue, maxvalue = set_fragment_properties(mol, idatatag, igrouptag)
26
27    # initialize color gradient
28
29    lightgrey = oechem.OEColor(240, 240, 240)
30    colorg = oechem.OELinearColorGradient(oechem.OEColorStop(0.0, lightgrey))
31    colorg.AddStop(oechem.OEColorStop(minvalue, oechem.OEDarkGreen))
32    colorg.AddStop(oechem.OEColorStop(maxvalue, oechem.OEDarkPurple))
33
34    # generate image frames
35
36    iwidth, iheight = image.GetWidth(), image.GetHeight()
37    mframe = oedepict.OEImageFrame(image, iwidth, iheight * 0.8,
38                                   oedepict.OE2DPoint(0.0, 0.0))
39    cframe = oedepict.OEImageFrame(image, iwidth, iheight * 0.2,
40                                   oedepict.OE2DPoint(0.0, iheight * 0.8))
41
42    # initialize molecule display
43
44    opts.SetDimensions(mframe.GetWidth(), mframe.GetHeight(), oedepict.OEScale_AutoScale)
45    disp = oedepict.OE2DMolDisplay(mol, opts)
46
47    # initialize highlighting style
48
49    highlight = oedepict.OEHighlightByLasso(oechem.OEWhite)
50    highlight.SetConsiderAtomLabelBoundingBox(True)
51
52    colorgopts = oegrapheme.OEColorGradientDisplayOptions()
53
54    for group in mol.GetGroups(oechem.OEHasGroupType(igrouptag)):
55        groupvalue = group.GetData(idatatag)
56        colorgopts.AddMarkedValue(groupvalue)
57
58        # depict fragment contribution
59
60        color = colorg.GetColorAt(groupvalue)
61        highlight.SetColor(color)
62
63        abset = oechem.OEAtomBondSet(group.GetAtoms(), group.GetBonds())
64        oedepict.OEAddHighlighting(disp, highlight, abset)
65
66    # render molecule and color gradient
67
68    oedepict.OERenderMolecule(mframe, disp)
69    oegrapheme.OEDrawColorGradient(cframe, colorg, colorgopts)
Hint
You can easily adapt this example to visualize other atom properties as fragment contributions by writing your own set_atom_properties and set_fragment_properties functions.
Usage (fragxlogp2img)
Usage
The following commands will generate the image shown in Figure 1.
prompt > echo "SCCNC(=O)c2ccc3c(c2)sc(n3)NC(=O)NCC"  > molecule.ism
prompt > python3 fragxlogp2img.py molecule.ism fragxlogp.png
Command Line Parameters
Simple parameter list
    -height : Height of output image
    -width : Width of output image

    molecule display options :
      -aromstyle : Aromatic ring display style

    input/output options
      -in : Input molecule filename
      -out : Output filename of the generated image

    fragmentation options
      -fragtype : Fragmentation type
Discussion
The example above shows how to visualize the fragment contributions for a single molecule,
however you might want to visualize the XLogP data for a set of molecules.
In the depict_molecules_fragment_xlogp
function below, each molecule is rendered into a cell of an
OEReport object.
The OEReport class is a layout manager allowing generation of multi-page
images in a convenient way.
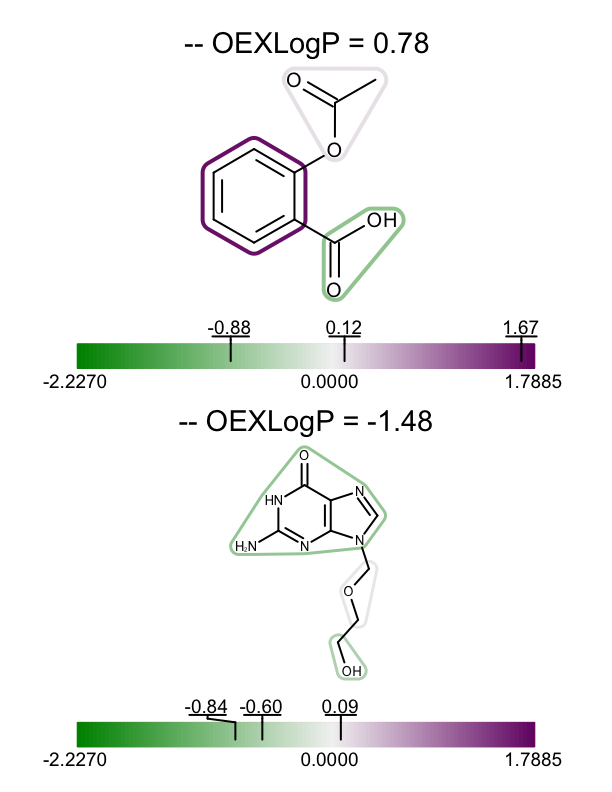
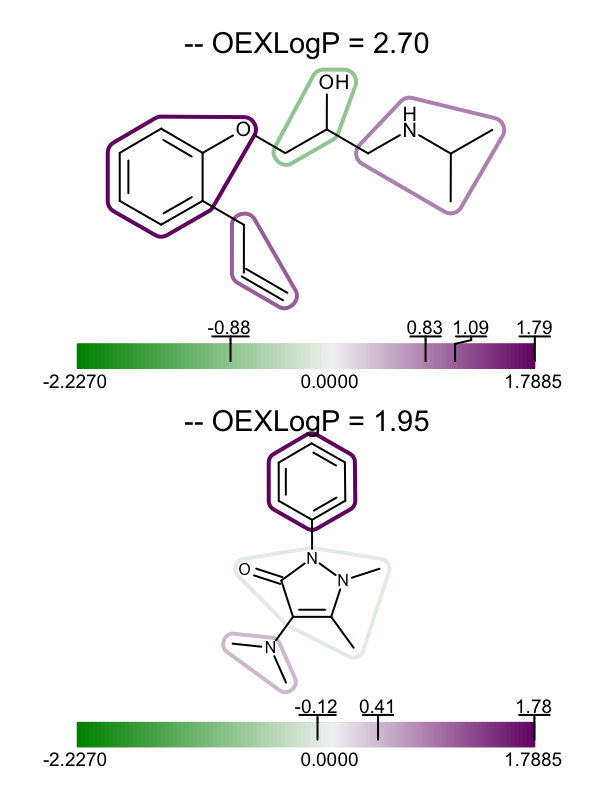
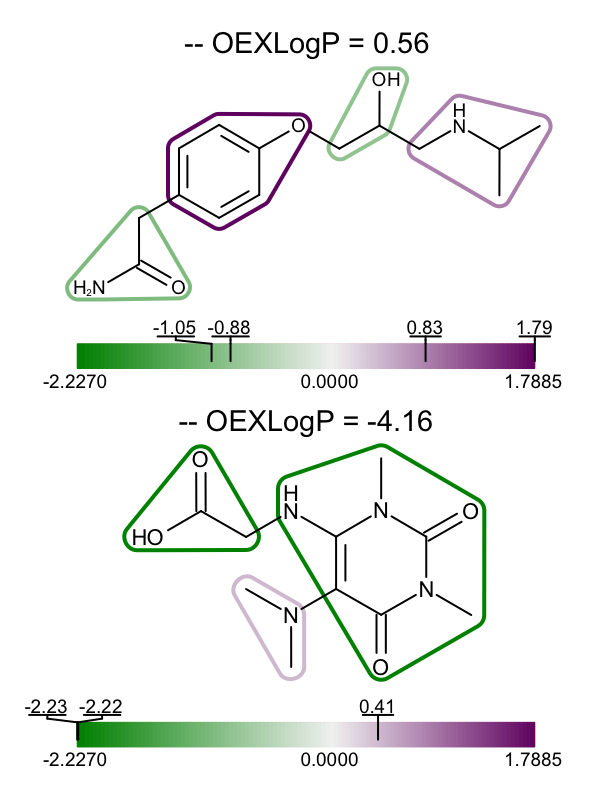
You can see the generated multi-page PDF in Table 1.
 1def depict_molecules_fragment_xlogp(report, mollist, fragfunc, opts):
 2    """
 3    Generates a report of molecules depicting the fragment contribution of XLogP.
 4
 5    :type report: oedepict.OEReport
 6    :type mollist: list[oechem.OEMolBase]
 7    :type fragfunc: function()
 8    :type opts: oedepict.OE2DMolDiplayOptions
 9    """
10
11    # calculate atom contributions of XLogP
12
13    sdatatag = "XLogP"
14    idatatag = oechem.OEGetTag(sdatatag)
15
16    for mol in mollist:
17        set_atom_properties(mol, idatatag)
18
19    # fragment molecules
20
21    sgrouptag = "fragment"
22    igrouptag = oechem.OEGetTag(sgrouptag)
23    for mol in mollist:
24        fragment_molecule(mol, fragfunc, igrouptag)
25
26    # calculate fragment contributions
27
28    minvalue = float("inf")
29    maxvalue = float("-inf")
30    for mol in mollist:
31        minvalue, maxvalue = set_fragment_properties(mol, idatatag, igrouptag,
32                                                     minvalue, maxvalue)
33
34    # initialize color gradient
35
36    lightgrey = oechem.OEColor(240, 240, 240)
37    colorg = oechem.OELinearColorGradient(oechem.OEColorStop(0.0, lightgrey))
38    colorg.AddStop(oechem.OEColorStop(minvalue, oechem.OEDarkGreen))
39    colorg.AddStop(oechem.OEColorStop(maxvalue, oechem.OEDarkPurple))
40
41    # initialize highlighting style
42
43    highlight = oedepict.OEHighlightByLasso(oechem.OEWhite)
44    highlight.SetConsiderAtomLabelBoundingBox(True)
45
46    for mol in mollist:
47
48        # generate image frames
49
50        cell = report.NewCell()
51        cwidth, cheight = cell.GetWidth(), cell.GetHeight()
52        mframe = oedepict.OEImageFrame(cell, cwidth, cheight * 0.8,
53                                       oedepict.OE2DPoint(0.0, 0.0))
54        cframe = oedepict.OEImageFrame(cell, cwidth, cheight * 0.2,
55                                       oedepict.OE2DPoint(0.0, cheight * 0.8))
56
57        # initialize molecule display
58
59        opts.SetDimensions(mframe.GetWidth(), mframe.GetHeight(), oedepict.OEScale_AutoScale)
60        disp = oedepict.OE2DMolDisplay(mol, opts)
61
62        colorgopts = oegrapheme.OEColorGradientDisplayOptions()
63
64        for group in mol.GetGroups(oechem.OEHasGroupType(igrouptag)):
65            groupvalue = group.GetData(idatatag)
66            colorgopts.AddMarkedValue(groupvalue)
67
68            # depict fragment contribution
69
70            color = colorg.GetColorAt(groupvalue)
71            highlight.SetColor(color)
72
73            abset = oechem.OEAtomBondSet(group.GetAtoms(), group.GetBonds())
74            oedepict.OEAddHighlighting(disp, highlight, abset)
75
76        # render molecule and color gradient
77
78        oedepict.OERenderMolecule(mframe, disp)
79        oegrapheme.OEDrawColorGradient(cframe, colorg, colorgopts)
page 1 |
page 2 |
page 3 |
|
|
|
Usage (fragxlogp2pdf)
Usage
fragxlogp2pdf.py
and supporting data
examples.ism
The following command will generate the report shown in Table 1.
prompt > python3 fragxlogp2pdf.py examples.ism fragxlogp.pdf
Command Line Parameters
Simple parameter list
    molecule display options :
      -aromstyle : Aromatic ring display style

    report options
      -pagebypage : Write individual numbered separate pages

    report options :
      -colsperpage : Number of columns per page
      -pageheight : Page height
      -pageorientation : Page orientation
      -pagesize : Page size
      -pagewidth : Page width
      -rowsperpage : Number of rows per page

    input/output options
      -in : Input molecule filename
      -out : Output filename of the generated image

    fragmentation options
      -fragtype : Fragmentation type
See also in OEChem TK manual
Theory
Generic Data chapter
API
OEAtomBondSet class
OEColorStop class
OEGroupBase class
OEHasGroupType functor
OELinearColorGradient class
OEMolBase.NewGroup method
OEMolBase.GetGroups method
See also in MolProp TK manual
API
OEGetXLogP function
See also in Quacpac TK manual
API
OERemoveFormalCharge function
See also in OEMedChem TK manual
Theory
Molecule Fragmentation chapter
API
OEGetFuncGroupFragments function
OEGetRingChainFragments function
OEGetRingLinkerSideChainFragments function
See also in OEDepict TK manual
Theory
Molecule Depiction chapter
Highlighting chapter
Multi Page Reports section
API
OE2DMolDisplay class
OE2DMolDisplayOptions class
OEAddHighlighting function
OEHighlightByCogwheel class
OEImage class
OEImageFrame class
OERenderMolecule function
OEReport class
See also in GraphemeTM TK manual
API
OEDrawColorGradient class