Depicting Atom Properties
Problem
You want to depict arbitrary atom properties calculated by another application or script. See examples in Table 1..
property map |
atom glyph |
molecule surface |
|
|
|
Ingredients
|
Difficulty Level

Download
Download code
atomprop2img.py
and supplementary scripts:
addxlogp.py
addpartialcharge.py
See also the Usage (Partial Charge) and Usage (XLogP) subsections.
Solution
The OEChem TK provides a framework to associate arbitrary data with objects
such as molecules, atoms and bonds.
Generic data can be attached to an object by association either with an
integer or string, called a tag identifier.
When a molecule is written into an OEBinary (oeb) file,
the generic data attached to the molecule and its atoms and bonds is written
to the binary file as well.
This provides a convenient way to transfer data along with the molecules
from one application to another.
The depict_atom_property function visualizes properties attached to atom as generic data. First an image is divided into two frames, one for rendering a molecule with the atom properties and one for depicting the corresponding color gradient that shows the range of the property (lines 14-18). The scaling of the depiction options is then adjusted by utilizing the OEGetMoleculeSurfaceScale function. A OELinearColorGradient object is then initialized by calling the get_color_gradient function. This color gradient is used to associate the atom properties with colors that will represent them in the image. After constructing the molecule display, the atom properties are depicted on the molecular graph based on the user defined depiction style (lines 27-34). The molecule display and the color gradient are then rendered into the image frames along with drawing the label of the atom property into the image (lines 36-41).
 1def depict_atom_property(image, mol, opts, tagname, ncolor, pcolor, style):
 2    """
 3    Depicts atom property using various styles.
 4
 5    :type image: oedepict.OEImageBase
 6    :type mol: oedepict.OEMolBase
 7    :type opts: oechem.OE2DMolDisplayOptions
 8    :type tagname: string
 9    :type ncolor: oechem.OEColor
10    :type pcolor: oechem.OEColor
11    :type style: string
12    """
13
14    mwidth, mheight = image.GetWidth(), image.GetHeight() * 0.9
15    cwidth, cheight = image.GetWidth(), image.GetHeight() * 0.1
16
17    mframe = oedepict.OEImageFrame(image, mwidth, mheight, oedepict.OE2DPoint(0.0, 0.0))
18    cframe = oedepict.OEImageFrame(image, cwidth, cheight, oedepict.OE2DPoint(0.0, mheight))
19
20    opts.SetDimensions(mwidth, mheight, oedepict.OEScale_AutoScale)
21    opts.SetScale(oegrapheme.OEGetMoleculeSurfaceScale(mol, opts))
22
23    colorg = get_color_gradient(mol, tagname, ncolor, pcolor)
24
25    disp = oedepict.OE2DMolDisplay(mol, opts)
26
27    if style == "propmap":
28        depict_atom_property_propmap(disp, tagname, ncolor, pcolor)
29
30    if style == "atomglyph":
31        depict_atom_property_atomglyph(disp, tagname, colorg)
32
33    if style == "molsurface":
34        depict_atom_property_molsurface(disp, tagname, colorg)
35
36    oedepict.OERenderMolecule(mframe, disp)
37    oegrapheme.OEDrawColorGradient(cframe, colorg)
38
39    font = oedepict.OEFont(oedepict.OEFontFamily_Default, oedepict.OEFontStyle_Default, 14,
40                           oedepict.OEAlignment_Left, oechem.OEBlack)
41    cframe.DrawText(oedepict.OE2DPoint(10.0, -10.0), tagname, font)
The get_min_max_atom_property function loops over the atoms of the molecule to find the minimum and maximum values attached to the atoms by the given tag identifier.
 1def get_min_max_atom_property(mol, tagname):
 2    """
 3    Calculates minimum and maximum atom property values.
 4
 5    :type mol: oedepict.OEMolBase
 6    :type tagname: string
 7    :rtype: (int, int)
 8    """
 9
10    minvalue = float("inf")
11    maxvalue = float("-inf")
12
13    tag = oechem.OEGetTag(tagname)
14
15    for atom in mol.GetAtoms():
16        if atom.HasData(tag):
17            val = atom.GetData(tag)
18            minvalue = min(minvalue, val)
19            maxvalue = max(maxvalue, val)
20
21    return minvalue, maxvalue
The get_color_gradient function creates a OELinearColorGradient object based on the minimum and maximum atom property values.
 1def get_color_gradient(mol, tagname, ncolor, pcolor):
 2    """
 3    Generates color gradient.
 4
 5    :type mol: oechem.OEMolBase
 6    :type tagname: string
 7    :type ncolor: oechem.OEColor
 8    :type pcolor: oechem.OEColor
 9    :rtype: oechem.OELineraColorGradient
10    """
11
12    minvalue, maxvalue = get_min_max_atom_property(mol, tagname)
13
14    colorg = oechem.OELinearColorGradient(oechem.OEColorStop(0.0, oechem.OEWhite))
15    if minvalue < 0.0:
16        colorg.AddStop(oechem.OEColorStop(minvalue, ncolor))
17    if maxvalue > 0.0:
18        colorg.AddStop(oechem.OEColorStop(maxvalue, pcolor))
19
20    return colorg
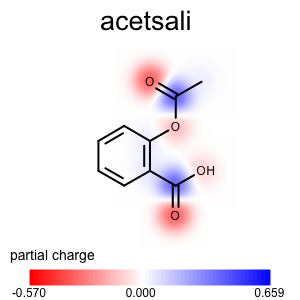
The depict_atom_property_propmap function shows how to project atom properties into a property map.
 1def depict_atom_property_propmap(disp, tagname, ncolor, pcolor):
 2    """
 3    Depicts atom property using property map style.
 4
 5    :type disp: oedepict.OE2DMolDisplay
 6    :type tagname: string
 7    :type ncolor: oechem.OEColor
 8    :type pcolor: oechem.OEColor
 9    """
10
11    opts = disp.GetOptions()
12    propmap = oegrapheme.OE2DPropMap(opts.GetBackgroundColor())
13    propmap.SetLegendLocation(oegrapheme.OELegendLocation_Hidden)
14    propmap.SetNegativeColor(ncolor)
15    propmap.SetPositiveColor(pcolor)
16    propmap.Render(disp, tagname)
See also
OE2DPropMap class
Depicting Atom Property Maps chapter in Grapheme TK manual
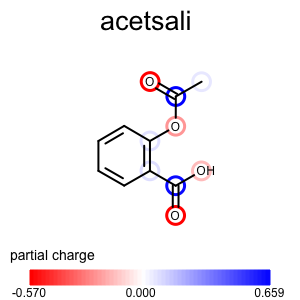
The depict_atom_property_atomglyph function shows how to visualize atom properties using atom glyphs.
 1def depict_atom_property_atomglyph(disp, tagname, colorg):
 2    """
 3    Depicts atom property using atom glyph style.
 4
 5    :type disp: oedepict.OE2DMolDisplay
 6    :type tagname: string
 7    :type colorg: oechem.OELinearColorGradient
 8    """
 9    tag = oechem.OEGetTag(tagname)
10    mol = disp.GetMolecule()
11
12    for atom in mol.GetAtoms():
13        if atom.HasData(tag):
14            value = atom.GetDoubleData(tag)
15            color = colorg.GetColorAt(value)
16            pen = oedepict.OEPen(color, color, oedepict.OEFill_Off, 3.0)
17            glyph = oegrapheme.OEAtomGlyphCircle(pen, oegrapheme.OECircleStyle_Default, 1.2)
18            oegrapheme.OEAddGlyph(disp, glyph, oechem.OEHasAtomIdx(atom.GetIdx()))
See also
OEAddGlyph function
Annotating Atoms and Bonds chapter in Grapheme TK manual
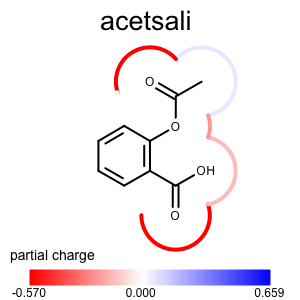
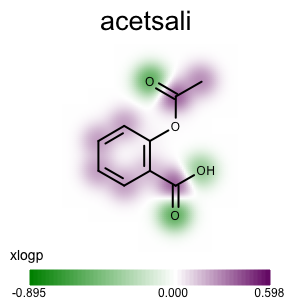
The depict_atom_property_molsurface function shows how to project atom properties into the molecule surface.
 1def depict_atom_property_molsurface(disp, tagname, colorg):
 2    """
 3    Depicts atom property using molecule surface style.
 4
 5    :type disp: oedepict.OE2DMolDisplay
 6    :type tagname: string
 7    :type colorg: oechem.OELinearColorGradient
 8    """
 9    tag = oechem.OEGetTag(tagname)
10    mol = disp.GetMolecule()
11
12    for atom in mol.GetAtoms():
13        if atom.HasData(tag):
14            value = atom.GetDoubleData(tag)
15            color = colorg.GetColorAt(value)
16            pen = oedepict.OEPen(color, color, oedepict.OEFill_Off, 4.0)
17            oegrapheme.OESetSurfaceArcFxn(mol, atom, oegrapheme.OEDefaultArcFxn(pen))
18
19    oegrapheme.OEDraw2DSurface(disp)
See also
OESetSurfaceArcFxn and OEDraw2DSurface functions
Drawing a Molecule Surface chapter Grapheme TK manual
Discussion
This section shows examples to generate the input oeb
file for the atomprop2img.py
script.
Atom Partial Charge
The following example shows how to generates an OEBinary oeb file in which the partial
charge is attached to each atom by the given tag string identifier using
the addpartialcharge.py
script.
The set_partial_charge function of the addpartialcharge.py script:
 1def set_partial_charge(mol, tagname):
 2    """
 3    Attaches the partial change to each atom with the given tag.
 4
 5    :type mol: oechem.OEMolBase
 6    :type tagname: string
 7    """
 8
 9    oechem.OEMMFFAtomTypes(mol)
10    oechem.OEMMFF94PartialCharges(mol)
11
12    tag = oechem.OEGetTag(tagname)
13
14    for atom in mol.GetAtoms():
15        atom.SetData(tag, atom.GetPartialCharge())
After running the addpartialcharge.py
script, the atom partial charges can be visualized by calling the
atomprop2img.py
script with the same tag identifier.
Usage (Partial Charge)
Usage
atomprop2img.py
and addpartialcharge.py
Running the above commands will generate the images shown in Table 1.
prompt > echo "input.ism CC(=O)Oc1ccccc1C(=O)O acetsali"  > molecule.ism
prompt > python3 addpartialcharge.py molecule.ism molecule.oeb partialcharge

prompt > python3 atomprop2img.py -in molecule.oeb -out partialcharge-propmap.png -tagname partialcharge -style propmap
prompt > python3 atomprop2img.py -in molecule.oeb -out partialcharge-atomglyph.png -tagname partialcharge -style atomglyph
prompt > python3 atomprop2img.py -in molecule.oeb -out partialcharge-molsurface.png -tagname partialcharge -style molsurface
Atom XLogP Contribution
The following program generates an OEBinary oeb file in which the
contribution of XLogP is attached to each atom by the given tag string identifier using
the addxlogp.py
script.
The addxlogp function of the addxlogp.py script:
 1def set_xlogp(mol, tagname):
 2    """
 3    Attaches the XLogP atom contribution to each atom with the given tag.
 4
 5    :type mol: oechem.OEMolBase
 6    :type tagname: string
 7    """
 8    oequacpac.OERemoveFormalCharge(mol)
 9
10    tag = oechem.OEGetTag(tagname)
11    avals = oechem.OEFloatArray(mol.GetMaxAtomIdx())
12    oemolprop.OEGetXLogP(mol, avals)
13
14    for atom in mol.GetAtoms():
15        val = avals[atom.GetIdx()]
16        atom.SetData(tag, val)
After running the addxlogp.py script,
the atom contributions of XLogP can be visualized by calling the
atomprop2img.py
script with the same tag identifier.
Usage (XLogP)
Usage
atomprop2img.py
and addxlogp.py
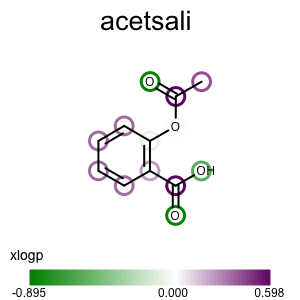
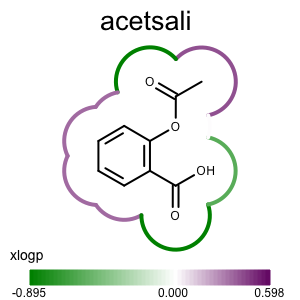
Running the above commands will generate the images shown in Table 2.
prompt > echo "input.ism CC(=O)Oc1ccccc1C(=O)O acetsali"  > molecule.ism
prompt > python3 addpartialcharge.py molecule.ism molecule.oeb partialcharge

prompt > python3 atomprop2img.py -in molecule.oeb -out xlogp-propmap.png -tagname xlogp -style propmap -negcolor darkgreen -poscolor darkpurple
prompt > python3 atomprop2img.py -in molecule.oeb -out xlogp-atomglyph.png -tagname xlogp -style atomglyph -negcolor darkgreen -poscolor darkpurple
prompt > python3 atomprop2img.py -in molecule.oeb -out xlogp-molsurface.png -tagname xlogp -style molsurface -negcolor darkgreen -poscolor darkpurple
property map |
atom glyph |
molecule surface |
|
|
|
See also
See also in OEChem TK manual
Theory
Generic Data chapter
API
OEColor class
OEColorStop class
OEGetTag function
OELinearColorGradient class
See also in OEDepict TK manual
Theory
Molecule Depiction chapter
API
OE2DMolDisplay class
OE2DMolDisplayOptions class
OEFont class
OEImage class
OEImageFrame class
OERenderMolecule function
See also in GraphemeTM TK manual
Theory
Depicting Atom Property Maps chapter
Annotating Atoms and Bonds chapter
Drawing a Molecule Surface chapter
API
OE2DPropMap class
OEAddGlyph function
OEAtomGlyphCircle class
OEGetMoleculeSurfaceScale function
OEDraw2DSurface function
OEDrawColorGradient function