Depicting Topological Polar Surface Area
Problem
You want to depict the topological polar surface area (TPSA) of a molecule. See example in Figure 1.
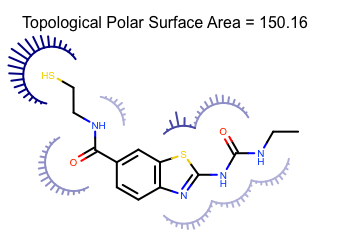
Figure 1. Example of depiction of topological polar surface area
Ingredients
|
Difficulty Level

Solution
The code snippet below shows how to calculate the total polar surface area of a molecule along with the atom contributions by calling the OEGet2dPSA function. Each atom contribution is then attached to the relevant atom as generic data with the given tag.
 1def SetAtomProperties(mol, tag, minvalue=float("inf"), maxvalue=float("-inf"), SAndP=True):
 2
 3    avals = oechem.OEFloatArray(mol.GetMaxAtomIdx())
 4    psa = oemolprop.OEGet2dPSA(mol, avals, SAndP)
 5
 6    mol.SetTitle(mol.GetTitle() + "Topological Polar Surface Area = %.2f" % psa)
 7
 8    for atom in mol.GetAtoms():
 9        val = avals[atom.GetIdx()]
10        atom.SetData(tag, val)
11        minvalue = min(minvalue, val)
12        maxvalue = max(maxvalue, val)
13
14    return minvalue, maxvalue
The PSAArcFxn class below shows how to project the atom contributions of the polar surface area into a molecule surface of an atom . The __call__ method of the class takes a OESurfaceArc object that stores data required for drawing the arcs of molecule surface. The color of the arc of the molecule surface is determined by the polar surface area value attached to atom (lines 19-21). The molecule surface is rendered by using the OEDrawEyelashSurfaceArc function that draws an “eyelash” style arc with the given parameters (lines 28-36). In this case the darker colors and longer spikes indicate larger polar surface area contributions.
 1class PSAArcFxn(oegrapheme.OESurfaceArcFxnBase):
 2    def __init__(self, colorg, tag, pen):
 3        oegrapheme.OESurfaceArcFxnBase.__init__(self)
 4        self.colorg = colorg
 5        self.tag = tag
 6        self.pen = pen
 7
 8    def __call__(self, image, arc):
 9
10        adisp = arc.GetAtomDisplay()
11        if adisp is None or not adisp.IsVisible():
12            return False
13
14        atom = adisp.GetAtom()
15        atompsa = atom.GetData(self.tag)
16        if atompsa == 0.0:
17            return True
18
19        pen = oedepict.OEPen(self.pen)
20        color = self.colorg.GetColorAt(atompsa)
21        pen.SetForeColor(color)
22
23        center = arc.GetCenter()
24        bgnAngle = arc.GetBgnAngle()
25        endAngle = arc.GetEndAngle()
26        radius = arc.GetRadius()
27
28        edgeAngle = 10.0
29        patternDirection = oegrapheme.OEPatternDirection_Outside
30        patternAngle = 10.0
31        minPatternWidthRatio = 0.05
32        maxPatternWidthRatio = 0.70
33        actPatternWidthRatio = min(maxPatternWidthRatio, atompsa * (maxPatternWidthRatio / 40.0))
34        oegrapheme.OEDrawEyelashSurfaceArc(image, center, bgnAngle, endAngle, radius, pen,
35                                           edgeAngle, patternDirection, patternAngle,
36                                           minPatternWidthRatio, actPatternWidthRatio)
37        return True
38
39    def CreateCopy(self):
40        return PSAArcFxn(self.colorg, self.tag, self.pen).__disown__()
The DepictMoleculeWithPSA function below shows how to render a molecule along with its molecule surface customized to visualize the atom contributions of the polar surface area. After assigning the atom contributions to each atom (lines 6-7), an OELinearColorGradient object is constructed using the minimum and maximum contributions. This color gradient is used by the PSAArcFxn class to color the molecule surfaces based on the polar surface area values. The PSAArcFxn class that defines the style how the molecule surface is rendered is the attached to each atom by calling the OESetSurfaceArcFxn function (lines 14-15). Finally, the molecule is rendered along with its molecule surface by calling the OEDraw2DSurface function (lines 17-19).
 1def DepictMoleculeWithPSA(image, mol, opts):
 2
 3    scale = oegrapheme.OEGetMoleculeSurfaceScale(mol, opts)
 4    opts.SetScale(scale)
 5
 6    tag = oechem.OEGetTag("PSA")
 7    minvalue, maxvalue = SetAtomProperties(mol, tag, True)
 8
 9    ncolor = oechem.OEColorStop(minvalue, oechem.OEWhite)
10    pcolor = oechem.OEColorStop(maxvalue, oechem.OEDarkBlue)
11    colorg = oechem.OELinearColorGradient(ncolor, pcolor)
12
13    arcfxn = PSAArcFxn(colorg, tag, opts.GetDefaultBondPen())
14    for atom in mol.GetAtoms():
15        oegrapheme.OESetSurfaceArcFxn(mol, atom, arcfxn)
16
17    disp = oedepict.OE2DMolDisplay(mol, opts)
18    oegrapheme.OEDraw2DSurface(disp)
19    oedepict.OERenderMolecule(image, disp)
Hint
You can easily adapt this example to visualize other atom properties by writing your own SetAtomProperties function.
Download code
Usage:
prompt > python3 psa2img.py molecule.ism psa.png
Discussion
The example above shows how to visualize the polar surface area for a single molecule, however you might want to visualize the polar surface area for a set of molecules.
The DepictMoleculesWithPSA
function shows how the minimum and maximum polar surface area values are
calculated for a set of molecules (lines 10-13).
These values are then used to initialize the linear color gradient that is used
to color the molecule surfaces base on the polar surface area (lines 15-19).
The molecule surface is then calculated for each molecule (lines 23-24) and
the molecule along with its molecule surface is rendered into a cell of an
OEReport object (lines 26-30).
The OEReport class is a layout manager that allows generation of multi-page
images in a convenient way.
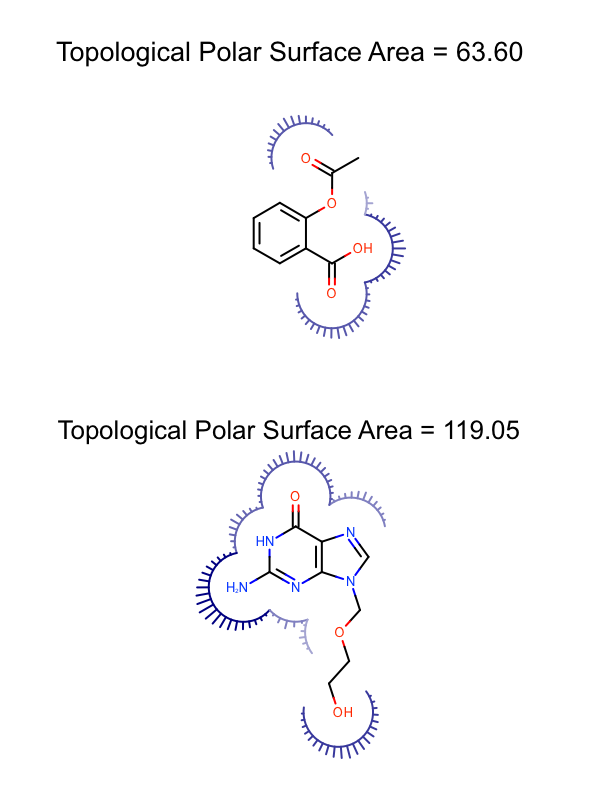
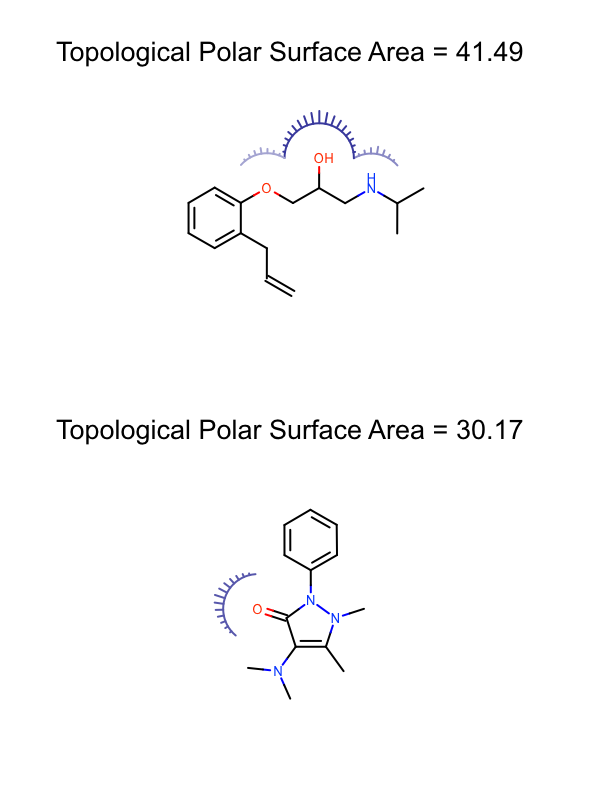
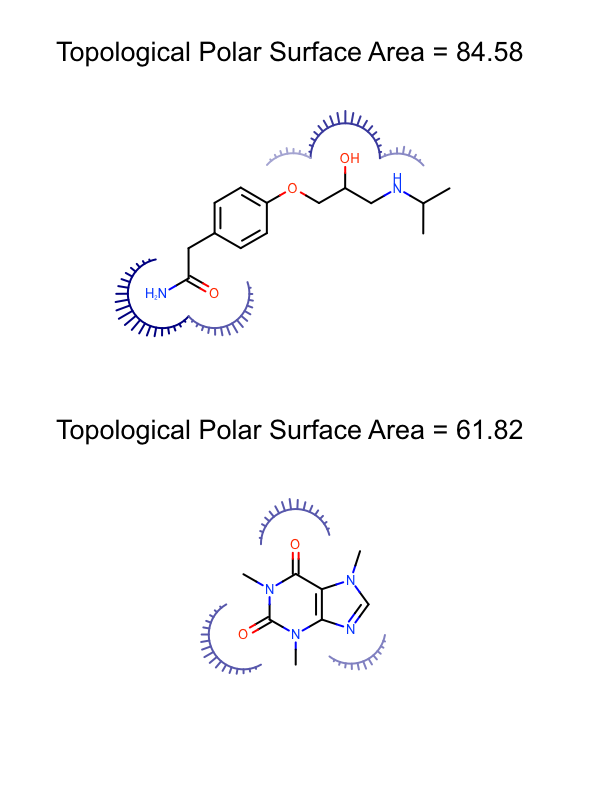
You can see the generated multi-page PDF in
Table 1.
 1def DepictMoleculesWithPSA(report, mollist, opts):
 2
 3    molscale = float("inf")
 4    for mol in mollist:
 5        molscale = min(molscale, oegrapheme.OEGetMoleculeSurfaceScale(mol, opts))
 6    opts.SetScale(molscale)
 7
 8    tag = oechem.OEGetTag("PSA")
 9
10    minvalue = float("inf")
11    maxvalue = float("-inf")
12    for mol in mollist:
13        minvalue, maxvalue = SetAtomProperties(mol, tag, minvalue, maxvalue, True)
14
15    ncolor = oechem.OEColorStop(minvalue, oechem.OEWhite)
16    pcolor = oechem.OEColorStop(maxvalue, oechem.OEDarkBlue)
17    colorg = oechem.OELinearColorGradient(ncolor, pcolor)
18
19    arcfxn = PSAArcFxn(colorg, tag, opts.GetDefaultBondPen())
20
21    for mol in mollist:
22
23        for atom in mol.GetAtoms():
24            oegrapheme.OESetSurfaceArcFxn(mol, atom, arcfxn)
25
26        disp = oedepict.OE2DMolDisplay(mol, opts)
27        oegrapheme.OEDraw2DSurface(disp)
28
29        cell = report.NewCell()
30        oedepict.OERenderMolecule(cell, disp)
page 1 |
page 2 |
page 3 |
|
|
|
Download code
Usage:
prompt > python3 psa2pdf.py molecule.sdf psa.pdf
See also in OEChem TK manual
Theory
Generic Data chapter
API
OELinearColorGradient class
See also in MolProp TK manual
API
OEGet2dPSA function
See also in OEDepict TK manual
Theory
Molecule Depiction chapter
Multi Page Reports section
API
OE2DMolDisplay class
OE2DMolDisplayOptions class
OEImage class
OERenderMolecule function
OEReport class
See also in GraphemeTM TK manual
Theory
Drawing a Molecule Surface chapter
API
OEDraw2DSurface function
OEDrawEyelashSurfaceArc function
OEGetMoleculeSurfaceScale function
OESetSurfaceArcFxn function
OESurfaceArcFxnBase abstract base class