Plotting ROC Curves of Fingerprint Similarity
Problem
You want to evaluate the performance of a molecular fingerprint method for discriminating between a set of molecules with the same activity class and a set of decoys. As the Drawing ROC Curve recipe shows, the performance of binary classification methods can be visualized (and evaluated) by depicting ROC curves and calculating the AUC (area under the curve) number.
In order to perform cross validation for the fingerprint method, the generated plot (see Figure 1) depicts one ROC curve (thin green line) for each molecule from the active set as well as the mean ROC curve (thick green line) and standard deviation (gray region). This graph along with the AUC number gives a clear picture of how well a fingerprint method works to identify molecules that are in the same activity class.
For more details about how to interpret ROC curves and AUC, see the Drawing ROC Curve recipe.
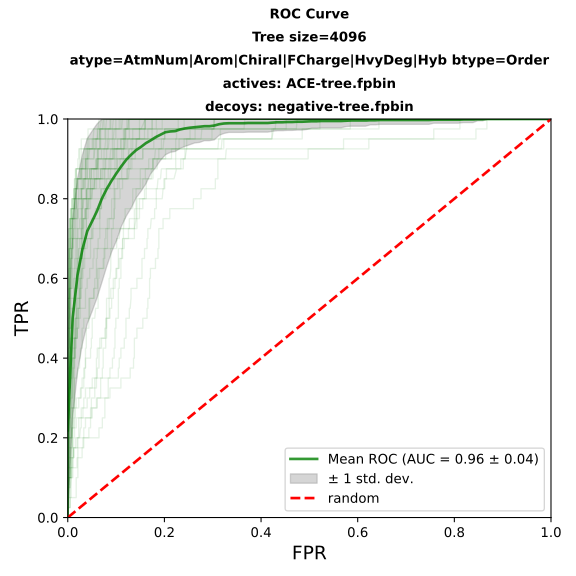
Figure 1. Validation of Tree fingerprint method as binary classification for ACE inhibitors
Ingredients
|
This recipe is based on the scikit-learn example: Receiver Operating Characteristic (ROC) with cross validation
Difficulty level
🌶️ 🌶️ 🌶️
Download
Source Code
fprocs2img
#!/usr/bin/env python3
# (C) 2026 Cadence Design Systems, Inc. (Cadence)
# All rights reserved.
# TERMS FOR USE OF SAMPLE CODE The software below ("Sample Code") is
# provided to current licensees or subscribers of Cadence products or
# SaaS offerings (each a "Customer").
# Customer is hereby permitted to use, copy, and modify the Sample Code,
# subject to these terms. Cadence claims no rights to Customer's
# modifications. Modification of Sample Code is at Customer's sole and
# exclusive risk. Sample Code may require Customer to have a then
# current license or subscription to the applicable Cadence offering.
# THE SAMPLE CODE IS PROVIDED "AS IS", WITHOUT WARRANTY OF ANY KIND,
# EXPRESS OR IMPLIED.  OPENEYE DISCLAIMS ALL WARRANTIES, INCLUDING, BUT
# NOT LIMITED TO, WARRANTIES OF MERCHANTABILITY, FITNESS FOR A
# PARTICULAR PURPOSE AND NONINFRINGEMENT. In no event shall Cadence be
# liable for any damages or liability in connection with the Sample Code
# or its use.

"""Plot fingerprint ROC curves."""

import argparse
import os
import sys
from pathlib import Path

import matplotlib.pyplot as plt
from numpy import interp, linspace, maximum, mean, minimum, std
from openeye import oechem, oegraphsim
from rich.console import Console
from rich_argparse import HelpPreviewAction, RichHelpFormatter
from sklearn.metrics import auc, roc_curve

__SCRIPT_NAME__ = Path(__file__).absolute().stem
__SCRIPT_DESC__ = "Plot fingerprint ROC curves."
__SCRIPT_TOOLKITS__ = ["oechem", "oegraphsim"]


def parse_args() -> argparse.Namespace:
    """Parse command-line arguments."""
    parser = argparse.ArgumentParser(
        add_help=True,
        formatter_class=RichHelpFormatter,
        description="[yellow]" + __SCRIPT_DESC__ + "[/yellow]",
    )

    input_group = parser.add_argument_group("Input options")
    input_group.add_argument(
        "--active",
        type=str,
        required=True,
        metavar="FP-DATABASE-FILE",
        help="input binary fingerprint database file of actives (.fpbin)",
    )
    input_group.add_argument(
        "--decoy",
        type=str,
        required=True,
        metavar="FP-DATABASE-FILE",
        help="input binary fingerprint database file of decoys (.fpbin)",
    )

    output_group = parser.add_argument_group("Output options")
    output_group.add_argument(
        "--image",
        type=str,
        required=True,
        metavar="IMAGE-FILE",
        help="output image file (e.g. PNG, PDF, SVG)",
    )

    parser.add_argument(
        "--mem-type",
        type=str,
        default="in-memory",
        choices=["in-memory", "on-disk"],
        help="database memory type (default: %(default)s)",
    )

    parser.add_argument("--help-image", action=HelpPreviewAction)
    return parser.parse_args()


def _get_memory_type(mem_type_str: str) -> int:
    """Return the OEFPDatabaseMemoryType constant for the given string."""
    if mem_type_str == "on-disk":
        return oegraphsim.OEFastFPDatabaseMemoryType_MemoryMapped
    return oegraphsim.OEFastFPDatabaseMemoryType_InMemory


def plot_roc_curves(
    active_fp_database: oegraphsim.OEFastFPDatabase,
    decoy_fp_database: oegraphsim.OEFastFPDatabase,
) -> None:
    """
    Plot ROC curves and calculate AUC for each active fingerprint.

    For each fingerprint in the active database, scores are computed against
    both the active and decoy databases. Individual ROC curves are plotted
    in light green, and the mean ROC curve with +/- 1 std. dev. band is
    overlaid.
    """
    tprs = []
    aucs = []
    mean_fpr = linspace(0, 1, 100)

    limit = 0  # zero means no limit, all scores returned
    opts = oegraphsim.OEFPDatabaseOptions(limit, oegraphsim.OESimMeasure_Tanimoto)
    fp = oegraphsim.OEFingerPrint()
    for fp_idx in range(active_fp_database.NumFingerPrints()):
        if not active_fp_database.GetFingerPrint(fp, fp_idx):
            continue

        decoy_scores = [si.GetScore() for si in decoy_fp_database.GetScores(fp, opts)]
        active_scores = [si.GetScore() for si in active_fp_database.GetScores(fp, opts)]

        active_flags = [1] * len(decoy_scores) + [0] * len(active_scores)
        scores = decoy_scores + active_scores
        tpr, fpr, _threshold = roc_curve(active_flags, scores)
        tprs.append(interp(mean_fpr, fpr, tpr))
        roc_auc = auc(fpr, tpr)
        aucs.append(roc_auc)
        plt.plot(fpr, tpr, color="green", linewidth=1, alpha=0.10, label=None)

    mean_tpr = mean(tprs, axis=0)
    mean_tpr[-1] = 1.0
    mean_auc = auc(mean_fpr, mean_tpr)
    std_auc = std(aucs)

    plt.plot(
        mean_fpr,
        mean_tpr,
        color="green",
        label=rf"Mean ROC (AUC = {mean_auc:0.2f} $\pm$ {std_auc:0.2f})",
        linewidth=2.0,
        alpha=0.80,
    )

    std_tpr = std(tprs, axis=0)
    tprs_upper = minimum(mean_tpr + std_tpr, 1)
    tprs_lower = maximum(mean_tpr - std_tpr, 0)
    plt.fill_between(
        mean_fpr,
        tprs_lower,
        tprs_upper,
        color="grey",
        alpha=0.33,
        label=r"$\pm$ 1 std. dev.",
    )


def _setup_roc_curve_plot(
    fp_type: oegraphsim.OEFPTypeBase,
    active_name: str,
    decoy_name: str,
) -> None:
    """Configure ROC curve plot labels and title."""
    plt.xlabel("FPR", fontsize=14)
    plt.ylabel("TPR", fontsize=14)
    fp_type_str_comps = fp_type.GetFPTypeString().split(",")
    title_lines = [
        "ROC Curve",
        " ".join(fp_type_str_comps[ci] for ci in [0, 2]),
        " ".join(fp_type_str_comps[ci] for ci in [4, 5]),
        f"actives: {Path(active_name).name}",
        f"decoys: {Path(decoy_name).name}",
    ]
    plt.title("\n".join(title_lines), fontsize=10, weight="bold", linespacing=2.0)


def _save_roc_curve_plot(fname: str, *, random_line: bool = True) -> None:
    """Save the ROC curve plot to a file."""
    if random_line:
        x = [0.0, 1.0]
        plt.plot(x, x, linestyle="dashed", color="red", linewidth=2.0, label="random")

    plt.xlim(0.0, 1.0)
    plt.ylim(0.0, 1.0)
    plt.legend(fontsize=10, loc="best")
    plt.tight_layout()
    plt.savefig(fname)


def main() -> int:
    """Plot fingerprint ROC curves."""
    args = parse_args()
    console = Console()

    mem_type = _get_memory_type(args.mem_type)

    # load active fingerprint database
    active_fp_database = oegraphsim.OEFastFPDatabase(args.active, mem_type)
    if not active_fp_database.IsValid():
        oechem.OEThrow.Fatal(
            f"Cannot open fingerprint database of actives {args.active}!"
        )
    active_fp_type = active_fp_database.GetFPTypeBase()
    console.print(
        f"Loaded {active_fp_database.NumFingerPrints():4d} fingerprints of actives "
        f"({active_fp_type.GetFPTypeString()})"
    )

    # load decoy fingerprint database
    decoy_fp_database = oegraphsim.OEFastFPDatabase(args.decoy, mem_type)
    if not decoy_fp_database.IsValid():
        oechem.OEThrow.Fatal(
            f"Cannot open fingerprint database of decoys {args.decoy}!"
        )
    decoy_fp_type = decoy_fp_database.GetFPTypeBase()
    console.print(
        f"Loaded {decoy_fp_database.NumFingerPrints():4d} fingerprints of decoys "
        f"({decoy_fp_type.GetFPTypeString()})"
    )

    if active_fp_type != decoy_fp_type:
        oechem.OEThrow.Fatal("Fingerprint type mismatch!")

    # plot fingerprint ROCs
    plt.figure(figsize=(6, 6), dpi=80)
    _setup_roc_curve_plot(active_fp_type, args.active, args.decoy)
    plot_roc_curves(active_fp_database, decoy_fp_database)
    _save_roc_curve_plot(args.image, random_line=True)

    console.print(f"Image written to {args.image}")
    return os.EX_OK


setattr(main, "__SCRIPT_NAME__", __SCRIPT_NAME__)
setattr(main, "__SCRIPT_DESC__", __SCRIPT_DESC__)
setattr(main, "__SCRIPT_TOOLKITS__", __SCRIPT_TOOLKITS__)

if __name__ == "__main__":
    sys.exit(main())
Solution
The plot_roc_curves function
calculates and depicts the ROC response for each molecule of the same activity class.
Prior to calling the plot_roc_curves
function, two fingerprint databases are initialized with a specific fingerprint type
(Tree, Path, Circular).
The first, active_fp_database, stores the fingerprints of molecules that belong to the
same activity class. The other database, decoy_fp_database, stores fingerprints
for decoy molecules, i.e. molecules with different or unknown activity classes.
The plot_roc_curves function iterates over all fingerprints in the active dataset and calculates all similarity scores for both the actives and the decoys by calling the OEFastFPDatabase.GetScores method. The options (OEFPDatabaseOptions) used for calculating similarity scores ensure that all similarity scores are returned. The calculated similarity scores are then combined and the ROC curve and AUC number are calculated (and accumulated).
After calculating (and depicting) all the ROC curves to see the variance of the curve for each molecule of the active set (thin green lines), the mean ROC curve (thick green line) and standard deviation (gray region) are also depicted. Finally, the mean AUC (area under curve) and its standard deviation are calculated and plotted.
The generated graph reveals how well the fingerprint method performs for the given activity class and how the retrieval rate can be affected when different molecules from the active set are used to find the other actives.
 1def plot_roc_curves(
 2    active_fp_database: oegraphsim.OEFastFPDatabase,
 3    decoy_fp_database: oegraphsim.OEFastFPDatabase,
 4) -> None:
 5    """
 6    Plot ROC curves and calculate AUC for each active fingerprint.
 7
 8    For each fingerprint in the active database, scores are computed against
 9    both the active and decoy databases. Individual ROC curves are plotted
10    in light green, and the mean ROC curve with +/- 1 std. dev. band is
11    overlaid.
12    """
13    tprs = []
14    aucs = []
15    mean_fpr = linspace(0, 1, 100)
16
17    limit = 0  # zero means no limit, all scores returned
18    opts = oegraphsim.OEFPDatabaseOptions(limit, oegraphsim.OESimMeasure_Tanimoto)
19    fp = oegraphsim.OEFingerPrint()
20    for fp_idx in range(active_fp_database.NumFingerPrints()):
21        if not active_fp_database.GetFingerPrint(fp, fp_idx):
22            continue
23
24        decoy_scores = [si.GetScore() for si in decoy_fp_database.GetScores(fp, opts)]
25        active_scores = [si.GetScore() for si in active_fp_database.GetScores(fp, opts)]
26
27        active_flags = [1] * len(decoy_scores) + [0] * len(active_scores)
28        scores = decoy_scores + active_scores
29        tpr, fpr, _threshold = roc_curve(active_flags, scores)
30        tprs.append(interp(mean_fpr, fpr, tpr))
31        roc_auc = auc(fpr, tpr)
32        aucs.append(roc_auc)
33        plt.plot(fpr, tpr, color="green", linewidth=1, alpha=0.10, label=None)
34
35    mean_tpr = mean(tprs, axis=0)
36    mean_tpr[-1] = 1.0
37    mean_auc = auc(mean_fpr, mean_tpr)
38    std_auc = std(aucs)
39
40    plt.plot(
41        mean_fpr,
42        mean_tpr,
43        color="green",
44        label=rf"Mean ROC (AUC = {mean_auc:0.2f} $\pm$ {std_auc:0.2f})",
45        linewidth=2.0,
46        alpha=0.80,
47    )
48
49    std_tpr = std(tprs, axis=0)
50    tprs_upper = minimum(mean_tpr + std_tpr, 1)
51    tprs_lower = maximum(mean_tpr - std_tpr, 0)
52    plt.fill_between(
53        mean_fpr,
54        tprs_lower,
55        tprs_upper,
56        color="grey",
57        alpha=0.33,
58        label=r"$\pm$ 1 std. dev.",
59    )
Usage
See Download section to download the script.
> fprocs2img --help
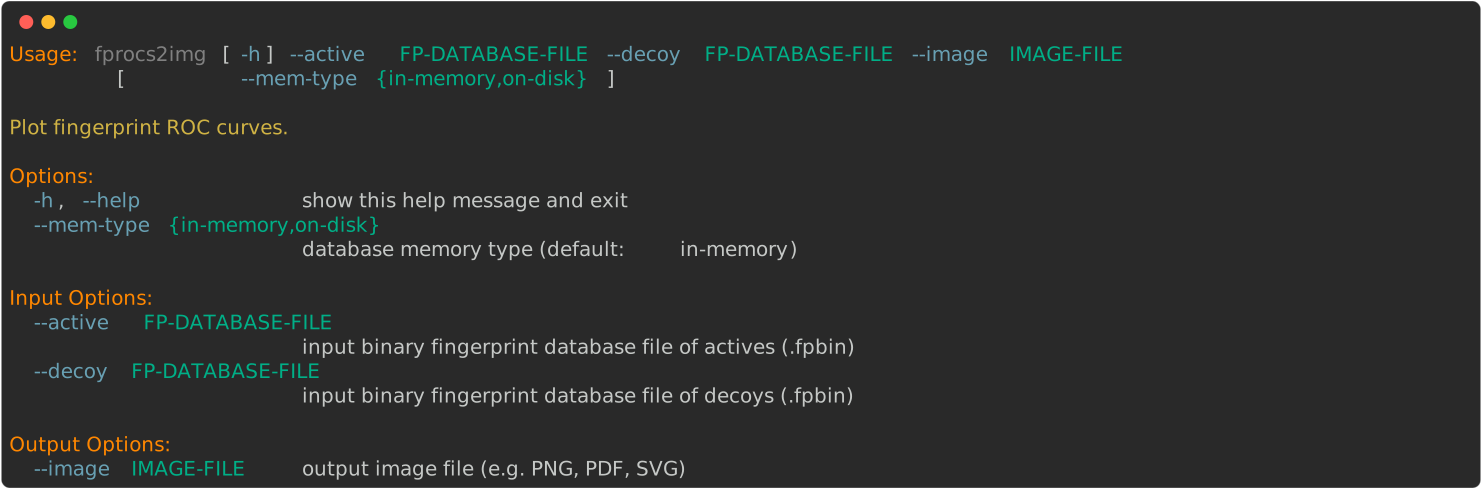
The following command will generate the image shown in Figure 1.
for ACE inhibitors of the Briem-Lessel validation set using
ACE-tree.fpbin and
negative-tree.fpbin generated with
makefastfp script (described in the Rapid Similarity Searching of Large Molecule Files)
> fprocs2img --active ACE-tree.fpbin --decoy negative-tree.fpbin --image fprocs2img-01.svg
Discussion
The Figure 1 reveals that a Tree fingerprint method, with very high AUC number (0.96), performs really well for ACE inhibitors of the Briem-Lessel validation set ([Briem-Lessel-2000]). In comparison, the same Tree fingerprint method performs poorly for the PAF Antagonist activity class in the same validation set (see Figure 2).
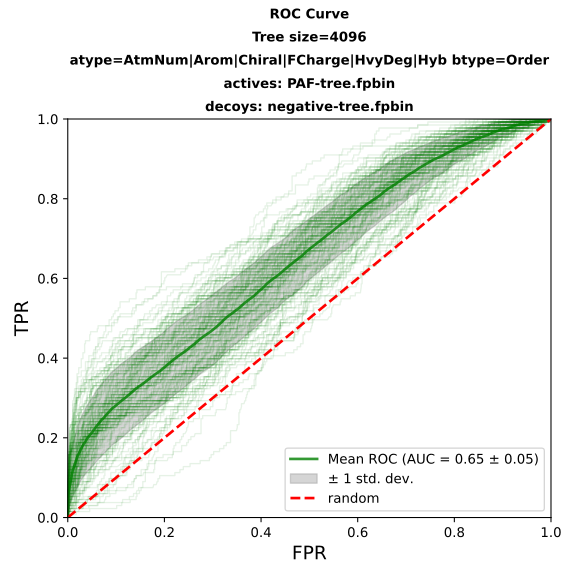
Figure 2. Validation of Tree fingerprint method as binary classification for PAF Antagonist
The default fingerprint types (Tree, Path, and Circular) available in GraphSim TK are rigorously calibrated on the Briem-Lessel [Briem-Lessel-2000], Hert-Willett [Hert-Willett-2004], and Grant [Grant-2006] benchmark sets. GraphSim TK also provides facilities to construct user-defined fingerprints with the following adjustable parameters:
the atom and bond typing that define which atom and bond properties are encoded into the fingerprints.
the size of the fragments that are exhaustively enumerated during the fingerprint generation
the size of the generated fingerprint (in bits)
See also
User-defined Fingerprint chapter in the GraphSim TK manual.
However, an effective user-defined fingerprint cannot be designed without understanding the effect of the different parameters on the overall performance.
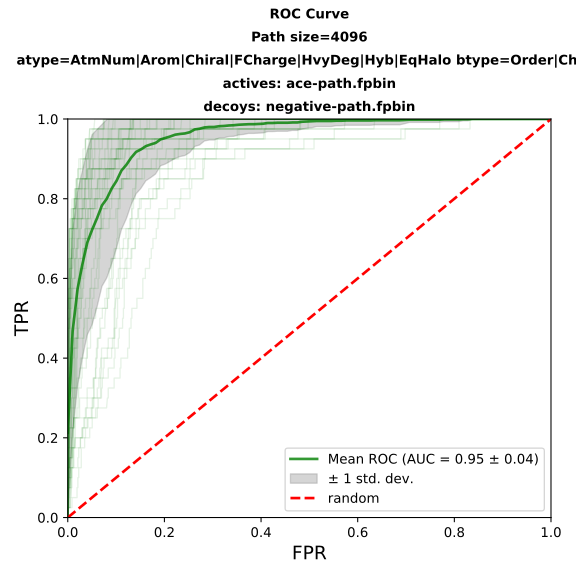
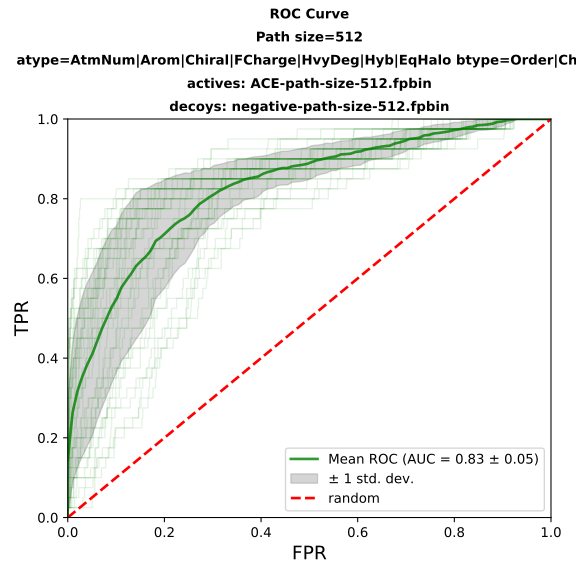
The default fingerprint size used in GraphSim TK for Tree, Path, and Circular fingerprint types is 4096-bit long. By reducing the fingerprint size to 512-bits, the speed of the fingerprint search can be accelerated about 8-fold, but not without reducing the power to discriminate between structurally similar and dissimilar molecules (see Table 1).
|
|
See also in numpy documentation
numpy.mean()numpy.std()numpy.interp()
See also in sklearn documentation
sklearn.metrics.auc()sklearn.metrics.roc_curve()
See also in matplotlib documentation
matplotlib.pyplot
See also in GraphSim TK manual
Theory
Fingerprint Generation chapter
User-defined Fingerprint chapter
API
OEFastFPDatabase class
OEFingerPrint class
OEFPDatabaseOptions class
Theory
Receiver operating characteristic (ROC) in Wikipedia
An introduction to ROC analysis by Tom Fawcett
Area under the curve in Wikipedia
Briem-Lessel Dataset