OEImageBase
class OEImageBase
The OEImageBase is an abstract class that provides methods for drawing basic geometric shapes such as lines, circles, rectangles etc.
The following classes derive from this class:
Constructors
OEImageBase(width: float = 200.0, height: float = 200.0) -> OEImageBase
Default constructor that creates an image with the specified width and height.
- width, height
The dimensions of the image, both have to be positive (non-zero) numbers.
Clear
Clear(color: OEColor = OEWhite) -> None
Clears the image with the given color.
See also
OEColor class
DrawArc
DrawArc(c: OE2DPoint, bgnAngle: float, endAngle: float,
        radius: float, pen: OEPen) -> None
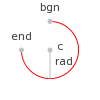
Draws the outline of an arc. See example in Figure: Example of arc.
Example of arc
- center
The center of the arc.
- bgnAngle, endAngle
The two endpoints of the arc (in degrees). Both angles are in degrees and their values have to be in a range of \([0.0^{\circ}, 360.0^{\circ}]\). Angles are interpreted such that \(0.0^{\circ}\) and \(360.0^{\circ}\) degrees are at the 12 o’clock position, \(90.0^{\circ}\) degrees corresponds to 3 o’clock, etc.
- radius
The radius of the arc.
- pen
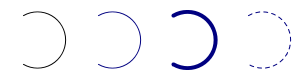
The graphical properties of the curve (such as color, line width, etc). See examples in Figure: Example of drawing arcs with various pens.
Example of drawing arcs with various pens
Note
OEImageBase.DrawArc supports all the
OEPen properties (i.e. color, line width, line
stipple) except the fill property.
See also OEImageBase.DrawPie method.
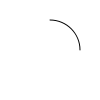
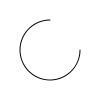
Arcs are always drawn in a clockwise direction. This means that bgn = \(0.0^{\circ}\), end = \(90.0^{\circ}\) angle pair is not the same as bgn = \(90.0^{\circ}\), end = \(0.0^{\circ}\) angle pair. See examples in Table: Example of interpreting the begin and end angles of the arc.
bgn = \(0.0^{\circ}\) end = \(90.0^{\circ}\) |
bgn = \(90.0^{\circ}\) end = \(0.0^{\circ}\) |
|---|---|
|
|
DrawCircle
DrawCircle(c: OE2DPoint, radius: float, pen: OEPen) -> None
Draws a circle. See example in Figure: Example of circle.
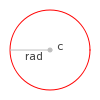
Example of circle
- center
The center of the circle.
- radius
The radius of the circle.
- pen
The graphical properties of the circle (such as color, line width, etc). See examples in Figure: Example of drawing circles with various pens.
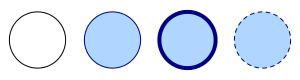
Example of drawing circles with various pens
DrawCubicBezier
DrawCubicBezier(bgn: OE2DPoint, c1: OE2DPoint, c2: OE2DPoint,
                end: OE2DPoint, pen: OEPen) -> None
Draws a cubic Bézier curve. See example in Figure: Example of cubic Bezier curve.
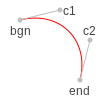
Example of cubic Bezier curve
- bgn, end
The end points of the Bezier curve.
- c1, c2
The control points of the curve.
- pen
The graphical properties of the Bézier curve (such as color, line width, etc). See examples in Figure: Example of drawing cubic Bezier curves with various pens.
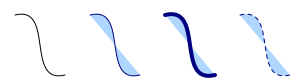
Example of drawing cubic Bezier curves with various pens
Example (Figure: Example of drawing a cubic Bezier curve)
image = oedepict.OEImage(100, 100)

b = oedepict.OE2DPoint(20, 70)
e = oedepict.OE2DPoint(60, 70)
c1 = b + oedepict.OE2DPoint(50, -60)
c2 = e + oedepict.OE2DPoint(50, -60)

pen = oedepict.OEPen(oechem.OELightGreen, oechem.OEBlack, oedepict.OEFill_On, 2.0)
image.DrawCubicBezier(b, c1, c2, e, pen)
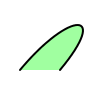
Example of drawing a cubic Bezier curve
DrawLine
DrawLine(bgn: OE2DPoint, end: OE2DPoint, pen: OEPen) -> None
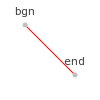
Draws a line. See example in Figure: Example of line.
Example of line
- bgn, end
The two endpoints of the line.
- pen
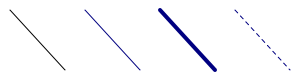
The graphical properties of the line (such as color, line width, etc). See examples in Figure: Example of drawing lines with various pens.
Example of drawing lines with various pens
DrawPath
DrawPath(path: OE2DPath, pen: OEPen) -> None
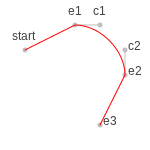
Draws as path. See example in Figure: Example of path.
Example of path
- path
The OE2DPath object that defines a path as a sequence of lines and curves.
- pen
The graphical properties of the pie (such as color, line width, etc). See examples in Figure: Example of drawing paths with various pens.

Example of drawing paths with various pens
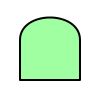
Example (Figure: Example of drawing a path)
image = oedepict.OEImage(100, 100)

path = oedepict.OE2DPath(oedepict.OE2DPoint(20, 80))
path.AddLineSegment(oedepict.OE2DPoint(80, 80))
path.AddLineSegment(oedepict.OE2DPoint(80, 40))
path.AddCurveSegment(oedepict.OE2DPoint(80, 10), oedepict.OE2DPoint(20, 10),
                     oedepict.OE2DPoint(20, 40))

pen = oedepict.OEPen(oechem.OELightGreen, oechem.OEBlack, oedepict.OEFill_On, 2.0)
image.DrawPath(path, pen)
Example of drawing a path
DrawPie
DrawPie(c: OE2DPoint, bgnAngle: float, endAngle: float,
        radius: float, pen: OEPen) -> None
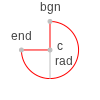
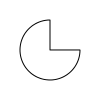
Draws a pie. See example in Figure: Example of drawing a pie.
- center
The center of the pie.
- bgnAngle, endAngle
The two endpoints of the pie (in degrees). Both angles are in degrees and their values have to be in a range of \([0.0^{\circ}, 360.0^{\circ}]\). Angles are interpreted such that \(0.0^{\circ}\) and \(360.0^{\circ}\) degrees are at the 12 o’clock position, \(90.0^{\circ}\) degrees corresponds to 3 o’clock, etc.
- radius
The radius of the pie.
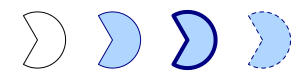
- pen
The graphical properties of the pie (such as color, line width, etc). See examples in Figure: Example of drawing pies with various pens.
Example of drawing pies with various pens
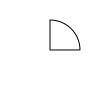
Pies are always drawn in a clockwise direction. This means that bgn = \(0.0^{\circ}\), end = \(90.0^{\circ}\) angle pair is not the same as bgn = \(90.0^{\circ}\), end = \(0.0^{\circ}\) angle pair. See examples in Table: Example of interpreting the begin and end angles of the pie.
bgn = \(0.0^{\circ}\) end = \(90.0^{\circ}\) |
bgn = \(90.0^{\circ}\) end = \(0.0^{\circ}\) |
|---|---|
|
|
DrawPoint
DrawPoint(p: OE2DPoint, color: OEColor) -> None
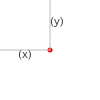
Draws a point. See example in Figure: Example of point.
Example of point
- p
The position of the point, where p = OE2DPoint(x, y).
- color
The color of the point.
See also
OEColor class
DrawPolygon
DrawPolygon(endPoints: OE2DPointVector, pen: OEPen) -> None
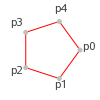
Draws a closed polygon. See example in Figure: Example of polygon.
Example of polygon
- points
The series of points that defines the polygon. The polygon will be closed i.e. the first connected with the last point.
- pen
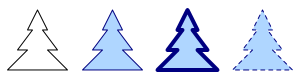
The graphical properties of the polygon (such as color, line width, etc). See examples in Figure: Example of polygons lines with various pens.
Example of drawing polygons with various pens
Example (Figure: Example of drawing a polygon)
image = oedepict.OEImage(100, 100)

polygon = []
polygon.append(oedepict.OE2DPoint(20, 20))
polygon.append(oedepict.OE2DPoint(40, 40))
polygon.append(oedepict.OE2DPoint(60, 20))
polygon.append(oedepict.OE2DPoint(80, 40))
polygon.append(oedepict.OE2DPoint(80, 80))
polygon.append(oedepict.OE2DPoint(20, 80))

pen = oedepict.OEPen(oechem.OELightGreen, oechem.OEBlack, oedepict.OEFill_On, 2.0)
image.DrawPolygon(polygon, pen)
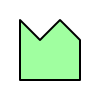
Example of drawing a polygon
DrawQuadraticBezier
DrawQuadraticBezier(bgn: OE2DPoint, c1: OE2DPoint, end: OE2DPoint,
                    pen: OEPen) -> None
Draws a quadratic Bézier curve. See example in Figure: Example of quadratic Bezier curve.
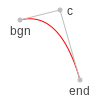
Example of quadratic Bezier curve
- bgn, end
The end points of the Bézier curve.
- c
The control point of the curve.
- pen
The graphical properties of the Bézier curve (such as color, line width, etc). See examples in Figure: Example of drawing quadratic Bezier curves with various pens.
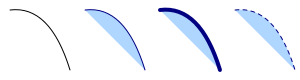
Example of drawing quadratic Bezier curves with various pens
Example (Figure: Example of drawing a polygon)
image = oedepict.OEImage(100, 100)

b = oedepict.OE2DPoint(20, 70)
e = oedepict.OE2DPoint(80, 70)
c = b + oedepict.OE2DPoint(30, -80)

pen = oedepict.OEPen(oechem.OELightGreen, oechem.OEBlack, oedepict.OEFill_On, 2.0)
image.DrawQuadraticBezier(b, c, e, pen)
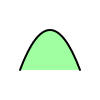
Example of drawing a quadratic Bezier
DrawRectangle
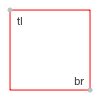
DrawRectangle(tl: OE2DPoint, br: OE2DPoint, pen: OEPen) -> None
Draws a rectangle. See example in Figure: Example of rectangle.
Example of rectangle
- tl
The top left corner of the rectangle.
- br
The bottom right corner of the rectangle.
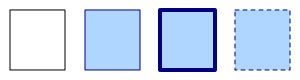
- pen
The graphical properties of the rectangle (such as color, line width, etc). See examples in Figure: Example of polygons rectangles with various pens.
Example of drawing rectangles with various pens
DrawText
DrawText(c: OE2DPoint, text: str, font: OEFont,
         maxwidth: float = 0.0) -> None
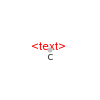
Draws a text. See example in Figure: Example of text.
Example of text
- center
The position of the text.
- text
The characters to be displayed.
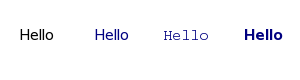
- font
The graphical properties of the displayed text (such as color, font size, etc). See examples in Figure: Example of drawing texts with various fonts.
- maxwidth
If maxwidth is specified and the width of the text would exceed the given limit, than the size of the font used to display the text is automatically reduced.
Note
The displayed position of the text not only depends on ‘c’ position but also the alignment style of the given OEFont.
Example of drawing texts with various fonts
See also
OE2DPoint class
OEAlignmentnamespaceOEFont class
DrawTriangle
DrawTriangle(arg0: OE2DPoint, arg1: OE2DPoint, arg2: OE2DPoint,
             arg3: OEPen) -> None
Draws a triangle. See example in Figure: Example of triangle.
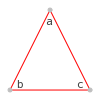
Example of triangle
- a, b, c
The three corners of the triangle.
- pen
The graphical properties of the triangle (such as color, line width, etc). See examples in Figure: Example of polygons triangles with various pens.
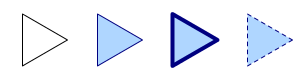
Example of drawing triangles with various fonts
GetGlobalOffset
GetGlobalOffset() -> OE2DPoint
Returns the offset from the origin (x=0.0, y=0.0) to the top-left corner of the given image.
GetHeight
GetHeight() -> float
Returns the height of the OEImageBase object.
GetMinFontSize
GetMinFontSize() -> int
Returns the minimum size of the font that can be displayed.
GetWidth
GetWidth() -> float
Returns the width of the OEImageBase object.
SetMinFontSize
SetMinFontSize(fontsize: int) -> None
Sets the minimum size of the font that can be displayed.
GetSVGClass
GetSVGClass(name: str) -> OESVGClass
Returns the OESVGClass object with the given name. Null pointer will be returned if no class exists on the image with the given name.
See also
OESVGClass class
GetSVGGroup
GetSVGGroup(id: str) -> OESVGGroup
Returns the OESVGGroup object with the given name. Null pointer will be returned if no group exists on the image with the given name.
See also
OESVGGroup class
GetSVGGroups
GetSVGGroups() -> Iterable[OESVGGroup]
Returns an iterator over the SVG groups (OESVGGroup) of the image.
Example:
for g in image.GetSVGGroups():
    print(g.GetId())
See also
OESVGGroup class
NewSVGClass
NewSVGClass(name: str) -> OESVGClass
Creates a new OESVGClass on the given image. A null pointer will be returned and warning message will be thrown if the SVG class can not be created.
- name
The name of the OESVGClass object. For information about valid group names see the documentation of the
OEIsValidSVGClassNamefunction.
See also
OESVGClass class
NewSVGGroup
NewSVGGroup(id: str) -> OESVGGroup
Creates a new OESVGGroup on the given image. A null pointer will be returned and warning message will be thrown if the SVG group can not be created.
- name
The name of the OESVGGroup object. For information about valid group names see the documentation of the
OEIsValidSVGGroupIdfunction.
See also
OESVGGroup class
PopGroup
PopGroup(arg0: OESVGGroup) -> bool
Pops the OESVGGroup object.
Note
An OESVGGroup object can be used (pushed / popped) only once. OESVGGroup objects can be nested. They should be used in LIFO (for last in, first out) i.e. the group that has been pushed last should be popped first.
See also
OESVGGroup class
OEImageBase.PushGroupmethod
PushGroup
PushGroup(arg0: OESVGGroup) -> bool
Pushes the OESVGGroup object.
Note
An OESVGGroup object can be used (pushed / popped) only once. OESVGGroup objects can be nested. They should be used in LIFO (for last in, first out) i.e. the group that has been pushed last should be popped first.
See also
OESVGGroup class
OEImageBase.PopGroupmethod