Depicting Property Maps
The previous chapters give examples about how to depict atom properties either by using glyphs (see Annotating Atoms and Bonds chapter) or projecting them into a 2D molecule surface (see Drawing a Molecule Surface chapter). Grapheme TK can also map atom properties into a 2D grid, called a property map, using a Gaussian function. After the grid is generated, colors are rendered to each cell using the OELinearColorGradient class that interpolates colors between a specified range.
The following Listing 1 example
demonstrates how to depict partial charges using the property map.
After constructing the molecule and preparing it for depiction, the MMFF
partial charges are calculated.
These partial charges are attached to the corresponding atom as
generic data with a specific tagname.
A OE2DPropMap object is then generated by
specifying three colors:
the background color of the property map
one that represents negative values (in this case charges), and
the color that represents positive values in the property map
When the OE2DPropMap.Render method is called
with the tagname, the properties that were attached to the atoms as
generic data are retrieved and a 2D grid is generated along with an
OELinearColorGradient
object that is used to assign colors to the cells of the grid.
The colored grid is then rendered into the below layer of the
OE2DMolDisplay object, i.e., it appears underneath
the molecular diagram.
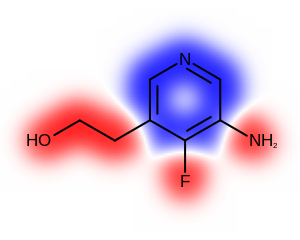
The image created by Listing 1 is
shown in Figure: Example of depicting a property map.
Listing 1: Depicting partial charges using property map
def SetPartialCharge(mol, tagname):
    oechem.OEMMFFAtomTypes(mol)
    oechem.OEMMFF94PartialCharges(mol)

    tag = oechem.OEGetTag(tagname)
    for atom in mol.GetAtoms():
        atom.SetData(tag, atom.GetPartialCharge())


mol = oechem.OEGraphMol()
oechem.OESmilesToMol(mol, "Cc1cc(cc(c1[N+](=O)[O-])F)[N+]#C")
oedepict.OEPrepareDepiction(mol)

tagname = "PartialCharge"
SetPartialCharge(mol, tagname)

width, height = 450, 350
opts = oedepict.OE2DMolDisplayOptions(width, height, oedepict.OEScale_AutoScale)
opts.SetAtomColorStyle(oedepict.OEAtomColorStyle_WhiteMonochrome)
opts.SetTitleLocation(oedepict.OETitleLocation_Hidden)
opts.SetScale(oegrapheme.OEGetMoleculeSurfaceScale(mol, opts))
disp = oedepict.OE2DMolDisplay(mol, opts)

propmap = oegrapheme.OE2DPropMap(opts.GetBackgroundColor())
propmap.SetNegativeColor(oechem.OEDarkRed)
propmap.SetPositiveColor(oechem.OEDarkBlue)
propmap.Render(disp, tagname)

oedepict.OERenderMolecule("Draw2DPropMapPartialCharge.png", disp)
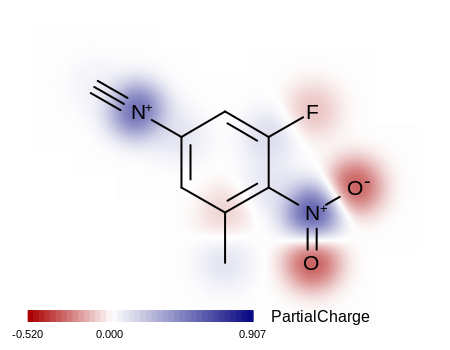
Example of depicting a property map
See also
Generic Data chapter in the OEChem TK manual.
When the OE2DPropMap.Render method is called,
the color gradient is initialized by searching for the minimum and
maximum values by the given tagname.
This means that when more than one molecule is depicted,
each depiction will have its own independent value range.
(See Figure: Example of depicting a property map).
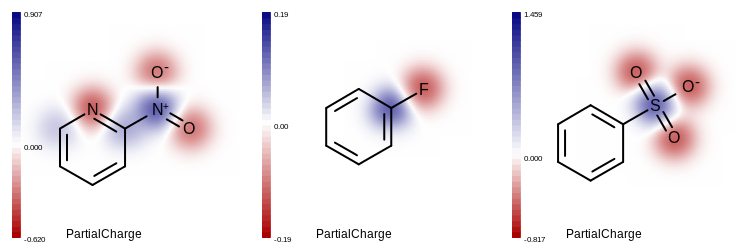
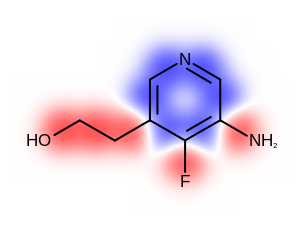
Example of depicting multiple property maps
In the Listing 2 example,
the value range of the property map is pre-set by identifying the minimum
and maximum atom partial charges for a whole molecule set.
See the result in
Figure: Example of depicting property maps in the same value range.
Each black box around the color gradient legend indicates the
range of the atom partial charges for the corresponding molecule.
Listing 2: Depicting multiple molecules using property map
def SetPartialCharge(mol, tagname, minvalue, maxvalue):
    oechem.OEMMFFAtomTypes(mol)
    oechem.OEMMFF94PartialCharges(mol)

    tag = oechem.OEGetTag(tagname)
    for atom in mol.GetAtoms():
        charge = atom.GetPartialCharge()
        atom.SetData(tag, charge)
        minvalue = min(minvalue, charge)
        maxvalue = max(maxvalue, charge)

    return minvalue, maxvalue


smiles = ["c1ccnc(c1)[N+](=O)[O-]",
          "c1ccccc1F",
          "c1ccc(cc1)S(=O)(=O)[O-]"]

minvalue = float("inf")
maxvalue = float("-inf")
tagname = "PartialCharge"

molecules = []
for smi in smiles:
    mol = oechem.OEGraphMol()
    oechem.OESmilesToMol(mol, smi)
    oedepict.OEPrepareDepiction(mol)
    minvalue, maxvalue = SetPartialCharge(mol, tagname, minvalue, maxvalue)
    molecules.append(oechem.OEGraphMol(mol))

width, height = 750, 250
image = oedepict.OEImage(width, height)

rows, cols = 1, 3
grid = oedepict.OEImageGrid(image, rows, cols)

opts = oedepict.OE2DMolDisplayOptions(grid.GetCellWidth(), grid.GetCellHeight(),
                                      oedepict.OEScale_Default)
opts.SetAtomColorStyle(oedepict.OEAtomColorStyle_WhiteMonochrome)
opts.SetTitleLocation(oedepict.OETitleLocation_Hidden)

propmap = oegrapheme.OE2DPropMap(opts.GetBackgroundColor())
propmap.SetNegativeColor(oechem.OEDarkRed)
propmap.SetPositiveColor(oechem.OEDarkBlue)
propmap.SetLegendLocation(oegrapheme.OELegendLocation_Left)

propmap.SetMinValue(minvalue)
propmap.SetMaxValue(maxvalue)

for cell, mol in zip(grid.GetCells(), molecules):
    disp = oedepict.OE2DMolDisplay(mol, opts)
    propmap.Render(disp, tagname)

    oedepict.OERenderMolecule(cell, disp)

oedepict.OEWriteImage("Draw2DPropMapPartialChargeMulti.png", image)
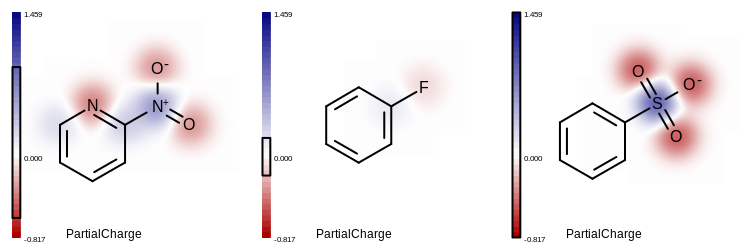
Example of depicting a property maps in the same value range
See also
OEImageGrid class in the OEDepict TK manual
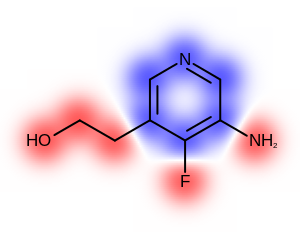
The above examples show how to project atom properties (such as partial charges)
into the property map.
However, the OE2DPropMap class can also be used to visualize
bond properties by attaching a value to each bond as a generic data using a tagname.
When the OE2DPropMap.Render method is called
with the same tagname, the property that was attached to a bond is retrieved and
projected at the middle of that bond before applying a Gaussian function to blur
out the 2D grid underneath the molecular graph.
The Table: Depicting atom or/and bond properties
table shows the differences between visualizing atom or/and bond properties using the
OE2DPropMap class.
|
|
|
only atom |
both atom and bond |
only bond |