Analyze Page
The Analyze page comprises multiple features, including a molecular spreadsheet; graphing capabilities; 2D and 3D viewing capabilities; subset creation, filtering and tagging; and numerous cheminformatics functions, such as substructure search, R-group decomposition, and property calculation. There is a robust regression feature with which users can add a multilinear regression best-fit prediction of a real-valued property using other properties. Floes that calculate new properties are also available from this page. One panel is devoted to presenting information on recent floes.
All panels can be moved, removed, resized, or duplicated. There are two preset views: a spreadsheet view and a 3D analysis view. Alternate options can be selected from the Layout drop-down.
The graphing feature can represent data with five different variables, some categorical and some continuous, via the choice of point shapes, size, color, and their x and y values. Scatter plots, box plots, histograms, heatmaps, and violin plots are available, where appropriate, for the selected data type(s). Multiple graphs can be created. Points can be selected by lasso or by point-and-click. Depictions of structures can be accessed for any selected points. The graph can be moved, panned, or reset. Scales can be changed from linear to log forms. Regression lines (with error bars) can be added. Box plots contain quartile ranges and other annotations. A screenshot of the plot can be taken and downloaded by clicking the camera icon located along the top of the plot panel.
Cells in the spreadsheet are tethered to points on the plot and also to 3D representations in the 3D Viewer. The 3D molecules can be overlaid with the query molecule if desired. In addition, if you navigate to the 3D Modeling page, the currently selected molecule will be available for further examination.
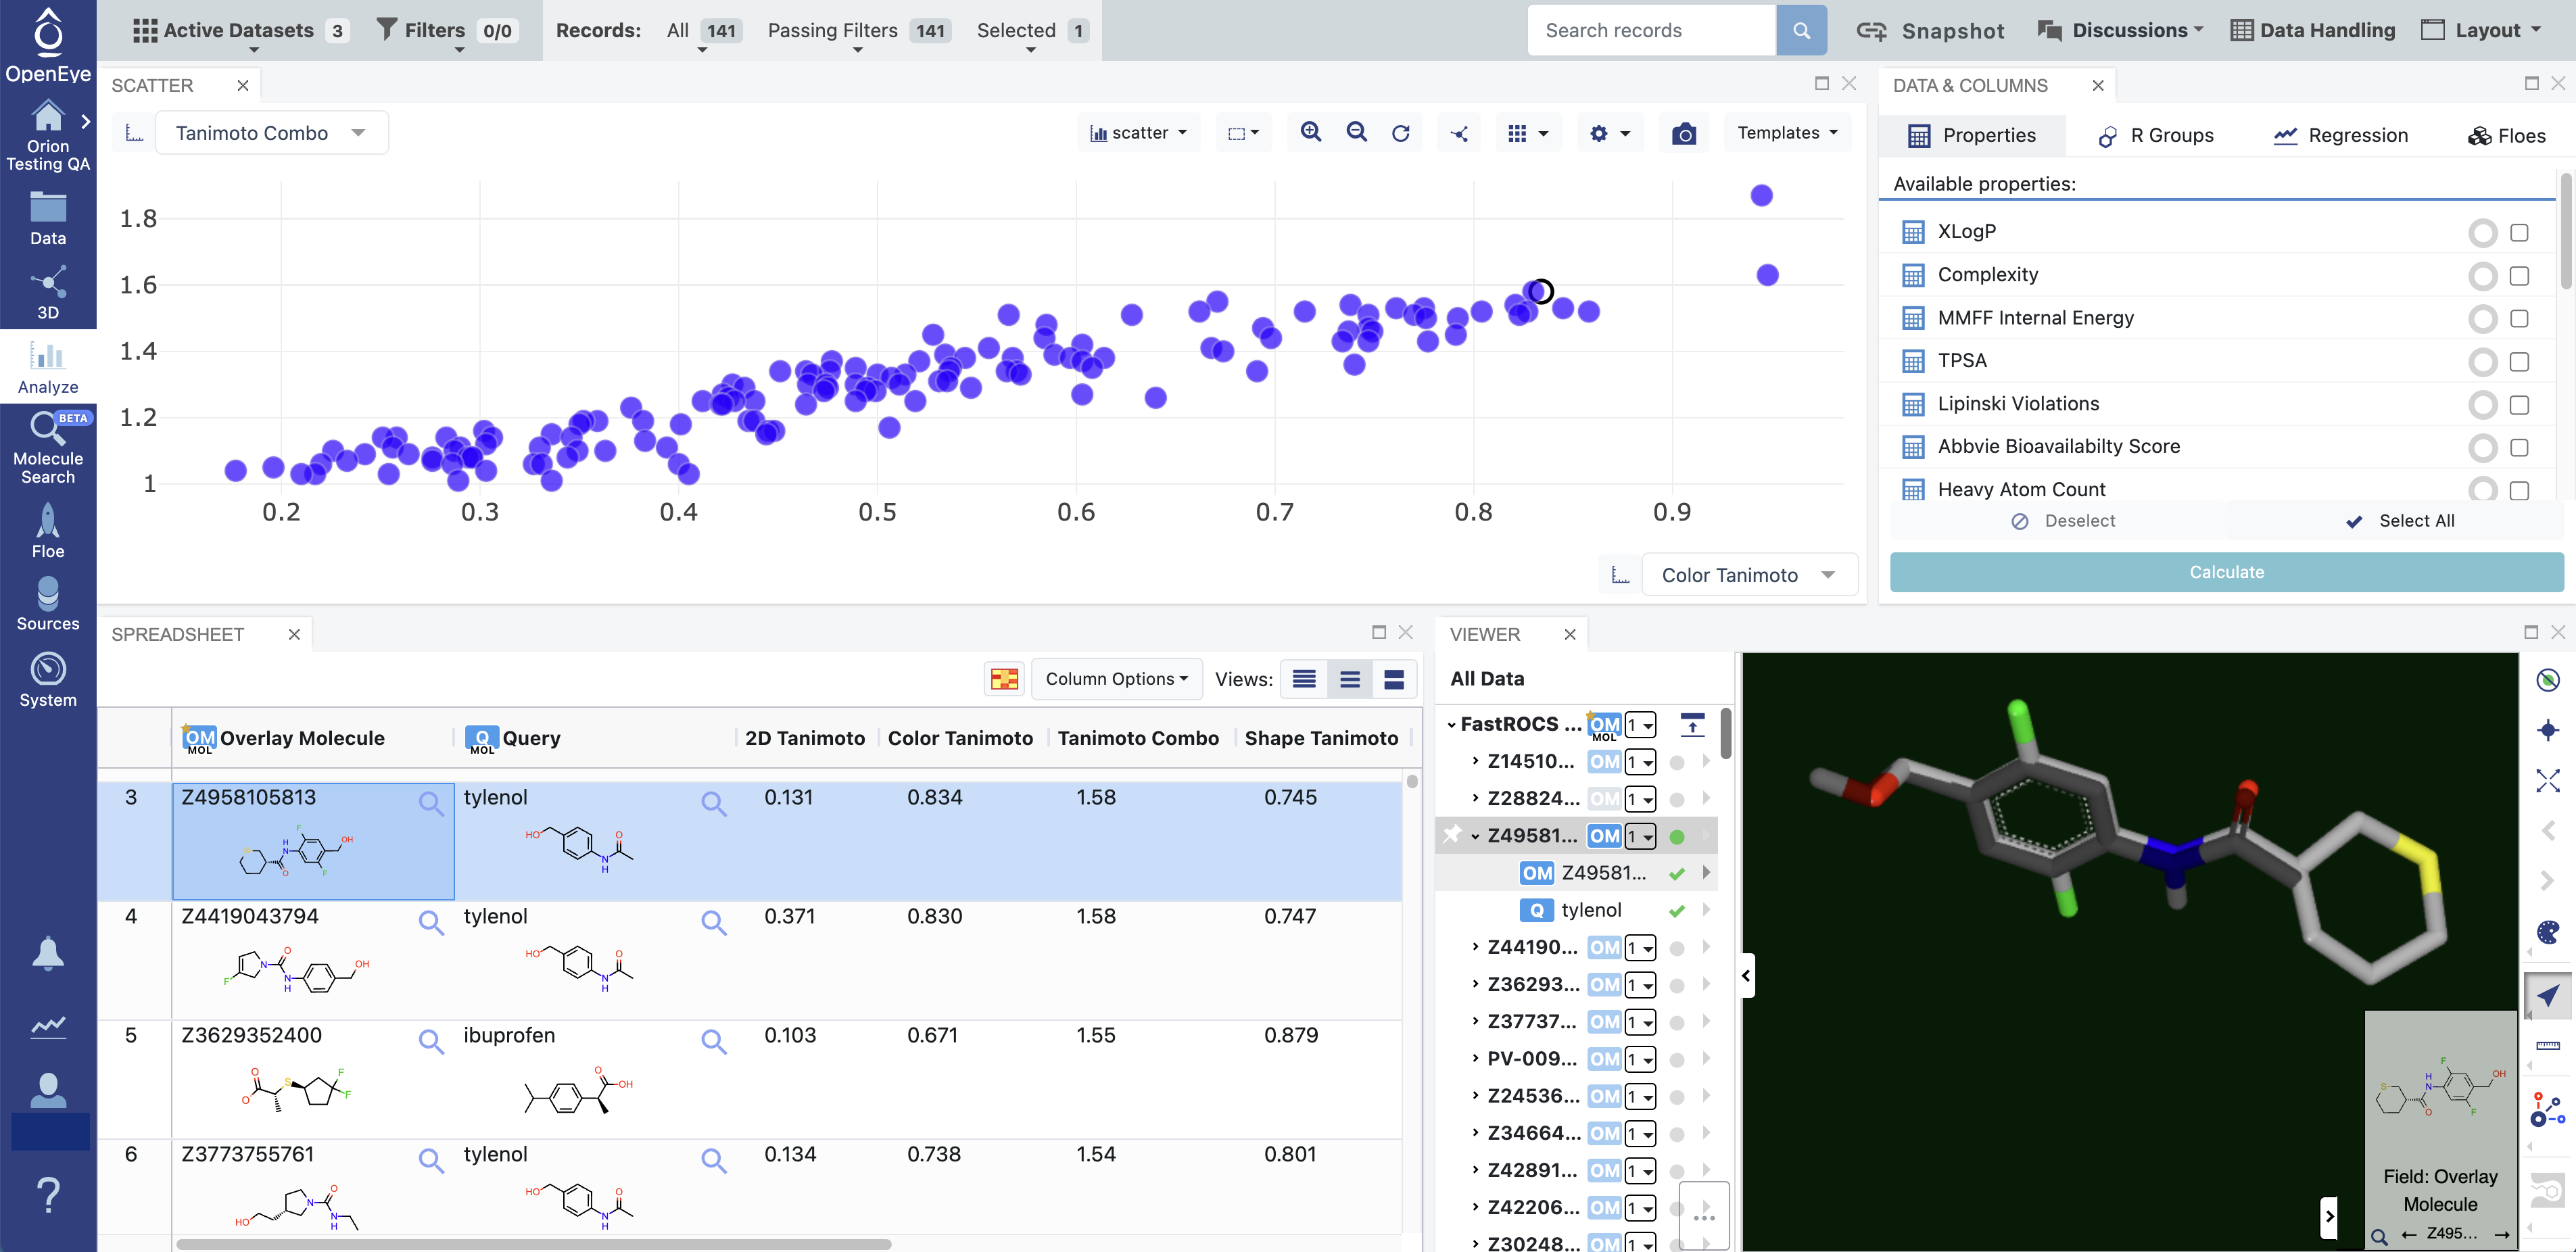
Figure 1. When a point in the plot is selected, the spreadsheet navigates to the row representing that molecule. Selecting a row in the spreadsheet navigates to the corresponding point in the plot. If the 3D Viewer panel is chosen in the layout, the selected point will also appear as a 3D structure and can be overlaid with the query molecule, as shown here. The query molecule, Tylenol, appears in dark grey.
Spreadsheet
The spreadsheet allows typical actions: column sorting, pinning, reordering or deleting, and indication of selected rows. Pop-up views of structures are also available.
The spreadsheet data can be manipulated by the Data Handling feature that permits a user to specify various aspects of the data, such as whether certain columns are visible or not. It also enables a style to be chosen for treating imprecise data (for example, ranges, inequalities, and multiple values). This feature can be accessed from either the the spreadsheet icon at the top right of the Active Data Bar or from the ‘Column Options’ drop-down in the spreadsheet.
Hint
The Data Handling feature allows users to apply column settings to all data columns of the same name.
Spreadsheet cells can be copied to the clipboard, sent to other tasks in Orion, rated, or tagged.
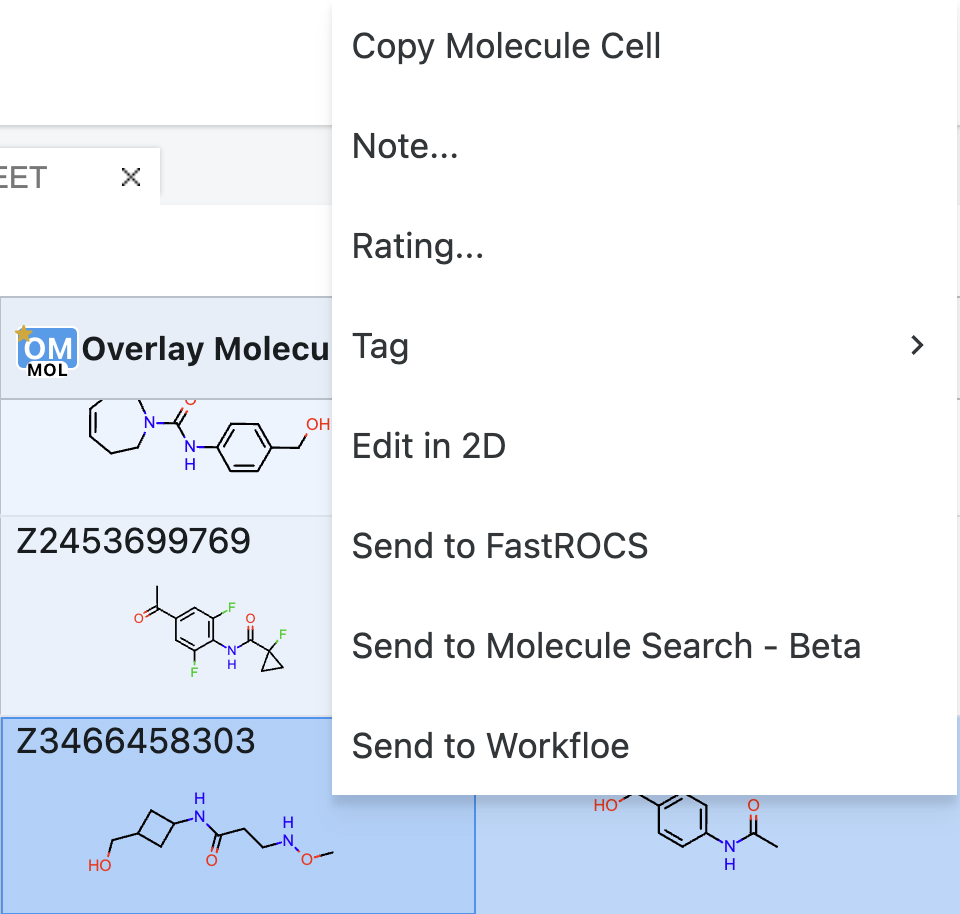
Figure 2. Spreadsheet cells can be manipulated for further use in Orion. To access this menu, right-click in the desired cell.
JSON data fields are viewable in the spreadsheet.
Categorical string fields can be filtered using a “free text” setting. This allows creation of filters that can match multiple distinct categorical values that contain a provided string.
Components of the Analyze Page
Name |
Description |
|---|---|
Graphing Panel |
Allows users to create plots. The plot type (scatter, boxplot, heatmap, histogram, or violin) can be
selected from the Plot drop-down menu.
|
Spreadsheet |
Displays imported data, molecular structures, and images. Users can append calculated properties, such as PSA
and XLogP.
|
Data & Columns Panel |
Allows users to compute molecular properties, perform R-group decomposition, and predict properties using
a regression model.
|
Layout Drop-Down |
Allows users to customize the panels on the page, including 3D viewing with the Analyze with 3D mode, Job
History, Jobs, and Floes.
|
Hint
The Snapshot option allows users to create a link to the current state of the Analyze page, either to share that page with other project members or to return to the same state after switching to a different project or task.