Floe Page
Floes are the core of Orion®. Floes are constructed of connected cubes, which are small programming elements that send and receive messages to and from other cubes to perform specific tasks. Ready-to-use workflow (floe) packages prepared and provided by OpenEye, Cadence Molecular Sciences, and partners are good starting points to pursue computational chemistry solutions on the Orion platform. These floes can be run from the Floes Tab. For more information on the floe packages we offer, see the Orion Suites and Modules User Guide.
Note
Only Managed Service customers can use OCLI and Python to make their own cubes and floes. These customers can find more information in the Programming Guide about developing their own floes and cubes in Python using Orion Platform APIs.
Floes Tab
Prepared floes can be found in the Workfloes Tab on the Floe page. This tab includes all floes and packages that have been developed by OpenEye, Cadence Molecular Sciences. Figure 1 shows the basic layout of the Workfloes Tab. The left-hand pane shows options to filter the floes. The middle pane shows the list of floes generated from the Floe Filters. The right-hand pane shows more detail about the selected floe. All floes can be launched from this tab.
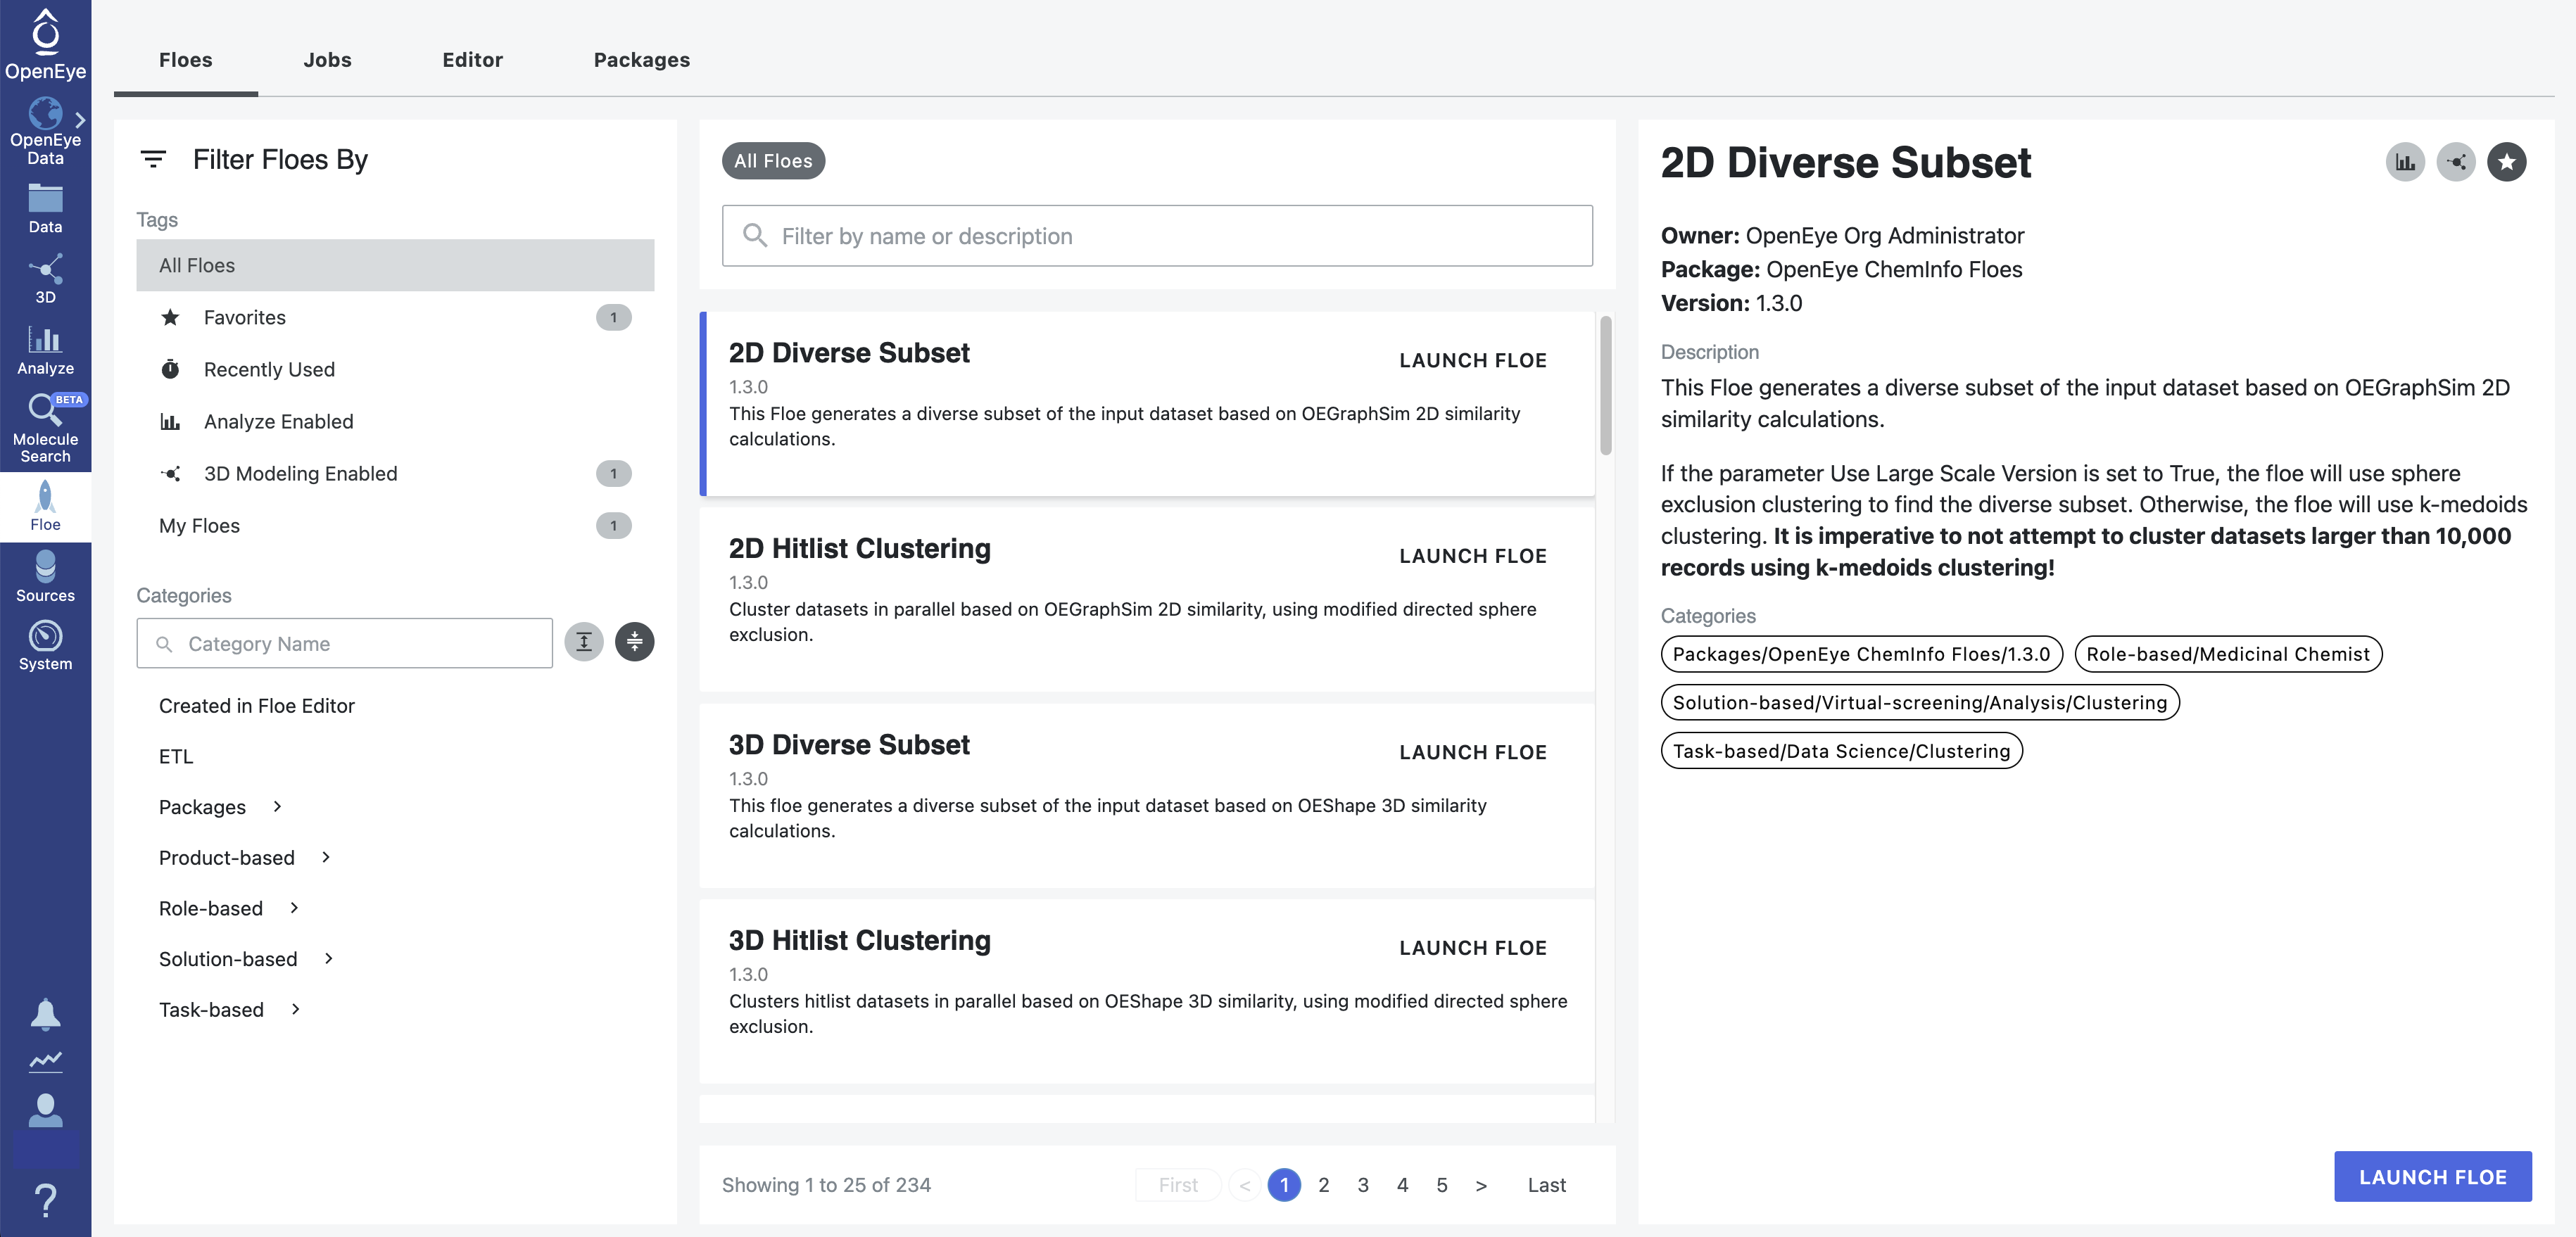
Figure 1. The Workfloes Tab.
How to Find a Floe in Orion
Floes can be found using the search bar or the Filters in the left-hand pane. These methods are described here. In all cases, applicable floes will appear in the center pane, and more detail about the selected floe will appear in the right-hand pane.
Note
Filters, as well as previous search words remaining in the search bar, affect the selection of floes available in the middle pane. For example, if you select the “3D Analyze Enabled” filter and then select the floes under “Product-based / OMEGA,” the middle pane will show only floes that are enabled both for the 3D & Analyze page and in the category Product-based/OMEGA. Filters can be cleared by clicking the X in the main search bar and any filter labels above the search bar. Category names in the Filter search bar do not need to be cleared to clear the overall filtering.
You can search for a specific floe or term (e.g., dock or NES) using the “Filter by Name or Description” search bar in the middle pane.
In the left-hand pane, the Filters allow easy access to favorite floes, recently used floes, those enabled for 3D analysis, or, under My Floes, those that you have created. Floes may be tagged as Favorites or 3D Analyze Enabled by clicking the sliders in the right-hand pane of a floe description. Floes that are tagged as 3D Analyze Enabled may be accessed from the 3D & Analyze page.
The Category Filters offer several options for navigating to a floe using the categories.
The ‘Created in Floe Editor’ category shows floes that do not have an associated package. Only Managed Service customers can develop their own cubes and floes.
The ‘Molecule Search’ category shows floes that can be used to create databases and collections for Molecule Search.
The ‘Packages’ category groups floes according to the packages in which they are built. For example, choosing the OpenEye MD Affinity Floes from the ‘Packages’ drop-down menu displays the floes associated with that package.
The ‘Product-based’ category corresponds to the names of OpenEye, Cadence Molecular Sciences, products, such as BROOD or SPRUCE. When you select a product, a list of floes associated with that product will appear in the center pane.
The ‘Role-based,’ ‘Solution-based,’ and ‘Task-based’ categories contain several subcategories and may require several clicks to get to a specific list of floes.
Many floe packages in the Orion Workflows Guide include possible category paths in their floe descriptions. If you know the floe you would like to use, you may use a defined path to locate the floe.
Alternatively, you can search for a floe or topic using either the “Category Name” search bar in the left-hand pane or the “Filter by Name or Description” search bar in the middle pane. The search will yield a list of relevant floes.
The Job Form
After you locate the desired floe, click the “Launch Floe” button on that floe description. A Job Form will appear, as shown in Figure 2. Job Forms vary in length and detail, depending on the complexity of the floe. They include a short description of the floe, job properties, input files, outputs, and all parameters that are required to run the floe. Cost limits may also be set specifically for this job. Under Job Properties, there is a field for the output path. The default path is Project Name / My Data. Please note that the project name must match the project you are currently in. You may create a new directory name or path if you prefer. For example, if your project name is Conformer Project, and you want to keep your output from OMEGA floes in a separate folder, you could create a subfolder in the My Data folder called “Omega Floes.” Your new path could then be Conformer Project / My Data / Omega Floes. Clicking on the up arrow will take you up a level in the directory. You may type in a new subfolder in the box, or select one of the choices that appears.
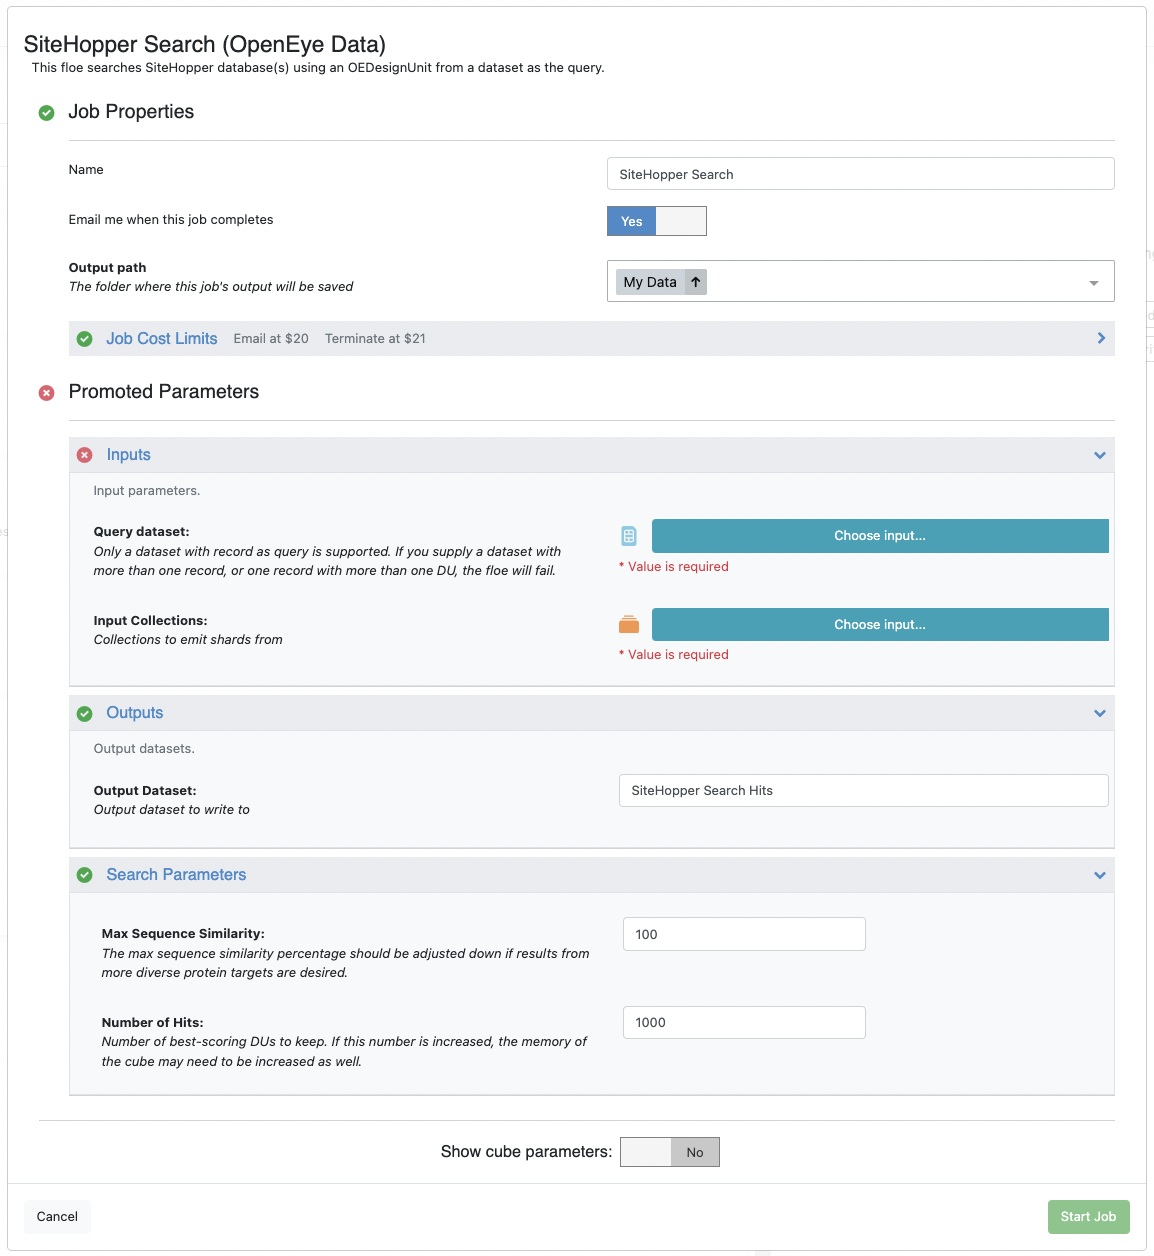
Figure 2. The Job Form for the BROOD – Query Builder Floe.
Complete the Job Form as indicated. For more information on running a specific floe, please consult the Orion Workflows Guide. Tutorials in each floe package offer guidance in this process. When you are ready to run the floe, simply click the “Start Job” button.
Jobs Tab
After you start a floe, you can go to the Jobs Tab for information on the job and to watch its progress in real time.
Here, a list of all past and current jobs can be found. The job ID, creation date, and status can be checked. Additionally, tags can be added to jobs for better organization, debugging data can be requested, and results for a specific job can be accessed.
Note
The status of biomolecules imported on the Data page and of files that are being uploaded to the Data or 3D & Analyze pages can be checked in this tab.
Figure 3 shows the components under the Jobs Tab. The names of the jobs on the list were chosen on the Job Form prior to running each floe. In addition, a slider allows you to include system jobs in your list. This will show jobs that are associated with the ETL (extract, transfer, and load) floes.
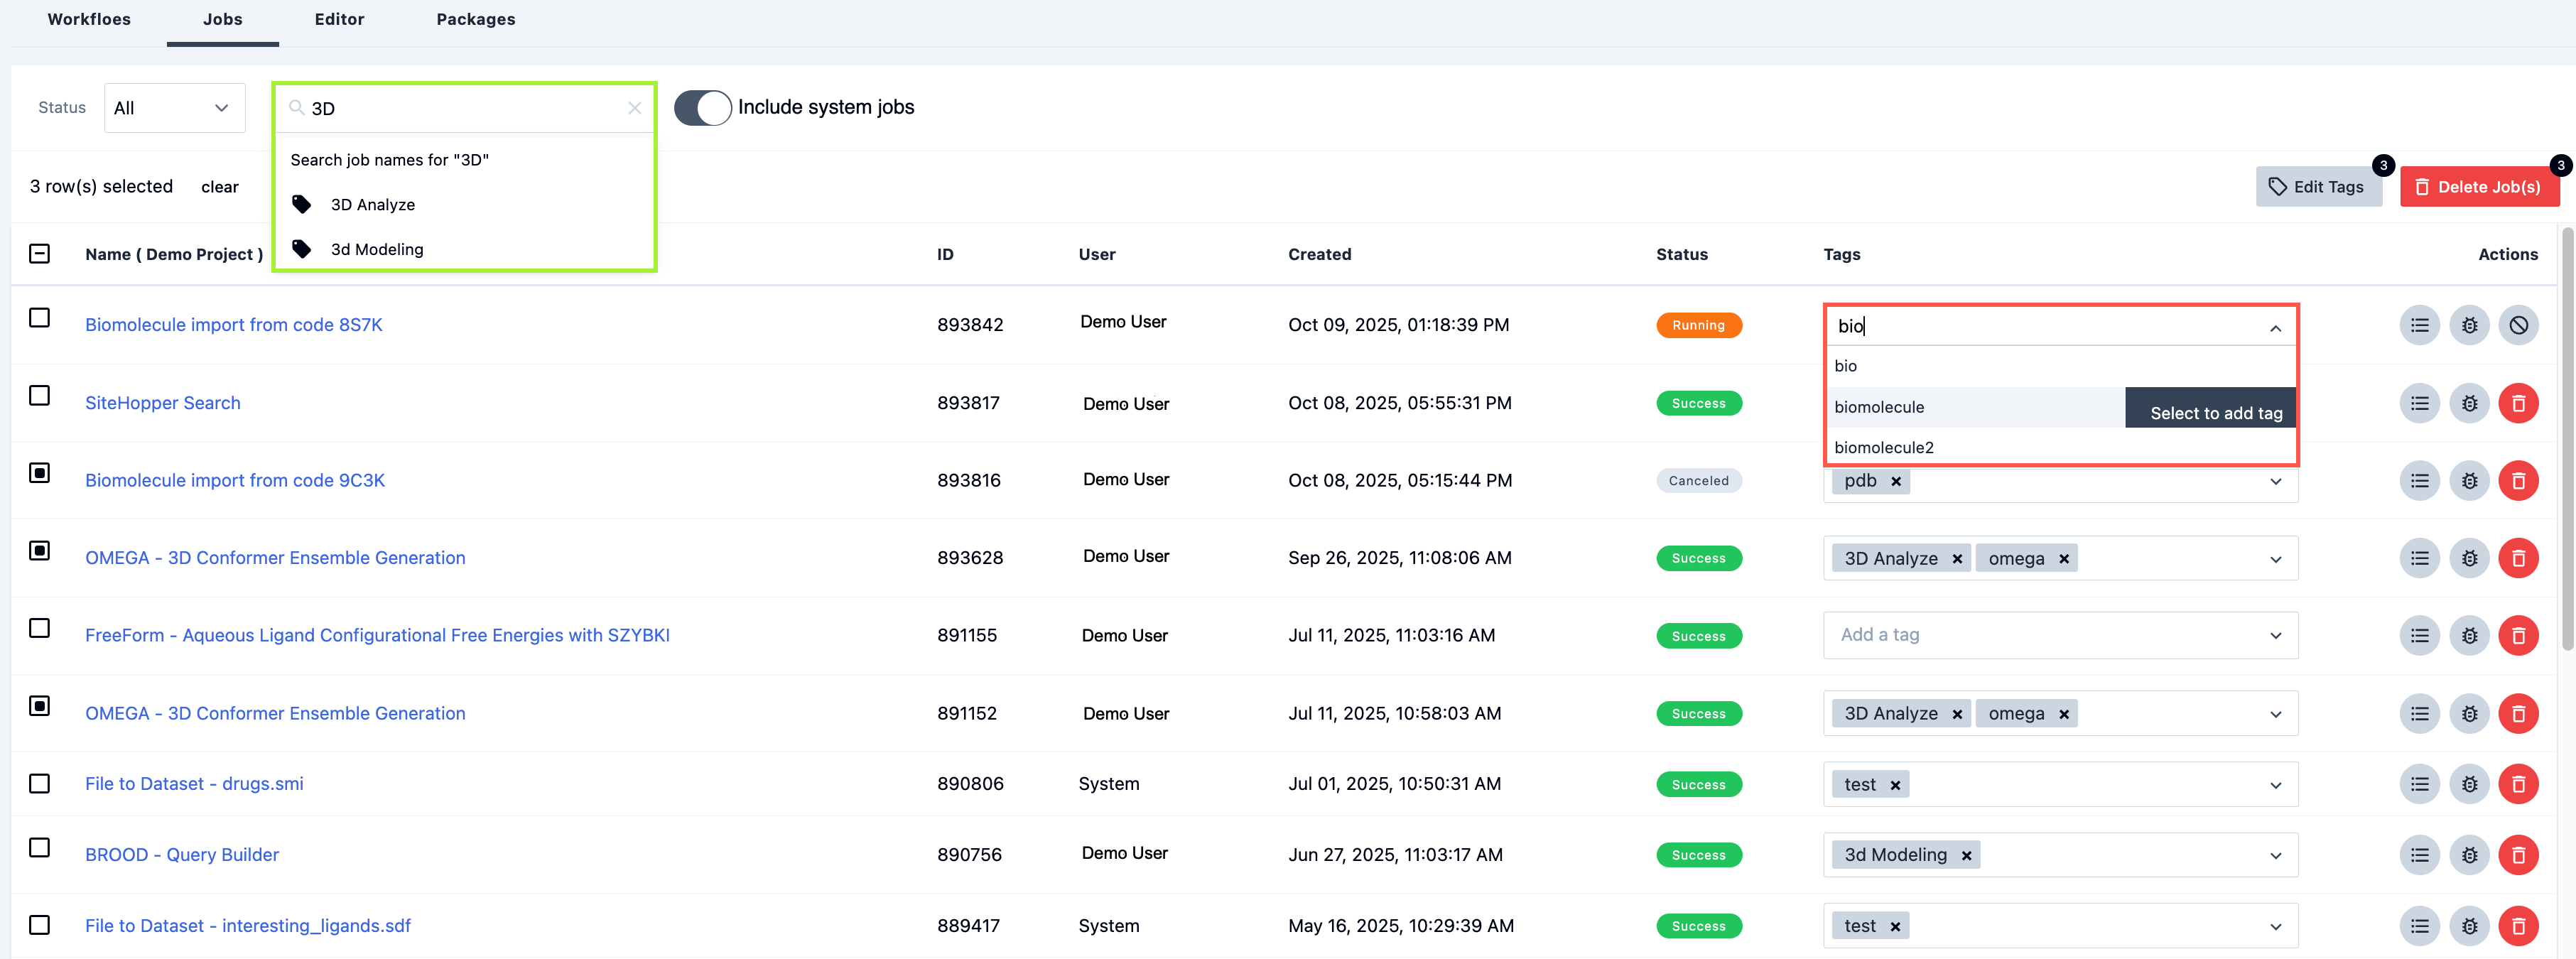
Figure 3. An example of the options within the Jobs Tab. The icons under the Actions column, from left to right, allow you to view results, request debugging data, and delete a job (or cancel a running job). Green inset: Search bar. Red inset: How to enter a tag.
The Status column shows the progress of each job: completed jobs show “Success” in green, “Canceled” in grey, or “Failure” in red, and jobs that are running show an orange status of “Running.” Jobs that are being canceled, but where the data cleanup is in progress, have a status of “Other.”
Tags enable the jobs to be labeled with a keyword for grouping and sorting. They can be added by clicking in the “Add a tag” drop-down. See the red inset in Figure 3. As you type, suggestions appear depending on the letters you type. You can continue to enter your tag name or select one of the options provided. For a new tag, click the “Add this as new tag” button. Tag names you have used previously will appear if they contain the letter(s) you typed. For example, if you have tags named “biomolecule” and “omega” and you type “bio,” “biomolecule” will appear as an option for a tag, but “omega” will not. To include another tag, simply click on the existing tag and add another tag phrase or keyword. Suggested tags can be added by simply clicking on the name. A tag can be removed by clicking the X next to the tag.
To filter jobs using the search bar, enter a tag, user, job name, or job ID. Predictions will appear as you type. Click on your desired “search by” suggestion. All jobs associated with that “search by” name will be filtered and displayed. See the green inset in Figure 3. The checkboxes on the left allow you to apply tags to selected jobs or to choose jobs to be deleted in bulk. When jobs are selected with the checkboxes, “Edit Tags” and “Delete Job(s)” buttons appear above the list of jobs, with numbers to show the number of jobs chosen.
The Status drop-down acts as a filter only when a floe is running.
Under the Actions column are three icons. The results of a specific job can be accessed with the “Menu” icon. Clicking this button switches you automatically to the Data page and shows any datasets or collections generated by the job. Clicking the “Bug” icon generates a dialog box asking whether you would like to receive an email containing debugging information. The downloadable debugging .tar.gz file can be sent to OpenEye support for assistance. Lastly, a job can be deleted by selecting the “Trash” icon. A pop-up window will appear to confirm the deletion of the data and job.
Detailed Job Information
To view information about a specific job, click on its name. You will be transferred to a page that gives access to information about the job, the visualization of the floe with its corresponding cubes, and the Reports and Results of the job.
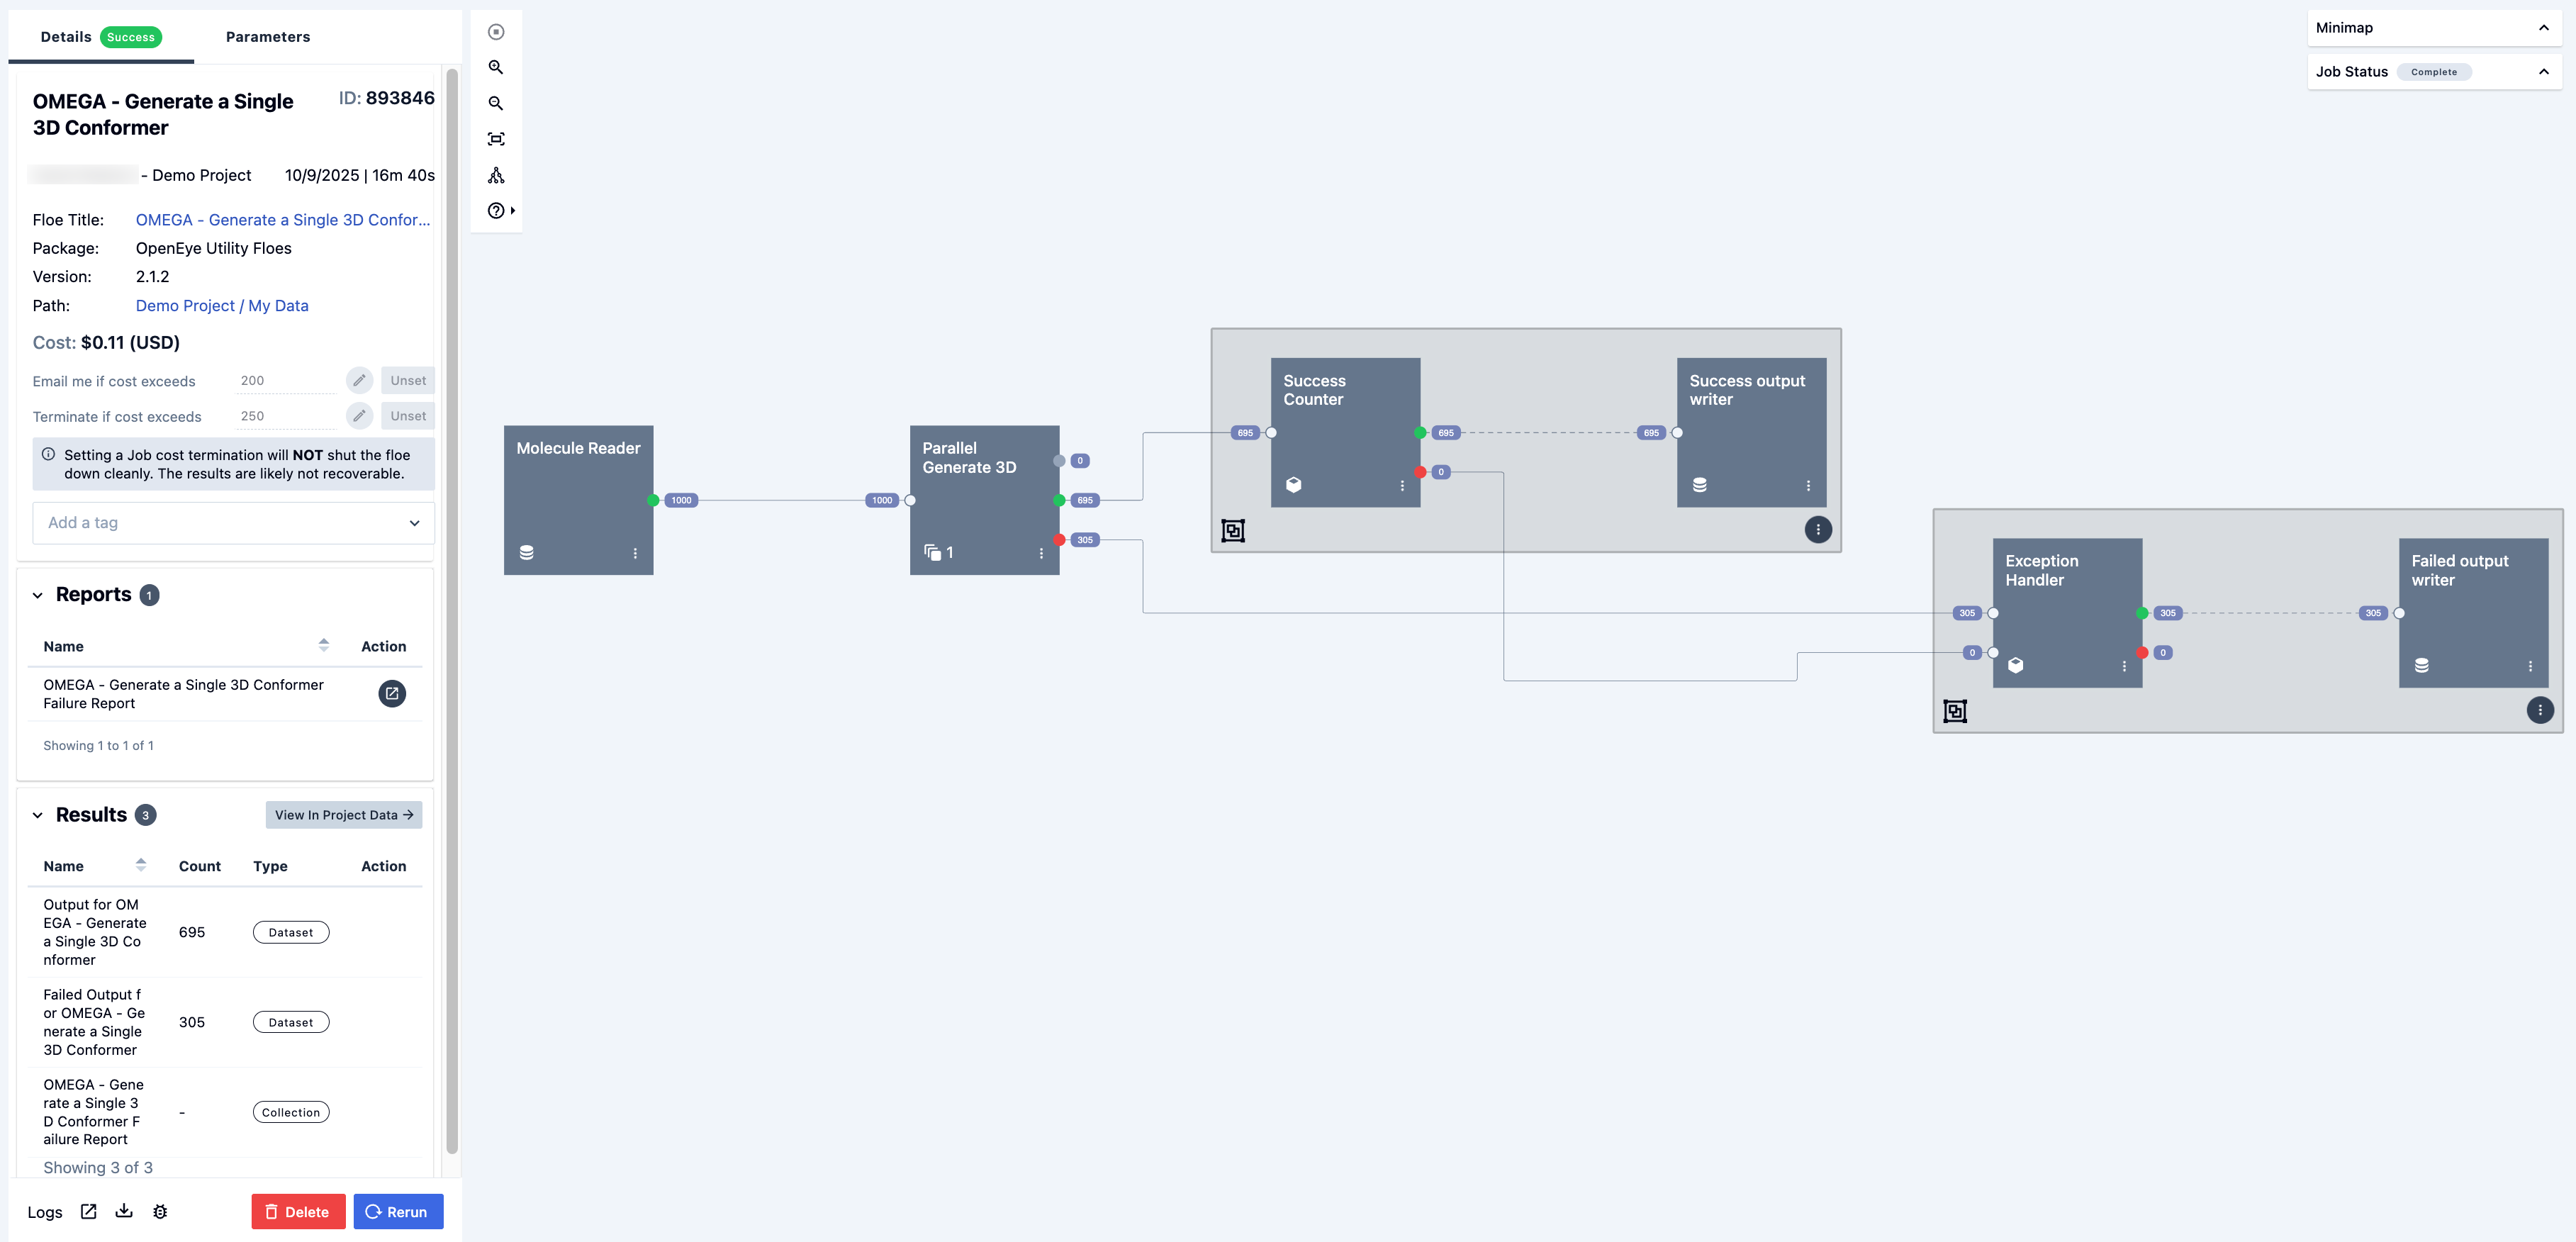
Figure 4. Detailed job information for the OMEGA – Generate a Single 3D Conformer Floe.
As shown in Figure 5, the Details Panel includes information such as the duration, source floe, and cost. The job can be renamed, if desired. Clicking on the Floe Title link opens a new Job Form for the floe. Clicking on the Path link leads to that path on the Data page. New job tags can also be added here. The log stream can be viewed or downloaded, and the debugging report can be made for Orion support.
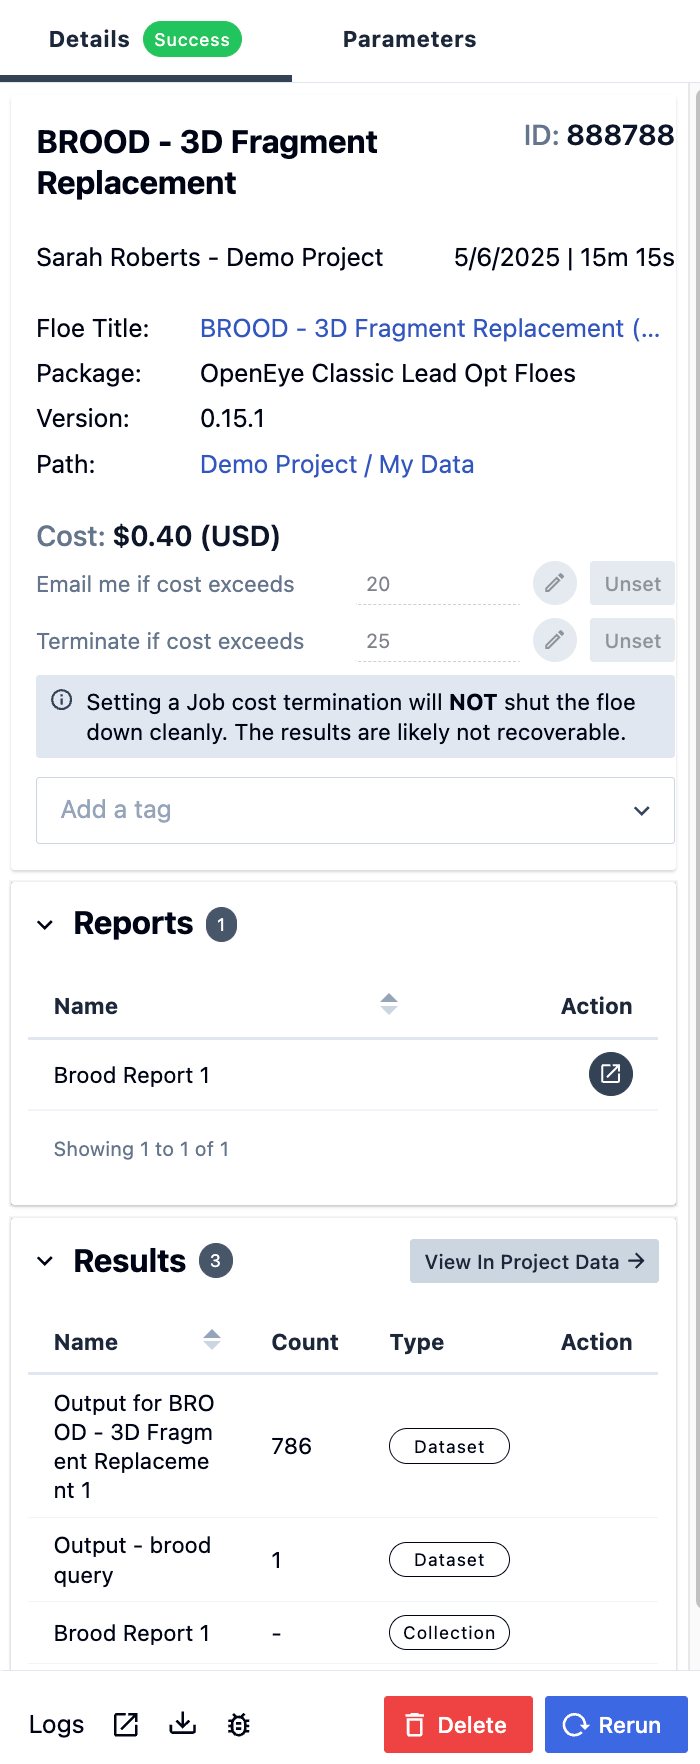
Figure 5. The Details Panel for the OMEGA – Generate a Single 3D Conformer Floe.
Cost notifications can be changed in real time while a floe is running. Any changes made to the cost notification here will affect only the open job and not the global cost notifications under the user’s profile. Job cost alerts can be set in the Profile section for all floe runs. You can also modify job cost thresholds in the Job Form before launching a floe. The cost of a completed floe appears in the Details section of the Job Panel.
The Results section lists datasets and collections created during the floe. It includes the name, record count, and type. These files can be accessed by clicking the “View in Project Data” button. The Reports section gives access to the Floe Reports; clicking the icon will open the report in a separate tab in the browser. Both the Results and Reports sections are collapsible.
At the bottom of the Details Panel, information about the logs can be obtained. The “Open in New Tab” icon allows you to see the logs in a separate browser tab. You can also download job logs and request debugging data. Also at the bottom of the Details Panel, there are buttons to delete or rerun a job. When you rerun a job, the Job Form opens with the parameters from the initial job entered.
The Parameters Panel lists the inputs for the job. A slider at the top offers the option to see all parameters or only those set by the user. Parameters are broken into the groups listed in the Job Form: Input Parameters, Output Parameters, and Promoted and Required Parameters. Cube parameters are also available underneath the floe parameters. All parameter sections are collapsible. Inputs can be viewed both while the job is running and after the job has completed. Input datasets include a hyperlink so they can be easily located by resource ID in the Data page.

Figure 6. The Parameters Panel for the OMEGA – Generate a Single 3D Conformer Floe.
Generating the Debugging File
If you need support, the debugging file is vital to provide to the OpenEye Support team, as it will facilitate the resolution of most errors you have encountered. To request the debugging data, click on the “Bug” icon in the Jobs Tab. The notification pop-up window will ask if you want to request the data, and you will receive an email that includes a link to the downloadable debugging file. Please download the file and attach it to your email to OpenEye Support.
Alternatively, you can click the “Bug” icon in the Logs section at the bottom of the Details Panel.
Floe Visualization
When a floe is launched, its progress can be followed graphically and in real time. A floe in progress can be seen in Figure 7, with different colors indicating the status of the cubes. This floe map shows the connectivity of the cubes, including input and output ports. It also includes drop-down menus for a mini-map, which allows you to focus on specific areas of the floe, and for the overall job status, where you can download or view the logs. Buttons to delete or rerun the job are also found here. The toolbar allows you to zoom in or out and fit to screen. Clicking on the question mark shows a key to the icons and the colors of the cubes.
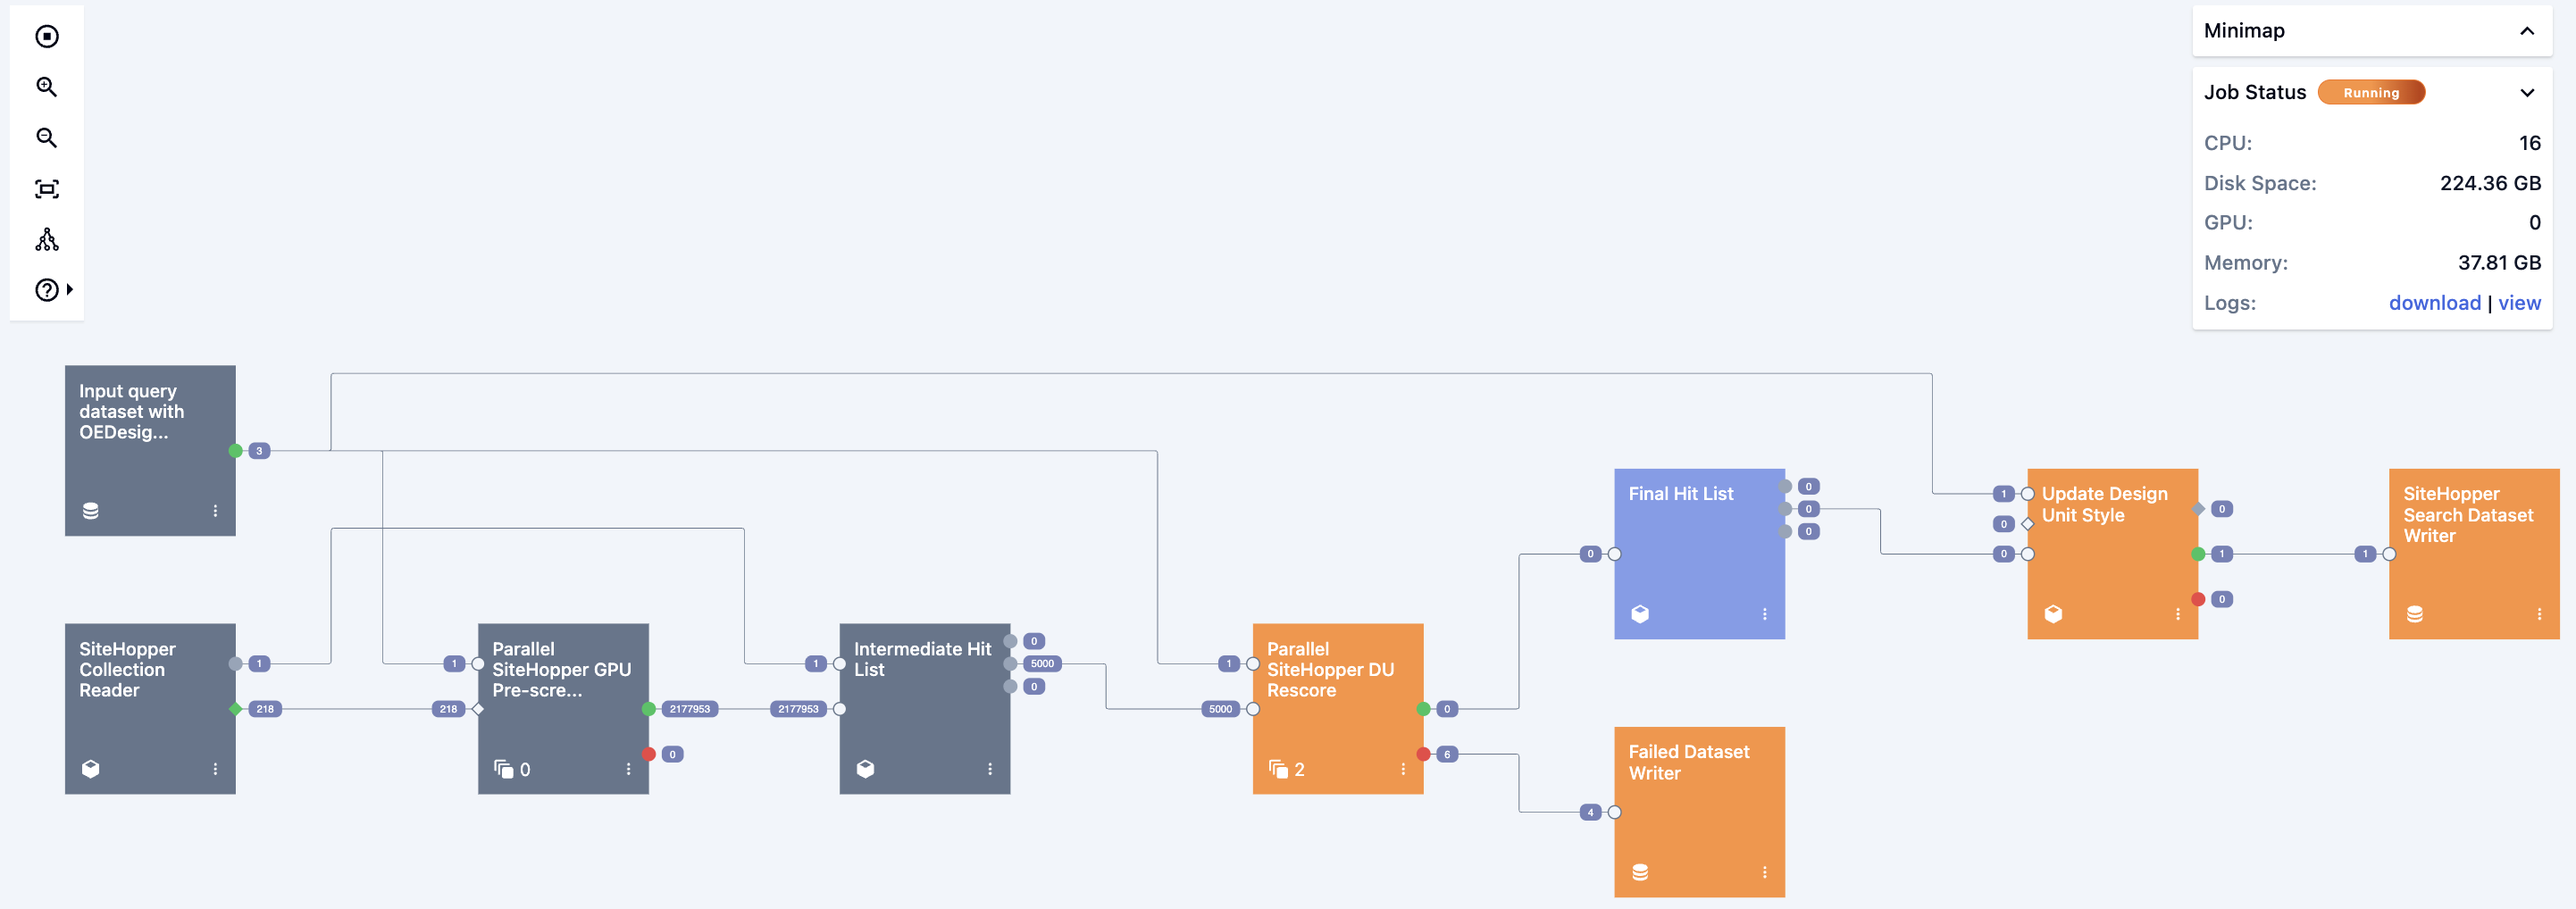
Figure 7. An example of a running SiteHopper Search job. The running status of the job appears in orange.
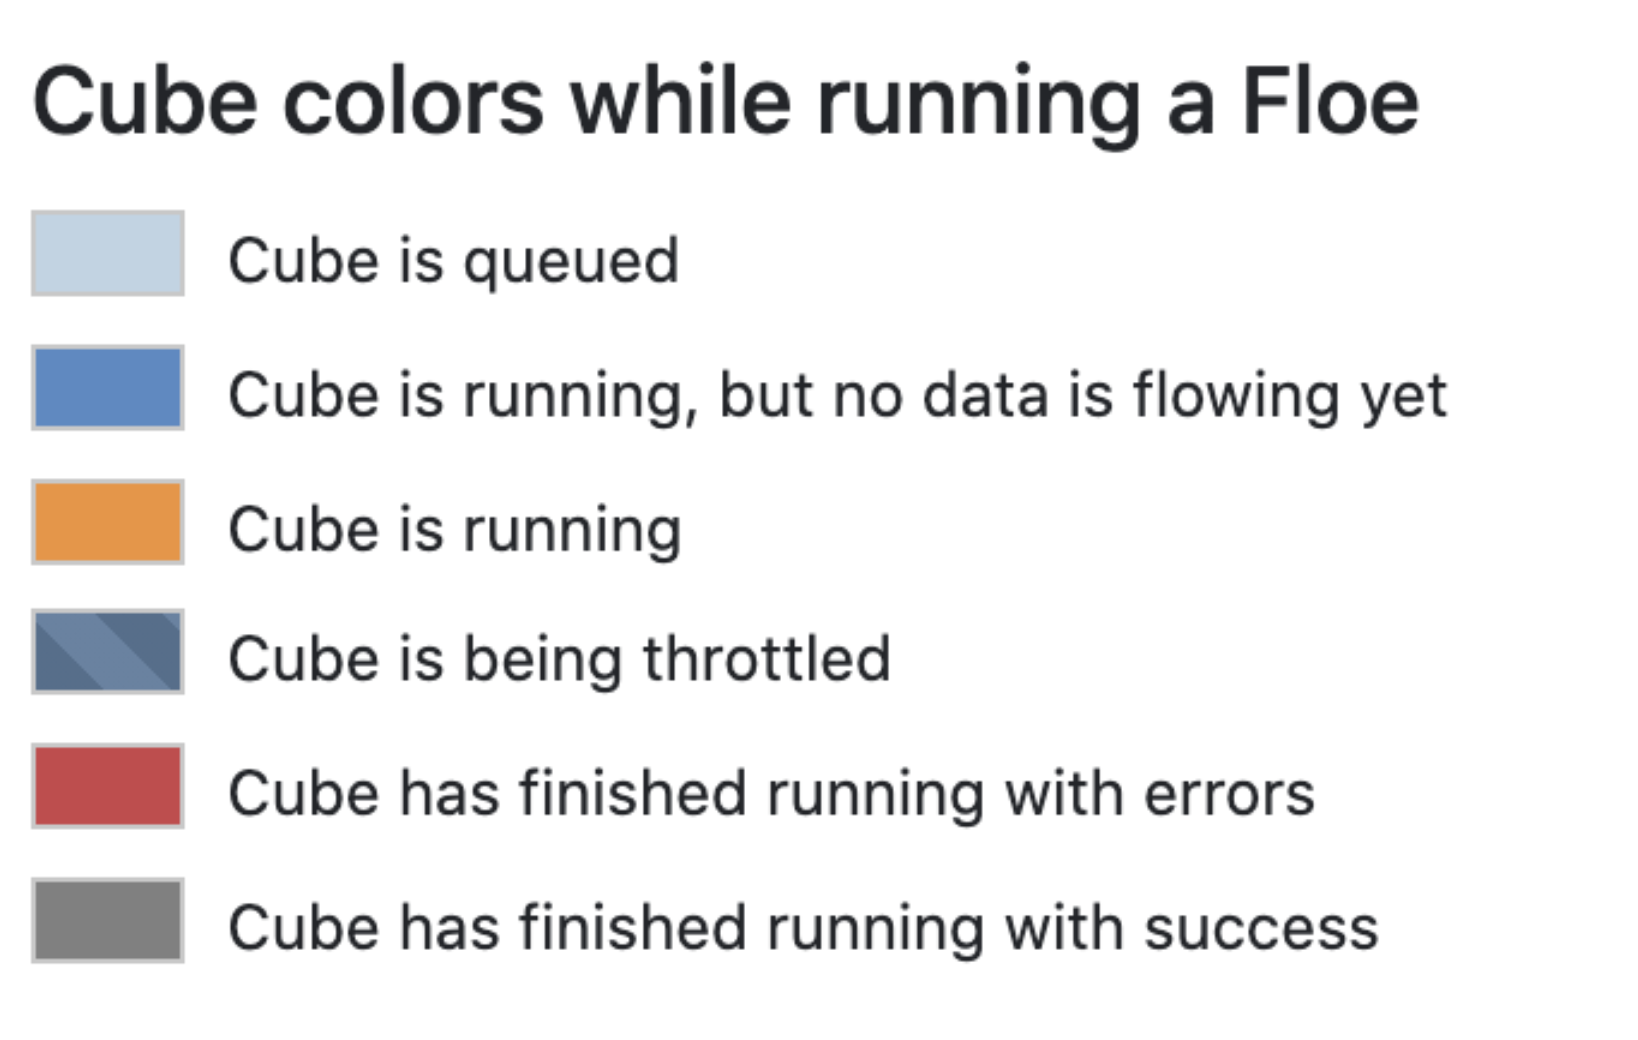
Figure 8. The key of cube colors and icons.
A few cube colors require clarification. In comparison to light blue cubes that are queued, dark blue cubes are running properly but are waiting for data from cubes that are upstream in the floe or for computational resources. Occasionally, some cubes have a striped status of “Throttled.” This indicates that the resources on your stack are overwhelmed and that the API requests (retrieving, uploading, or downloading data) from that cube are pending or significantly slowed down. Additional explanations for a cube being throttled may include idleness/unresponsiveness, cube errors, insufficient resources, or low memory. A cube alternating between “Running” and “Throttled” is not always indicative of an issue with your job. If you encounter cubes with a status of “Throttled” for more than a few hours, please contact OpenEye Support.
Additional Cube Information
Cubes have a basic structure with an input port on the left and output ports (such as success and failure) on the right. Each output of one cube is connected to the input of another cube. Hovering over the cube shows the name of each input or output port. Specific information about the cube, such as parallel instances, is shown by the symbol in the lower left corner and defined by the key in the toolbar Help button (Figure 8). For an example of the general cube structure, see Figure 9. In some cases, several cubes are paired together in a larger cube group, as seen in Figure 12.
Occasionally, the time required for serialization between cubes can be longer than running the cubes themselves. Cube groups increase efficiency by grouping sequential cubes together to be executed by a single process, thus minimizing the cost of sending data from one cube to another. All the cubes in a group run on the same instance, which is generally faster than passing data around to different instances.
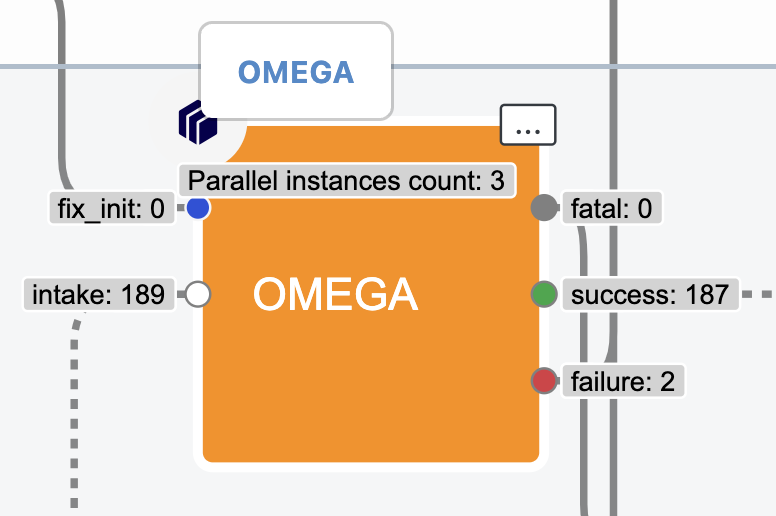
Figure 9. The general structure of the Omega Cube.

Figure 10. The cube menu for the Macrocycle Filter Cube.
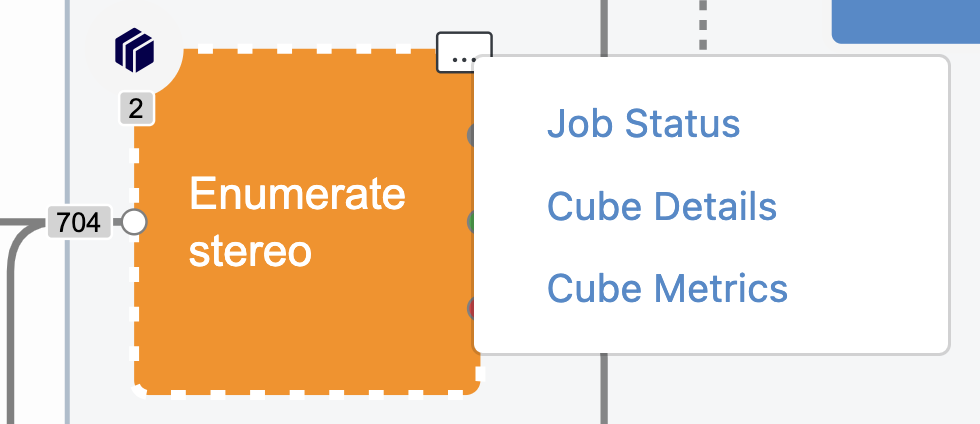
Figure 11. The cube menu for the Enumerate Stereo Cube, which is part of a cube group.
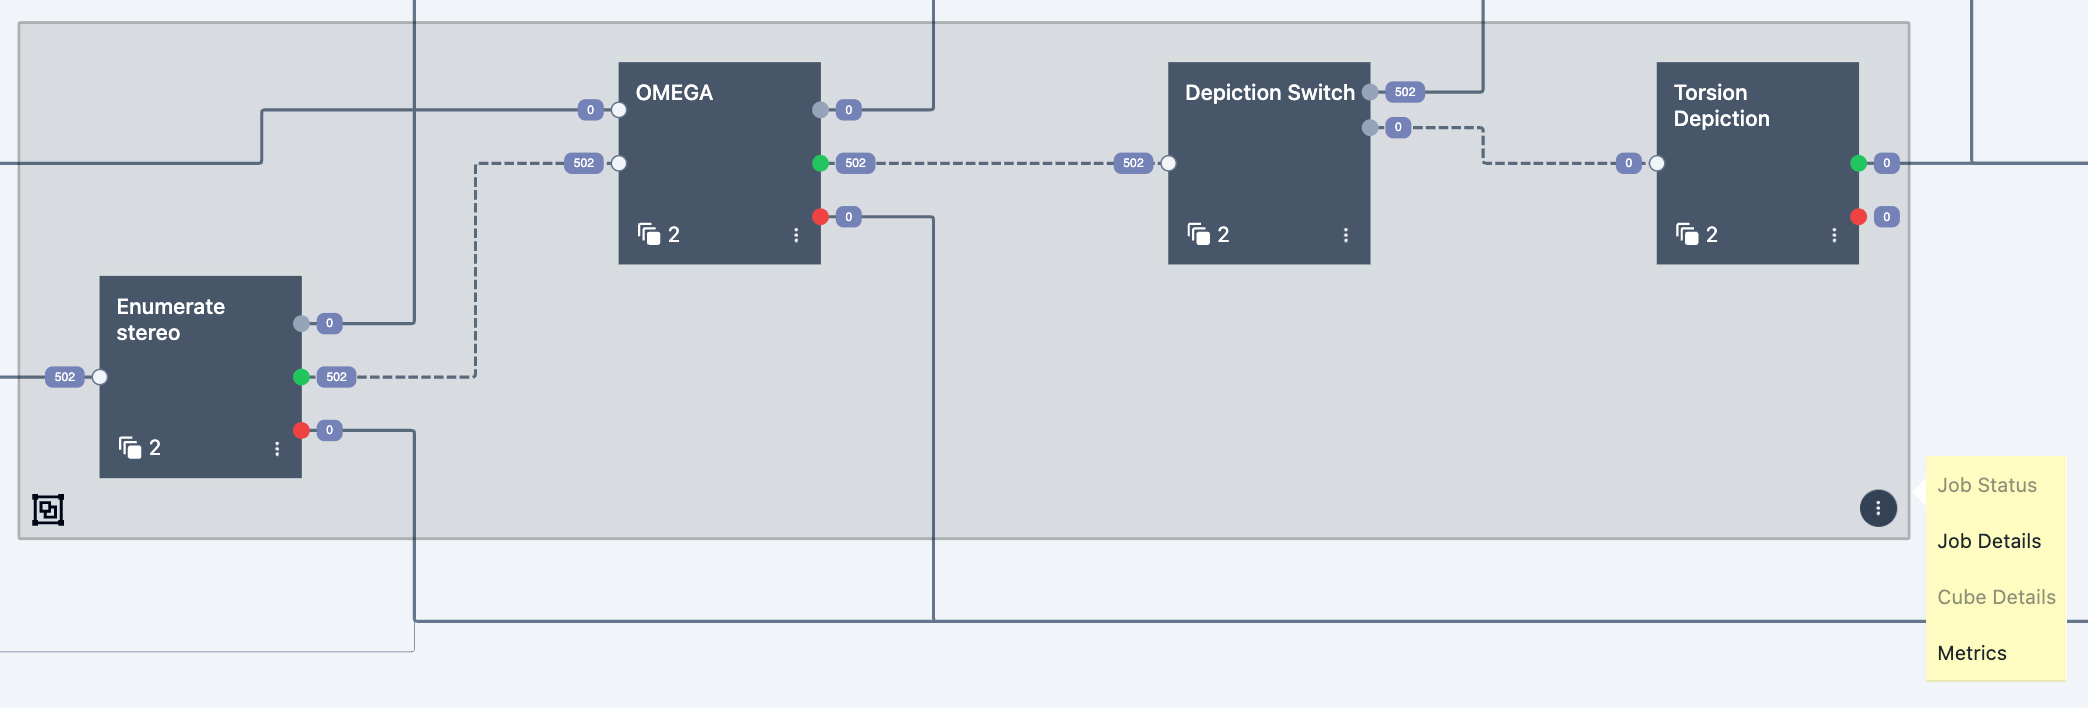
Figure 12. The cube menu for a cube group in the OMEGA - 3D Conformer Ensemble Generation Floe.
Clicking the three dots on the lower right reveals a cube menu, as seen in Figure 10. Cubes that are not within a group will give access to all information for the cube. The menu for cubes that are part of a larger cube group will give access only to Job Status and Cube Details (Figure 11), and the cube group menu (Figure 12) gives access to Job Details and Metrics for the entire group. Job Status gives information about the input/output ports and processing times. The Job Details include information such as CPU/GPU usage and disk space. The Cube Details show limited information about the cube. Metrics can be seen in Figure 13 and show the following:
Work Available: Work that is not yet assigned to a worker.
Work In Flight: Work that is assigned to a worker.
Result Available: Finished items of work emitted by parallel workers waiting to be sent downstream.
Count: Number of active worker instances.
Desired Count: Target number of active instances, indicating the scaling of the parallel cube.
Setting the memory and disk space metrics before running the job could identify the memory and disk space being used, but this is rarely done for practical reasons; they are turned off by default.
Both Cadence onCloud and Amazon charge for metrics, so having them on by default would increase the cost of all jobs.
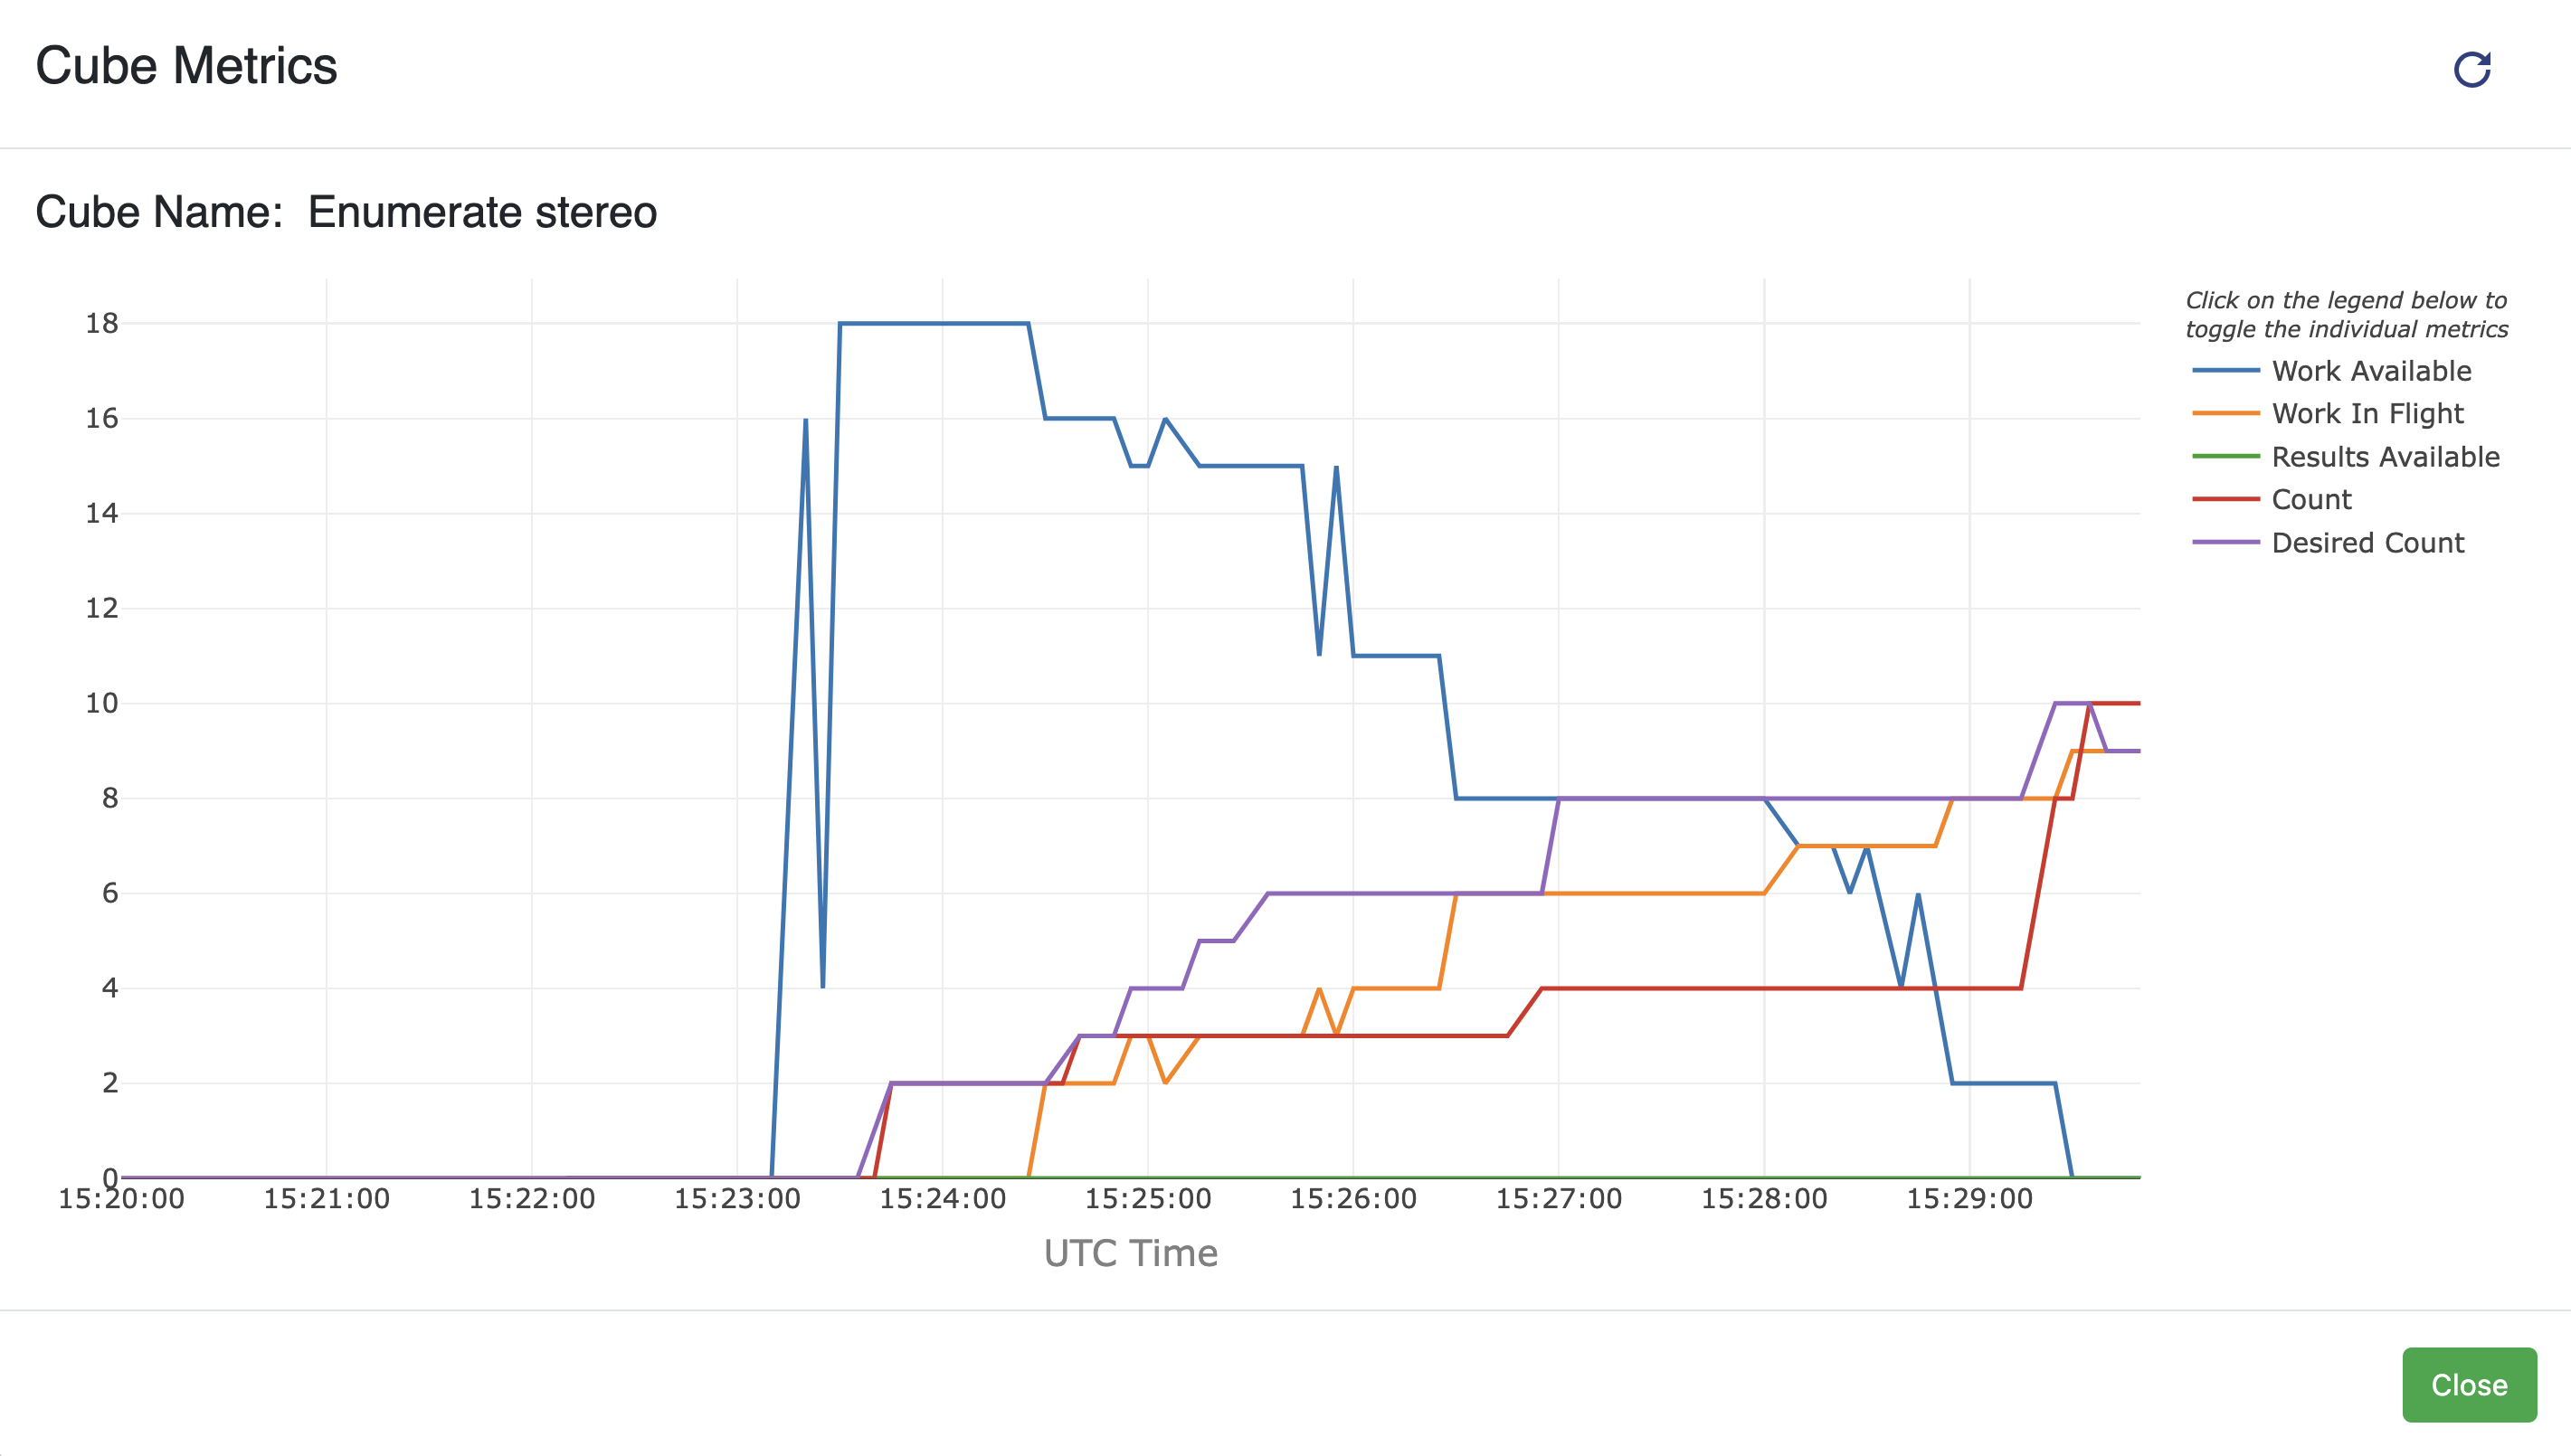
Figure 13. Cube Metrics for the cube group that includes the Enumerate Stereo Cube.
Floe Report
After a floe finishes, you will receive a notification on the navigation bar. When you launch a floe, or in your profile, you may also request to receive pop-up notification or an email when a job completes. Figure 5 shows the Details Panel for the floe. Every floe job produces a log file, which can be opened in a separate tab or downloaded. The Results section lists datasets and collections that were produced by the floe. Click the “View in Project Data” button to go to the Data page. The Report section shows the reports produced by the floe. Clicking the icon opens the Floe Report in a separate tab.
A Floe Report is generated for many floes, but not all. It provides floe-dependent information regarding the data analysis. Examples include brief explanations of why the floe failed, simulation interactions, data analysis, structures, and plots. There are three typical types of Floe Reports: Success Reports, Failure Reports, and Analysis Reports.
Success Report: This report states that the flow was successful. Many floes generate this type of Floe Report. Figure 14 shows the success report for the Spruce – Protein Preparation Floe that was used to import the biomolecule 8S7K. One design unit was prepared successfully, but it has broken chains that will need to be fixed for downstream modeling.

Figure 14. A success report for the Spruce – Protein Preparation Floe.
Failure Report: This report lists some of the most prominent issues encountered by the floe that may have caused the failure. In debugging your own floe failures, first examine the Failure Report. An example of a failure report for the OMEGA – 3D Conformer Ensemble Floe is shown in Figure 15. Only the summary of failed calculations is included in this figure for the sake of brevity.
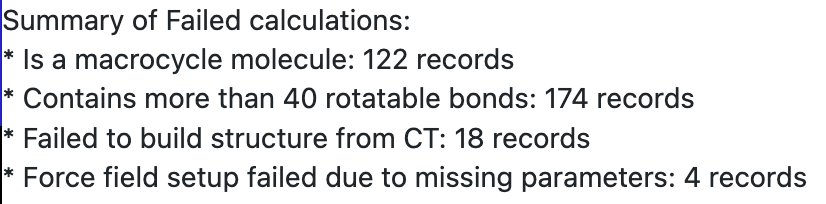
Figure 15. A failure report for the OMEGA – 3D Conformer Ensemble Floe.
Note
Not all floe failures will trigger the creation of a Failure Report. In this case, it is helpful to read the logs or read a generated debugging file.
Analysis Report: Many floes that include analysis calculations will produce this type of report. It typically contains interactive data and plots. Many STMD, 3D QSAR, and Psi4 floes produce this type of Floe Report.
The Floe Reports in Figures 14 and 15 are simple reports on only one page. Analysis Floe Reports often allow you to click on various aspects, such as molecules or fragments, or to explore additional analyses. Figure 16 shows the Floe Report for a run of the BROOD – 3D Fragment Replacement Floe.
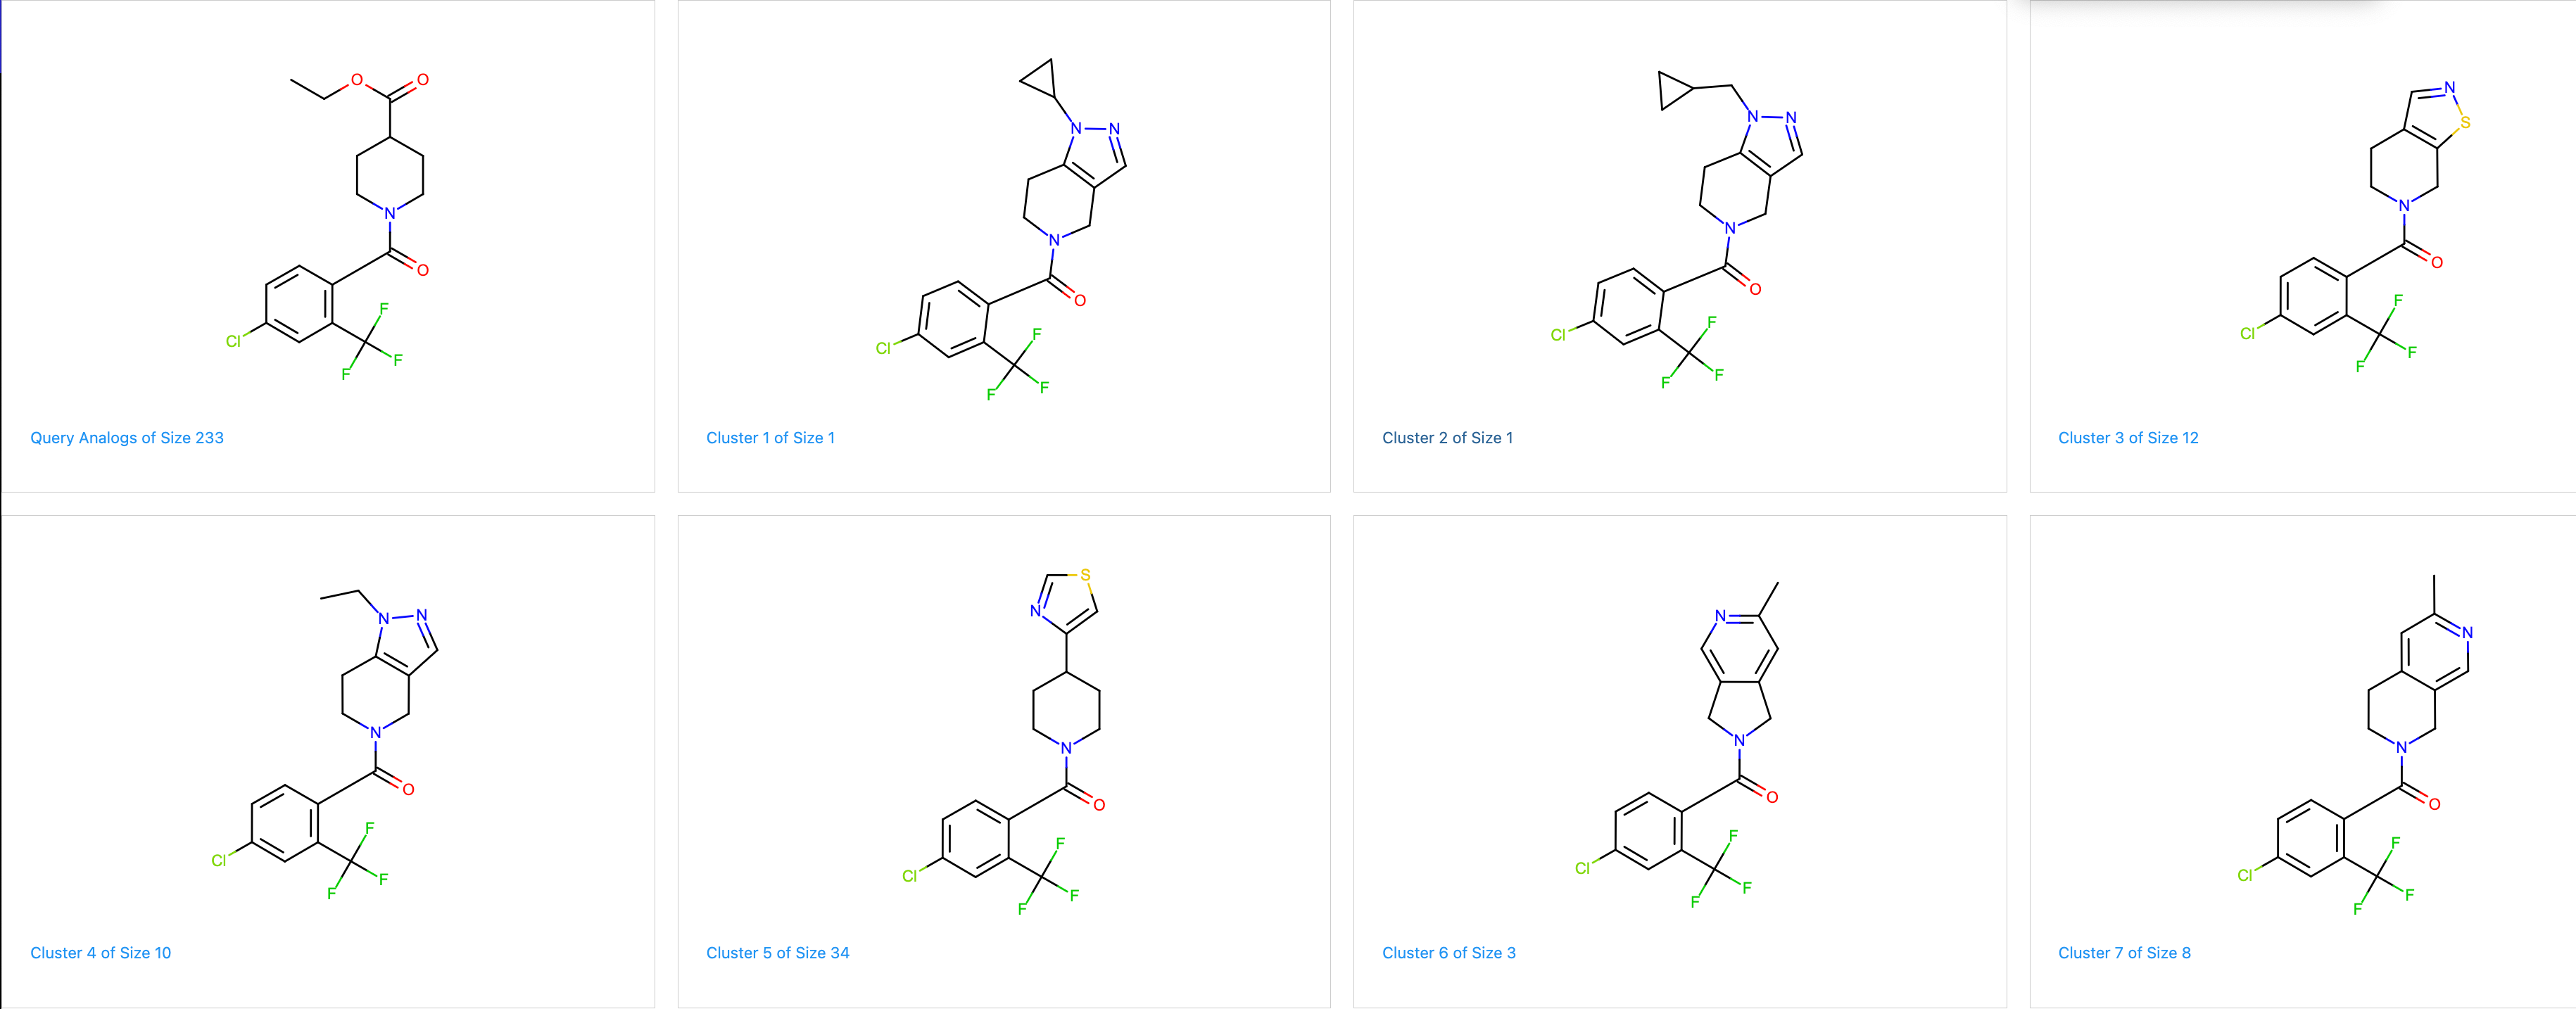
Figure 16. The first page of an analysis Floe Report for the BROOD – 3D Fragment Replacement Floe. Each molecule tile is clickable to reveal additional details.
You can click on any of these molecules to examine the query analogs or a given cluster, as shown in Figure 17.

Figure 17. A closer look at Cluster 4 of the BROOD hit list shown in Figure 16. Cluster 4 contains 10 molecules, which can again be more closely examined by clicking on the number of each molecule.
Editor Tab
Note
Use of the Floe Editor can be complicated and is not meant for novice users. For questions or assistance, please contact OpenEye Customer Support at support@eyesopen.com.
Packages Tab
Note
This tab is available only to Managed Service customers to upload custom floe packages.
All OpenEye, Cadence Molecular Sciences, packages available to your organization are listed here. You can also upload a package with custom floes that you have created, so that you can run them on Orion. Click here for information in the Programming Guide about creating a new package. For example, if you want to use a custom machine learning package, you could write custom floes and then upload those Python scripts or files as a package on the Packages Tab. You could then run those floes on Orion.
Warning
We cannot upload custom floe scripts as single scripts; the entire package must be uploaded for the floes to work.