2025.2 Release Notes
Release Highlights
A simplified analysis experience features a unified 3D & Analyze page. Users can now visualize and analyze data without moving between different pages.
Smaller molecule files can be uploaded faster using the new direct import feature. When selected, files are processed directly in the browser without the need to run an ETL Floe, resulting in immediately ready datasets. This feature is off by default. It can be turned on by selecting the “Use direct import” checkbox under the advanced options in the upload dialog box.
Admins can switch roles without changing logins.
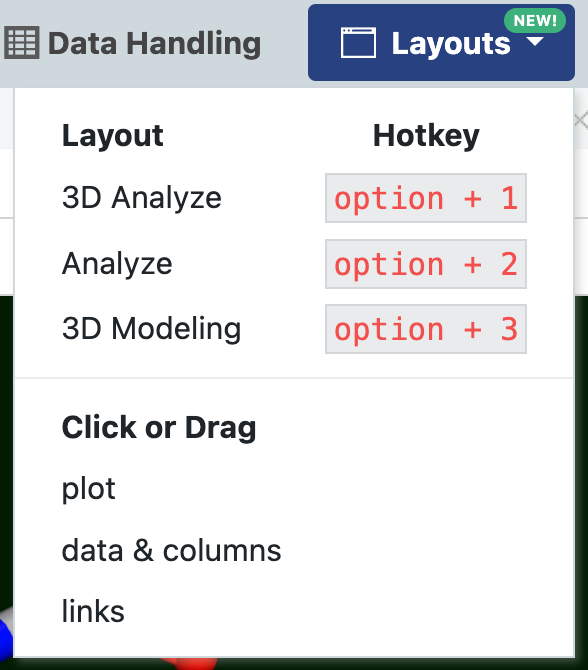
Keyboard shortcuts enable rapid switching between default layouts in the 3D & Analyze page.
Table 1. Keyboard shortcuts for toggling 3D and Analyze views.
Mac Keyboard Shortcuts |
Windows Keyboard Shortcuts |
View |
Panels |
|---|---|---|---|
Option + 1 |
Alt + 1 |
3D Analyze |
3D Viewer, Spreadsheet, Plot |
Option + 2 |
Alt + 2 |
Analyze |
Spreadsheet, Plot, Data & Columns |
Option + 3 |
Alt + 1 |
3D Modeling |
3D Viewer |

Figure 1. The Layouts drop-down showing preset options for 3D & Analyze page views. This screenshot shows the Mac shortcuts.
User Interface Notes
This release includes various improvements to performance, stability, and usability.
3D & Analyze Page
The previous 3D page and Analyze page have been combined to provide a more streamlined analysis process. The combined 3D & Analyze page has the full functionality of both individual pages.
Keyboard shortcuts allow you to switch easily between preset layouts that had been found on the individual pages.
The editing mode in the 3D Viewer can now be accessed more easily by clicking the pencil icon in the toolbar. Changes can be made faster with one-click editing.
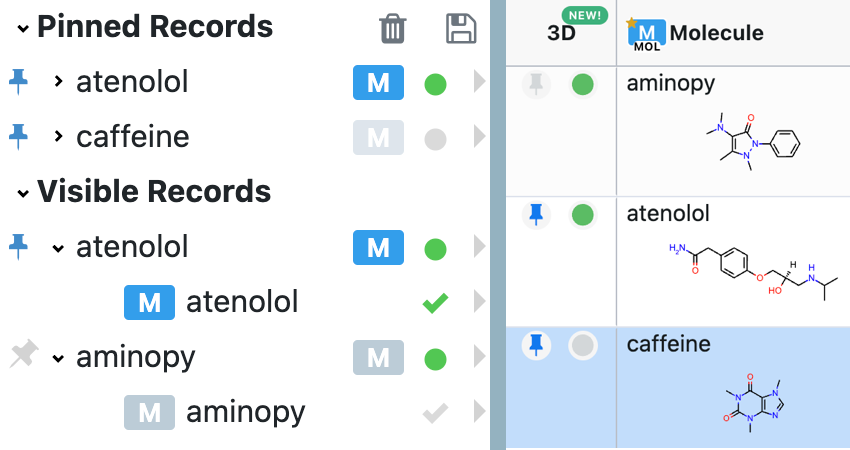
The green dot controls visibility of a record in the 3D Viewer. Objects in the record that have a green check will be shown. The green check is hierarchical, so every parent object must also be checked.
The pin on records in the 3D Viewer list and the spreadsheet populates the “Pinned Records” lists in the 3D list. This allows you to save a separate dataset from the 3D Viewer list.

Figure 2. The icons used to control visibility and pins in the 3D Viewer. Pins and green dots appear in both the molecule records (on the left) and the spreadsheet (on the right). The green dots indicate visibility of a record (atenolol and aminopy). The checkmark must also be activated (green) for the molecule to appear in the Viewer window (atenolol). Pinned records are always listed in the Pinned Records data tree, even if not selected (caffeine). More information can be found in the 3D & Analyze page documentation.
User Roles
Admins can now switch roles within the Profile page without changing logins.
Orion Back End Notes
Note
With the 2025.1 release, Orion back end and other Orion changes of interest to all users are listed in this section, in this manual. Orion Platform changes of interest to Python programmers are summarized in the Orion Programming Guide.
Information for Programmers
Note
As of 2025.1, the Programming Guide covers only Orion Platform.
Managed Service customers can use the Orion Platform interfaces to develop their own cubes and floes for execution in Orion. They can use the Orion Command-Line Interface (OCLI) to execute operations using the Orion Client facilities. They can also develop and manage Molecule Search databases. For more information, see the Programming Guide.