Molecule Search Page
The Molecule Search page provides the ability to search using similarity in two or three dimensions; with substructures; using matches with search terms; and by molecule title.
For Orion users, Molecule Search supersedes functionality that was previously provided by the OpenEye MaaS and FastROCS web services.
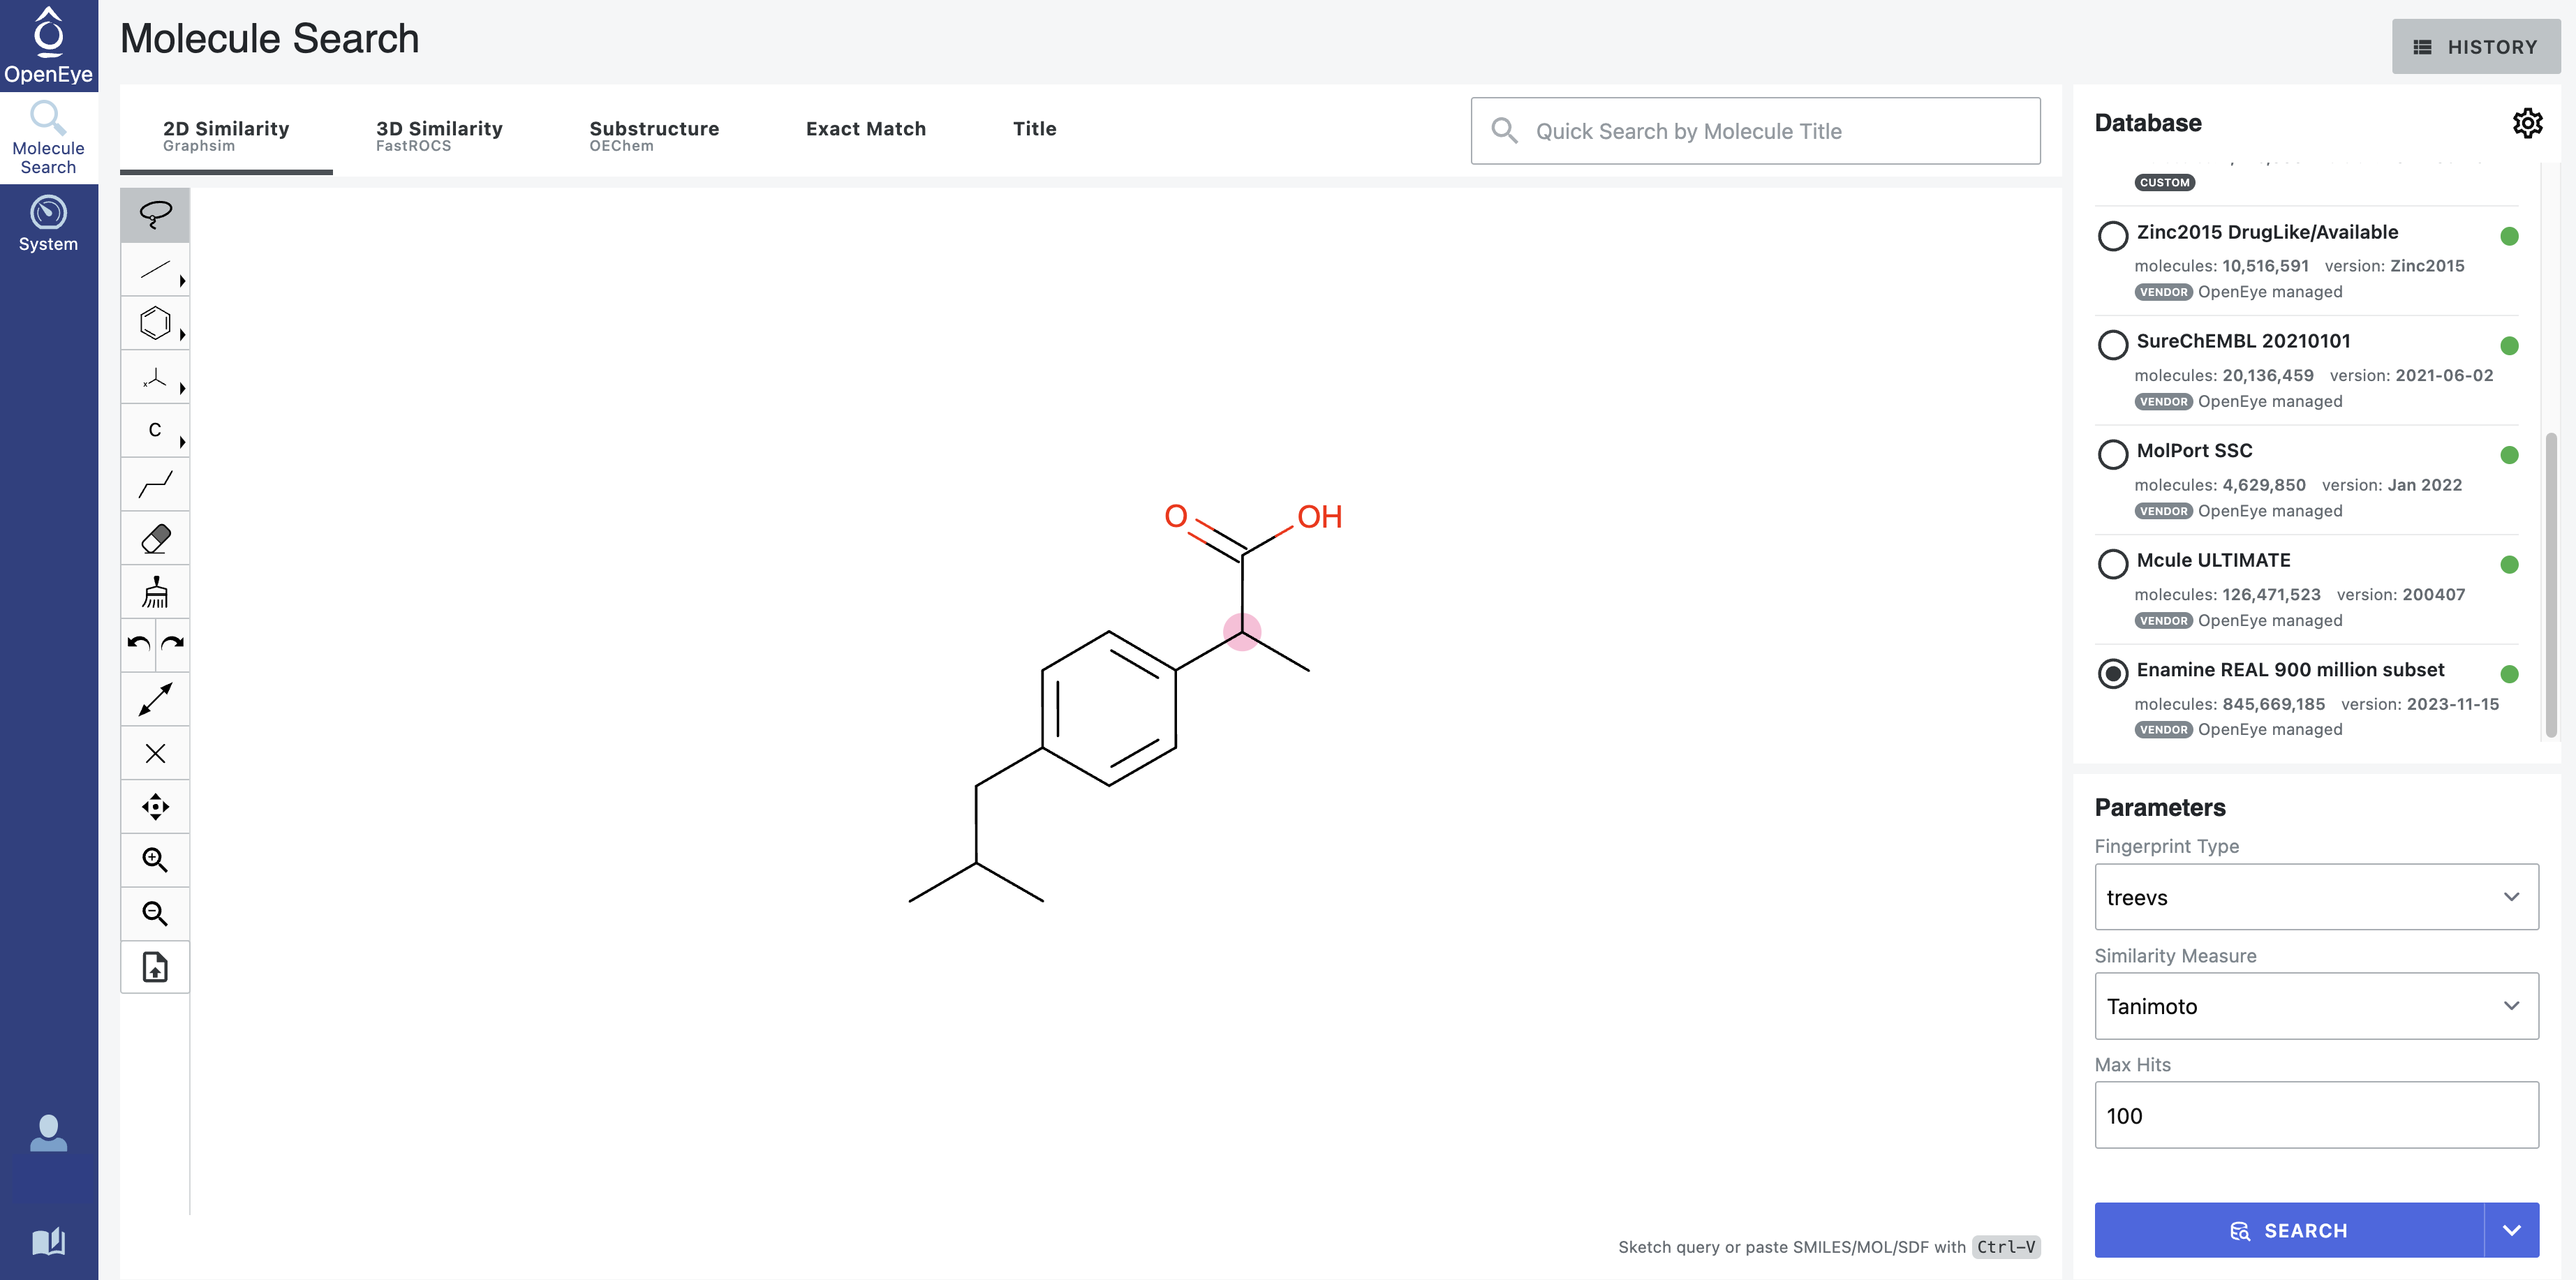
Figure 1. The Molecule Search page.
For a basic demonstration of the Molecule Search capability, please see the following video.

Note
Molecule search databases, hosted by OpenEye, are provided at no additional cost to customers and users. Additionally, searches of those databases will incur no cost to customers or users.
How to Add a Query Molecule
There are several ways to add a query for search. You can sketch a molecule; paste a query using a SMILES, MOL, or SDF file; upload a query from your computer; or search by title.
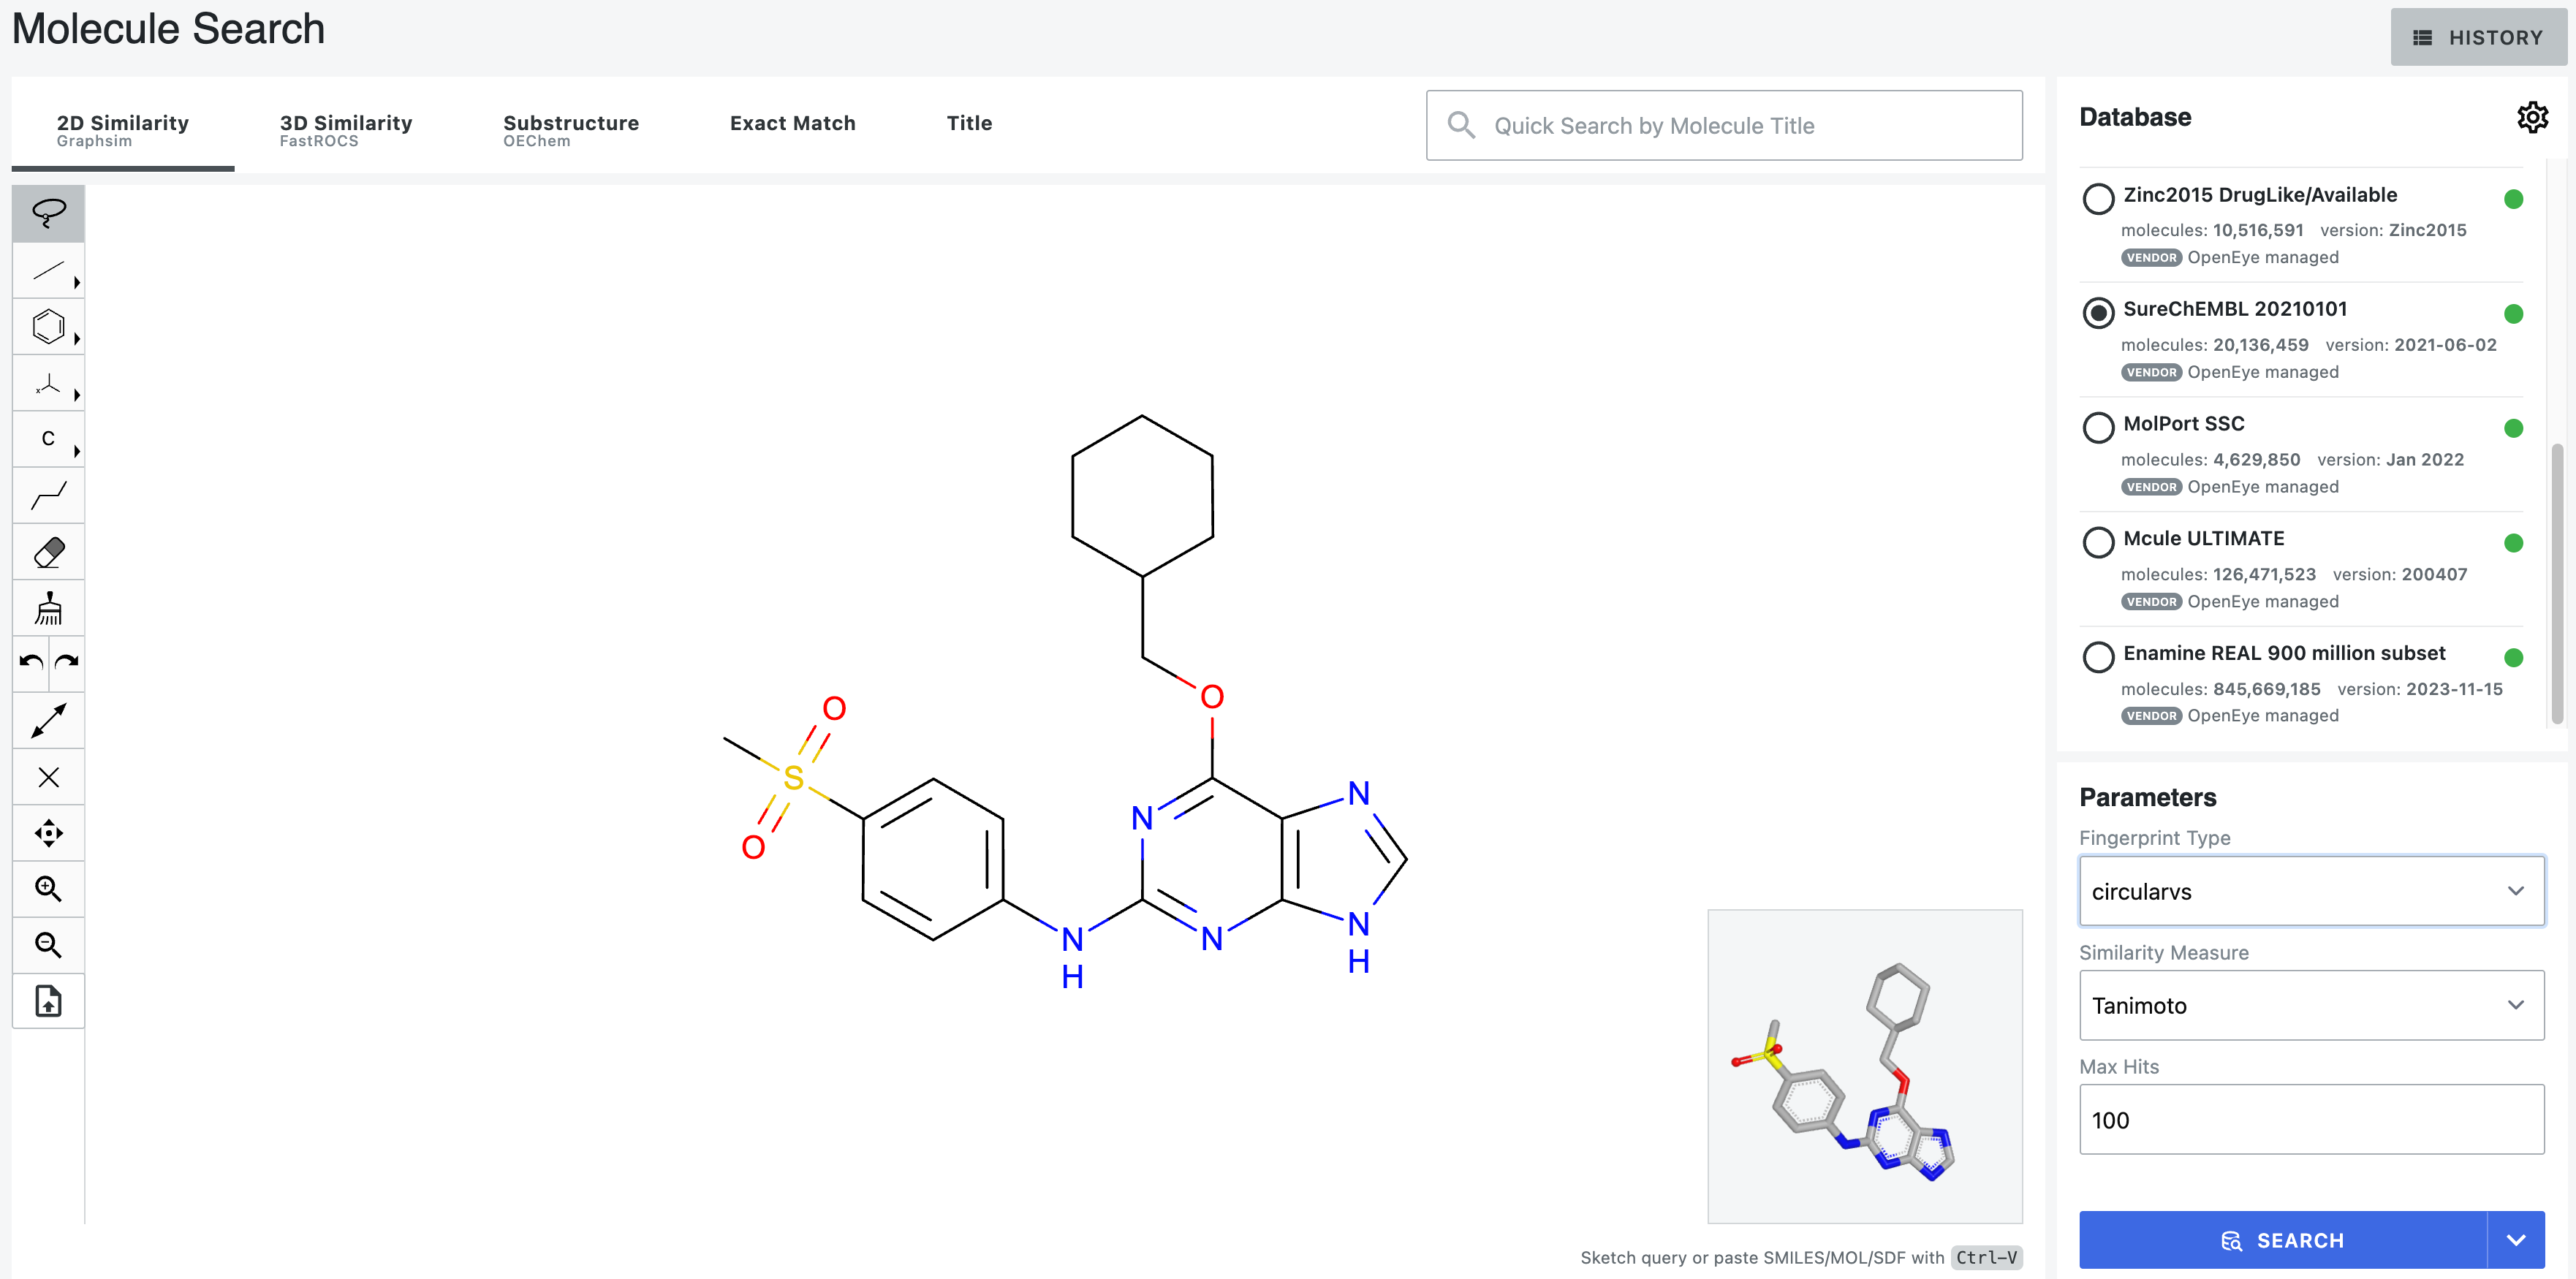
Figure 2. An uploaded query includes an inset showing the 3D depiction of the molecule. The 3D structure can be manipulated with the mouse and changes accordingly with edits to the structure.
Orion users can also send a molecule from the spreadsheet on the 3D & Analyze page by selecting the molecule, right-clicking, and choosing “Send to Molecule Search.”
Add a Query Using the Sketcher
The Sketcher allows you to sketch a molecule using the tools in the left-hand toolbar. The primary tools are defined in Table 1. The Sketcher is available on the Molecule Search page, on the Data page (choose Sketch under the “Add Data” button), and as an input option for certain floes (such as the Generative Structure - Site Selection Floe).
Table 1. Primary tools shown in the Sketcher.
Symbol |
Tool |
Application |
|---|---|---|
Bonds |
Bond options |
|
Rings |
Ring options |
|
Templates |
Functional groups, protecting groups, rings, amino acids, chains, or
user-defined templates
|
|
Atoms |
Common atoms, generic R groups, and less common elements (via periodic table) |
|
Chain |
Create a chain of desired length |
|
Delete |
Delete part of a structure |
|
Clean up molecule geometry |
Show the structure with proper geometry |
|
Clear structure |
Delete entire structure |
|
Pan |
Move structure within Sketcher window |
|
Upload query |
Upload a query |
The Sketcher tools have several levels. Most are accessed directly from the toolbar or from drop-down menus under certain building tools. In the toolbar for these tools, click on the caret to reveal the options. You can hover over these additional choices for identification of the tool. More tools can be accessed with a right-click on an atom in the Sketcher window.
The Bonds tool allows you to choose the type of bond. The wavy bond indicates undefined R/S stereochemistry, and the double either bond indicates unspecified E/Z double bond stereochemistry.
Under the Templates tool, you can select from a variety of predefined functional groups, protecting groups, rings, amino acids, and chains. User-defined templates can also be constructed. To do this, build the desired molecular structure in the 2D Sketcher and select the plus sign under ‘My Templates.’ Name the template in the pop-up screen. It will now appear as a choice in ‘My Templates.’ To delete a template, click the red X in the upper corner of its selection box.
The Atoms tool allows you to add common atoms, generic R groups, and less common elements (via a periodic table).
When sketching a molecule, an atom center will turn red if it has more than the allowed number of bonds. A pink dot on an atom indicates that it is a stereocenter.
The entire molecule or part of a molecule may be copied for use outside of Molecule Search. For a portion of the molecule, first highlight the desired part. The selection can be copied as a SMILES or MOL file by right-clicking within the selection box (do not directly click an atom), clicking the “Copy” box, and selecting SMILES or MOL. Alternatively, to copy an entire molecule, right-click anywhere in the Sketcher window or simply on a bond, then click the “Copy” box and select MOL or SMILES. The SMILES or MOL file for the selected portion will be in your computer’s clipboard, ready to be pasted and used elsewhere. Right-clicking on an atom in a structure gives two options: elements and R-groups.
The following video shows some useful Sketcher shortcuts.

The 3D panel in the Sketcher offers the ability to designate atoms, bonds, rings, and other structural components for search.
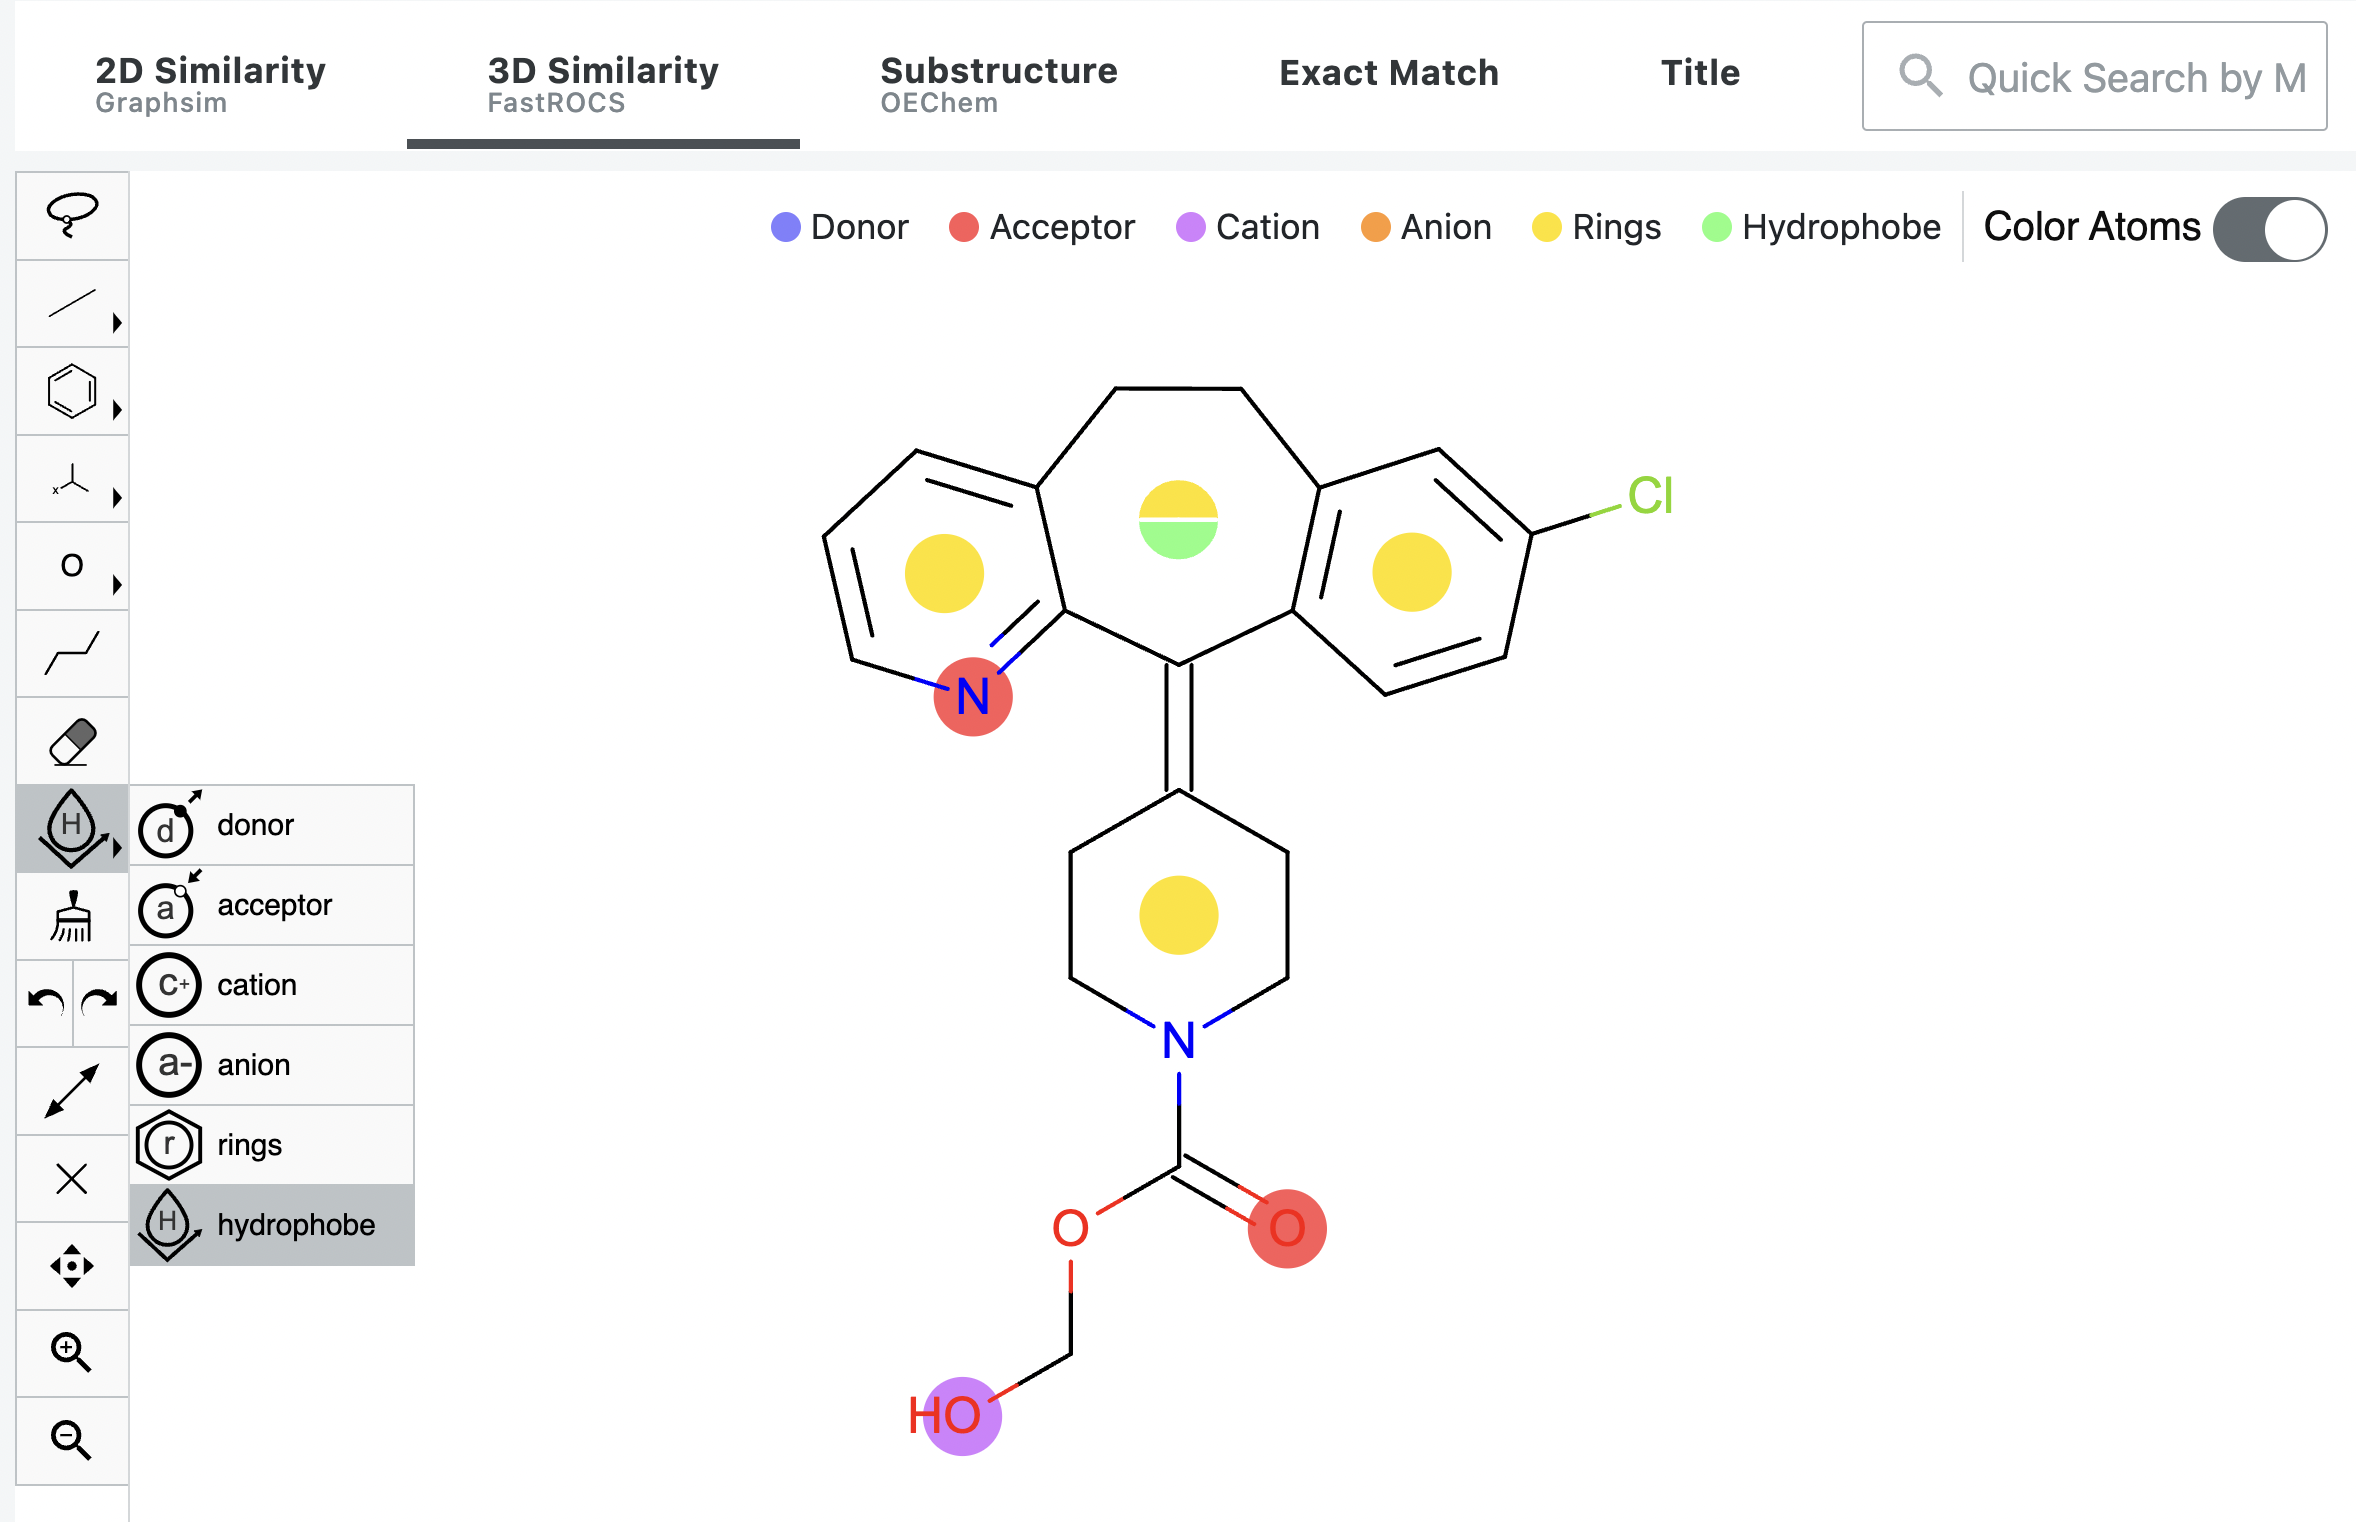
Color atoms refer to the chemical features of a molecule and describe another aspect of 3D similarity. Please see the
Shape and Color section below. The “Color Atoms” toggle reveals a color-coded guide for the features
in the current structure. You can also assign additional features. When the toggle is On, a new tool appears in the toolbar
to allow the placement of color atoms on the shape atoms shown in the Sketcher. Figure 3. Color Atoms Tool on the 3D Sketcher. The red and yellow dots were added automatically. The green and the purple
dots were added using the toolbar options. The green and yellow split dot was achieved by choosing hydrophobe and
shift-clicking all of the atoms on the ring to split the default yellow dot into green and yellow. Click on the caret to access the available features, choose the one that you want, and click where you want that feature
to appear in your search. To place the color atom, either left-click on the “parent” shape atom you want to describe with
the color feature, or shift-click on multiple shape atoms to give the color atoms the average position of the parent shape
atoms. If multiple color atoms are desired for the same space atoms, change the color atom feature on the toolbar and
click on the color atom to “split” the color atom into different color options to refine for similarity. Note Splitting the color atoms does not affect the weighting for the preferred chemical features; all chemical features
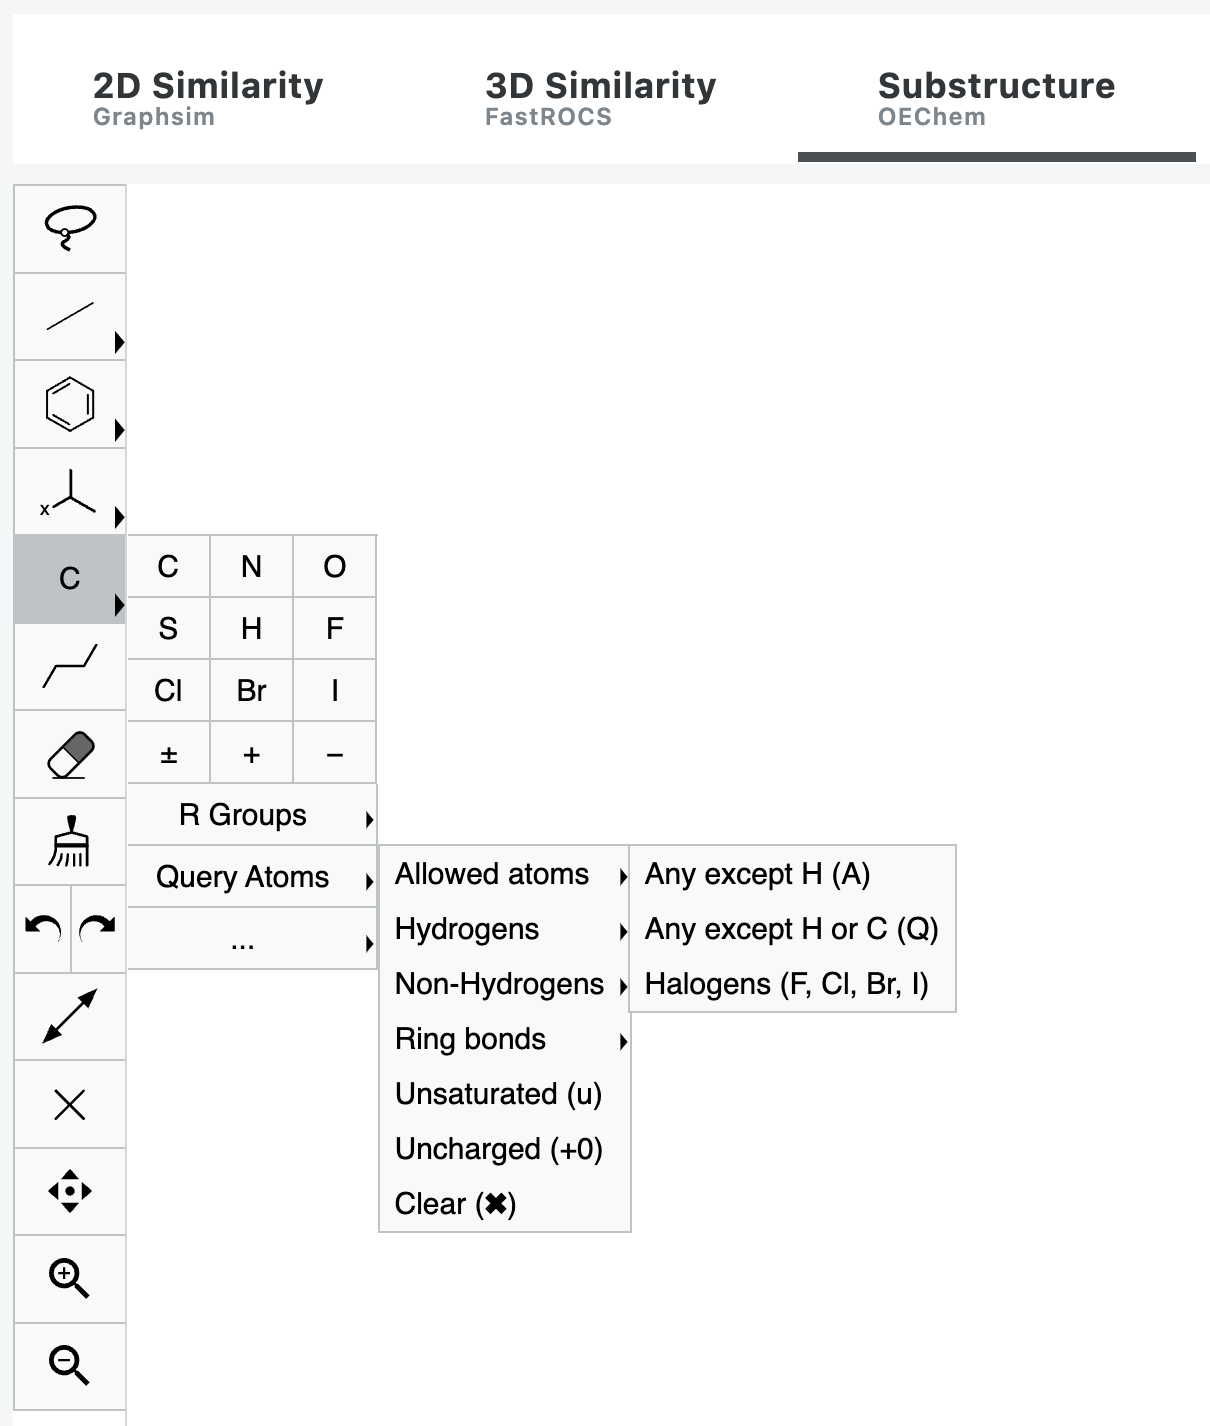
included for that color atom will be weighted the same for similarity. When performing a substructure search, additional options are available under both the Bonds and Atoms tools, named Query
Bonds and Query Atoms, respectively. Using this selection, specific types of bonds or atoms are queried to narrow down
potential structures. The Query Bond categories include Aromatic, Single or Double, Single or Aromatic, Double or Aromatic,
Any Type, Keep Stereochemistry as drawn, Ring Bond Only, or Chain Bond Only. The Query Atom categories include Allowed
Atoms, Hydrogens, Non-Hydrogens, Ring Bonds, Unsaturated, and Uncharged. Figure 4. In a substructure search, the Atoms tool includes a Query Atoms menu with additional options
such as Allowed Atoms. This feature offers the ability to search with more specific criteria.Color Tool for 3D Search
Additional Sketcher Tools for Substructure Search
Search Context
Molecule Search includes aspects of fingerprints, similarity measurements, and the OpenEye concepts of shape and color. While these may be quite familiar, a brief introduction is provided for those who are new to these ideas.
Fingerprints
Molecular fingerprints are cheminformatics tools for virtual screening that are frequently used for similarity comparisons. Fingerprints capture and encode structural features, representing the presence or absence of various substructures or molecular characteristics. For more details about OpenEye fingerprints, see the theory chapter of GraphSim TK.
Note
Performance and accuracy for fingerprints of macrocycles has not been performed and is not optimized.
Molecule Search uses three different methods to define fingerprints: circular, path, and tree. Figures 5, 6, and 7 show how these fingerprints are defined.
Circular fingerprints enumerate the circular fragments of each heavy atom of the molecule up to a given radius. They find substructures of molecules by determining the connectivity of atoms.
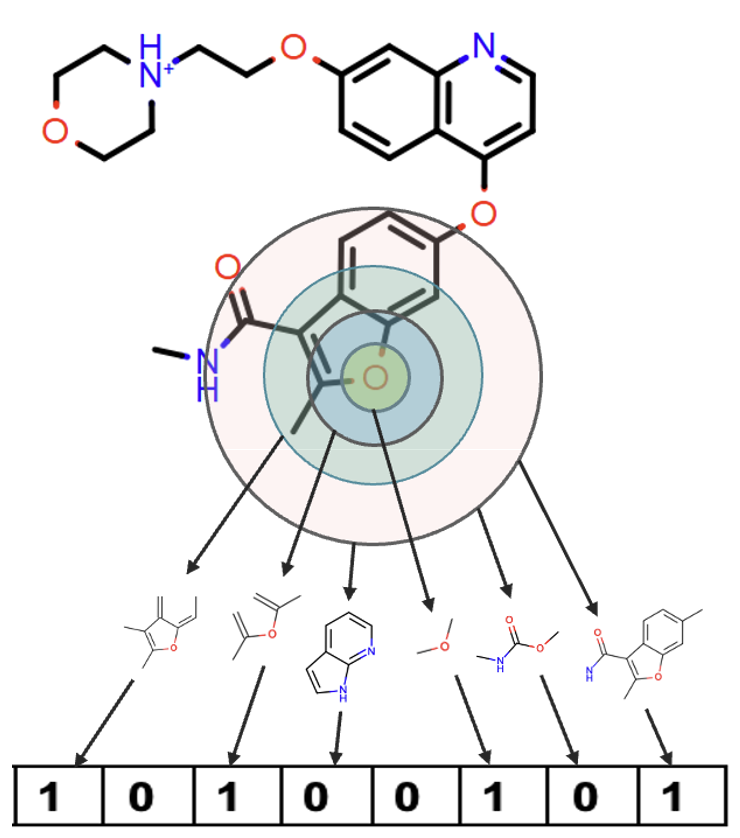
Figure 5. How to construct circular fingerprints. All “1” values correspond to fragments that appear in a particular ring. The “0” fragments are not present.
Path fingerprints enumerate all linear fragments of the molecule.
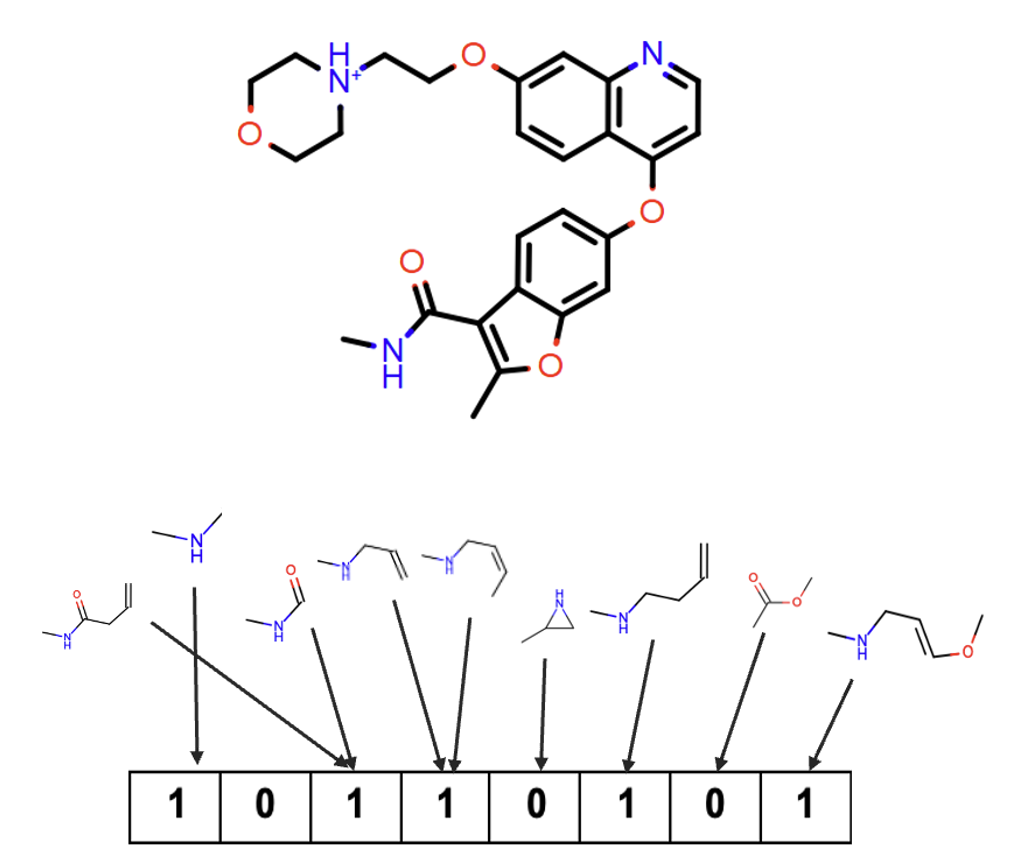
Figure 6. How to construct path fingerprints.
Lastly, tree fingerprints enumerate branching fragments of a molecule and encode molecular elements not captured by the other methods.
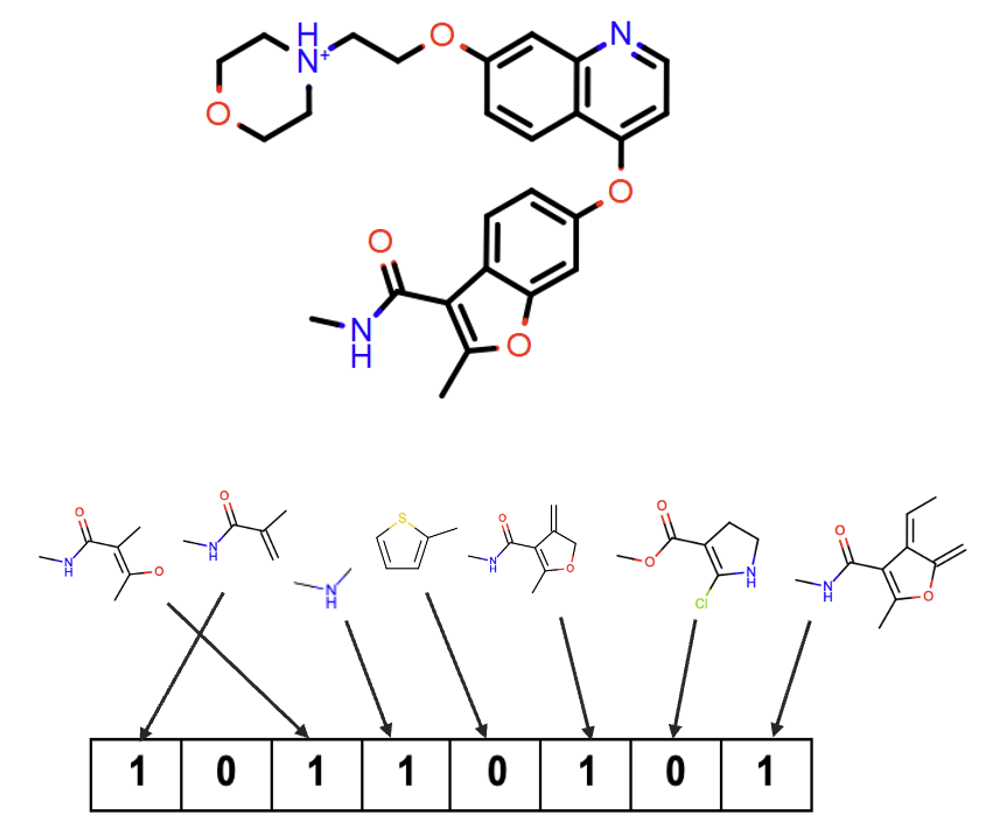
Figure 7. How to construct tree fingerprints.
Path and tree fingerprints can miss the connectivity of the atoms, but path fingerprints provide a large number of more diverse results. We recommend tree or circular fingerprints for highly branched molecules.
Similarity
Similarity is defined by the comparison of specific molecular features (fingerprints). Molecules can be aligned in 2D or 3D to assess similarities in spatial conformations. Similarity also examines the relationship between a query’s molecular structure and biological behavior for the prediction of hits. A discussion of similarity comparison based on fingerprints can be found in the Python Cookbook and visualized in GraphSim TK.
OpenEye uses several methods for similarity measurements. The Tanimoto coefficient addresses the question of how similar the query and database molecules are to each other. It measures the overlap of structural features.
The Tversky measurement is similar, but it quantifies similarity based on shared substructures and molecular features. The reference Tversky asks how similar the database molecules are to the query molecule. The Tversky coefficient is used for ROCS measurements.
Shape and Color
OpenEye, Cadence Molecular Sciences uses shape and color to compare the volume and chemical features of the query molecule to the database molecules for 3D similarity.
Shape refers to OpenEye’s definition of volume as a scalar field, where volume is considered to have different values at different points in space. Shape atoms define similarity by the physical position and relative reference of the atoms to one another. Thus, the more the volumes of the query molecule and the database molecule correspond, the more similar their shapes will be. For example, a shape-exclusive search on the six carbon atoms in a benzene ring shows high similarity to a hexane ring due to similar relative positions of the atoms. Atom groups with similar hybridization and 3D positioning also have high similarity.
Color atoms define another aspect of molecular 3D similarity: chemical features. The following chemical features are currently supported in Molecule Search: donor, acceptor, anion, cation, hydrophobe, and rings. These features refine the search to find database molecules with similar chemical features at the defined position of the shape atom(s). Because chemical features are relative to volume, color atoms are relative to the shape atoms.
If a search is conducted with the “Color Atom” toggle turned Off, 3D search will use the default color atoms for the query molecule. When the “Color Atom” toggle is turned On, the Sketcher automatically defines the color atoms for the query molecule, but the color atoms can be changed to explore different chemical features of the database molecules. Changing the color atoms only affects chemical features, not the volume defined by the shape atoms. For example, methane (CH4) is a tetrahedral, neutral molecule. Ammonium (NH4+) is a tetrahedral ion. If a cation color atom is placed on a query carbon atom of methane, then ammonium will be similar to the query based on shape and color.
Note
Custom color force fields are not supported within Molecule Search.
Types of Search
2D Similarity Search
The 2D similarity search performs a molecule search with a 2D representation of a molecule and provides only 2D molecules
as a result. In preparing for a 2D search, there are three parameters for molecular fingerprint similarity: fingerprint
type, similarity measure, and maximum hits. Depending on the database, each fingerprint type may include a virtual screen (VS)
option as well; for example, circularvs is the virtual screening option of circular fingerprints. The VS option increases
the speed of the search by excluding the values formal charge and hybridization (defined
in the OEFPAtomType namespace) from the
definition of the fingerprint.
Some 2D databases do not have every fingerprint type available in order to increase the efficiency and speed of searching these extremely large databases.
3D Similarity Search
A 3D similarity search automatically compares molecules based on their combined shape Tanimoto and color Tanimoto scores, called the Tanimoto Combo. The shape Tanimoto and color Tanimoto each range from 0.0 to 1.0, so the maximum Tanimoto Combo is 2.0. In the results, you can subsequently see, and rank by, the shape Tanimoto or color Tanimoto scores. Shape is considered to be the volume of a molecule: the more similar the volumes, the more similar the shapes. Color is defined by the chemical properties of the fragments.
When using the Sketcher for 3D search, 2D sketches are converted into 3D molecules using the OpenEye Omega TK to generate a single 3D conformation.
To use the color editing feature, turn On the “Color Atoms” toggle and edit color atoms as desired. Color editing does not need to be on to generate color Tanimoto scores, as color atoms will be added automatically to the query molecule.
Substructure Search
A substructure search attempts to match smaller substructures present in the larger query molecule to similar functional groups in the database molecules.
Three search
constraints defined in the OEMDLQueryOpts constant namespace
are available for the substructure search: MatchAtomStereo, AddBondAliphaticConstraint, and
AddBondTopologyConstraint. By default, atom stereo information is not considered. The MatchAtomStereo option
forces the query molecules to match the specified atom configuration. The AddBondAliphaticConstraint only allows
aliphatic query bonds to be mapped to aliphatic bonds in the database molecules. The AddBondTopologyConstraint forces
chain bonds to be mapped only to chain bonds.
This search method employs MDL queries, which are used to quickly and efficiently perform a substructure search.
Exact Match Search
Exact match search offers the ability to either restrict or maintain the stereochemistry, bonding, or hybridization of a structure when performing a search.
Four parameters are available for defining an “exact” structure for similarity: Match Stereo, Match without Stereo, Isomorphic Match, and Match Uncolored Graph. Match Stereo and Match without Stereo determine whether any defined stereocenters must be matched. In (S)-chloro(phenyl)methanol, for example, the stereocenter may or may not need to be kept as part of the search.
Loosening the criteria for “exactness,” Isomorphic Match clears all elemental information from the molecule, but maintains the bonding and hybridization of the molecule. For example, pyrazine and benzene would appear to be the same with Isomorphic Match because the bonding and hybridization are the same for both molecules.
Lastly, Match Uncolored Graph strips the molecule of all information (including bonding/hybridization) except for the connectivity between the atoms; you have only generic atoms connected in a particular order. For the benzene example, the search needs only to find 6 atoms (of any element and unspecified hybridization) in a ring.
Title Search
A title search will populate the Sketcher with any structure in the selected database that matches the exact input query name. If you have a list of chemical names, this tool provides a quick way to put known molecules into Orion; this is an especially helpful way to easily add molecules with company-specific IDs from corporate databases. Please refer to the Save Results section to learn how to work further with the output from Molecule Search.
Note
If any names are misspelled, the molecule will not be found, but the misspelled name will show up in the list of titles searched.
Setting up a Search
To perform a molecule search, first determine which type of search you want to do. Add the molecule of interest, either by sketching a molecule, typing its name into the search bar, or pasting a SMILES, MOL, or SDF file into the Sketcher.
Next, choose the database collection you want to use. The next section discusses options for database selection and curation. On the right side of each database is a color-coded circle to indicate the status of the database. A green circle means that the database collection is loaded and ready to be used in the search. There are three color statuses that indicate that the database collection is not available to be searched. A light-grey circle indicates that the database collection is unloaded and therefore not currently loaded to an instance. An orange circle means that the database collection is waiting to be loaded and queued. Lastly, a red circle indicates an “other” status. For this status, contact your OpenEye administrator or OpenEye support for aid in troubleshooting this database collection.
Select any parameters that are available for your desired search type and database. Then click the “Search” button. After submitting a search query, there are four statuses that will appear next to the query molecule in the top left of the results page: “queued” in grey, “processing” in orange, “error” in red, and “success” in green.
Database Options
To see all databases, click on the “Settings” icon at the top of the Database list, or go to the System page from the blue navigation bar and click on the Databases Tab. For managed service customers, OpenEye-curated databases and collections can also be found in the Organization Data / OpenEye Data folder on the Data page.
Vendor Databases
OpenEye, Cadence Molecular Sciences curates and prepares multiple databases for search purposes. Molecule search collections, hosted by OpenEye, are specifically geared for molecule search. They are provided automatically to customers and users and searching these databases incurs no cost. Available databases for each search type appear on the right side of the Molecule Search Sketcher. Databases can also be located on the System page.
Note
External database collections hosted by OpenEye, Cadence Molecular Sciences are updated periodically and may not be aligned with Orion UI or Floes releases. All databases include either the vendor version number or the date of the latest update with the database name and size. For a list of updated Molecule Search databases, please see the database collections information here, where there is also information about our database curation policy.
Custom Databases
Custom databases can be added to Molecule Search by admins and modelers. These databases are created from prepared molecule search collections. To begin this process from a collection, go to the Databases tab on the System page. Under Custom Databases, click on the “Create Database” tile. The pop-up window directs you to a page where you can select a collection from your existing files. The collections are then converted to databases that are available for search.
To prepare a custom collection, the molecule search preparation floes can be used to provide a convenient, end-to-end automated workflow. The Automated Preparation for Molecule Search Databases Floe supports these common molecule file formats as input: .smi, .ism, .cxsmiles, .csv, or .sdf format. This How-to Guide describes how to run these floes.
When the custom database is available, it will show up as a tile under Custom Databases and can be loaded or unloaded here. It will appear in the database list on the right side of the Sketcher. The circle next to the name of the database collection indicates its status.
The Custom Databases for Molecule Search section includes additional details about this process.
Note
For assistance in creating a custom database, SaaS and Standalone Search admins should first contact OpenEye Customer Support at support@eyesopen.com.
Note
SaaS admins and Standalone Search admins can create and load custom databases for search. They can share these databases with all members of their organization through the UI, but this is read-only access; it does not grant non-admin users the ability to load, unload, or delete databases. SaaS modelers may also create and load their own databases, but they may not share them with their organizations. For learn more about sharing permissions, see this information.
Managed Service stack admins and modelers can also use OCLI to create and load custom databases using OCLI, as well as to grant sharing permissions for other users to read, load, unload, or delete databases.
Search Results
A search brings you to a separate results page. On the left, there is a panel showing the query molecule and details about the search. On the right, the structures of the hits found in the search are depicted, each in their own tile box.
Note
A search that is designated as a success may return no results. This may indicate that no molecules similar to the query were found with the designated parameters in that particular database. Consider changing the parameters or using another database for your search.
2D Similarity Search Results
The found structures are listed by their Tanimoto score. Atoms in the 2D and 3D depictions of search results follow this coloring scheme to ease quick comparisons between the results.
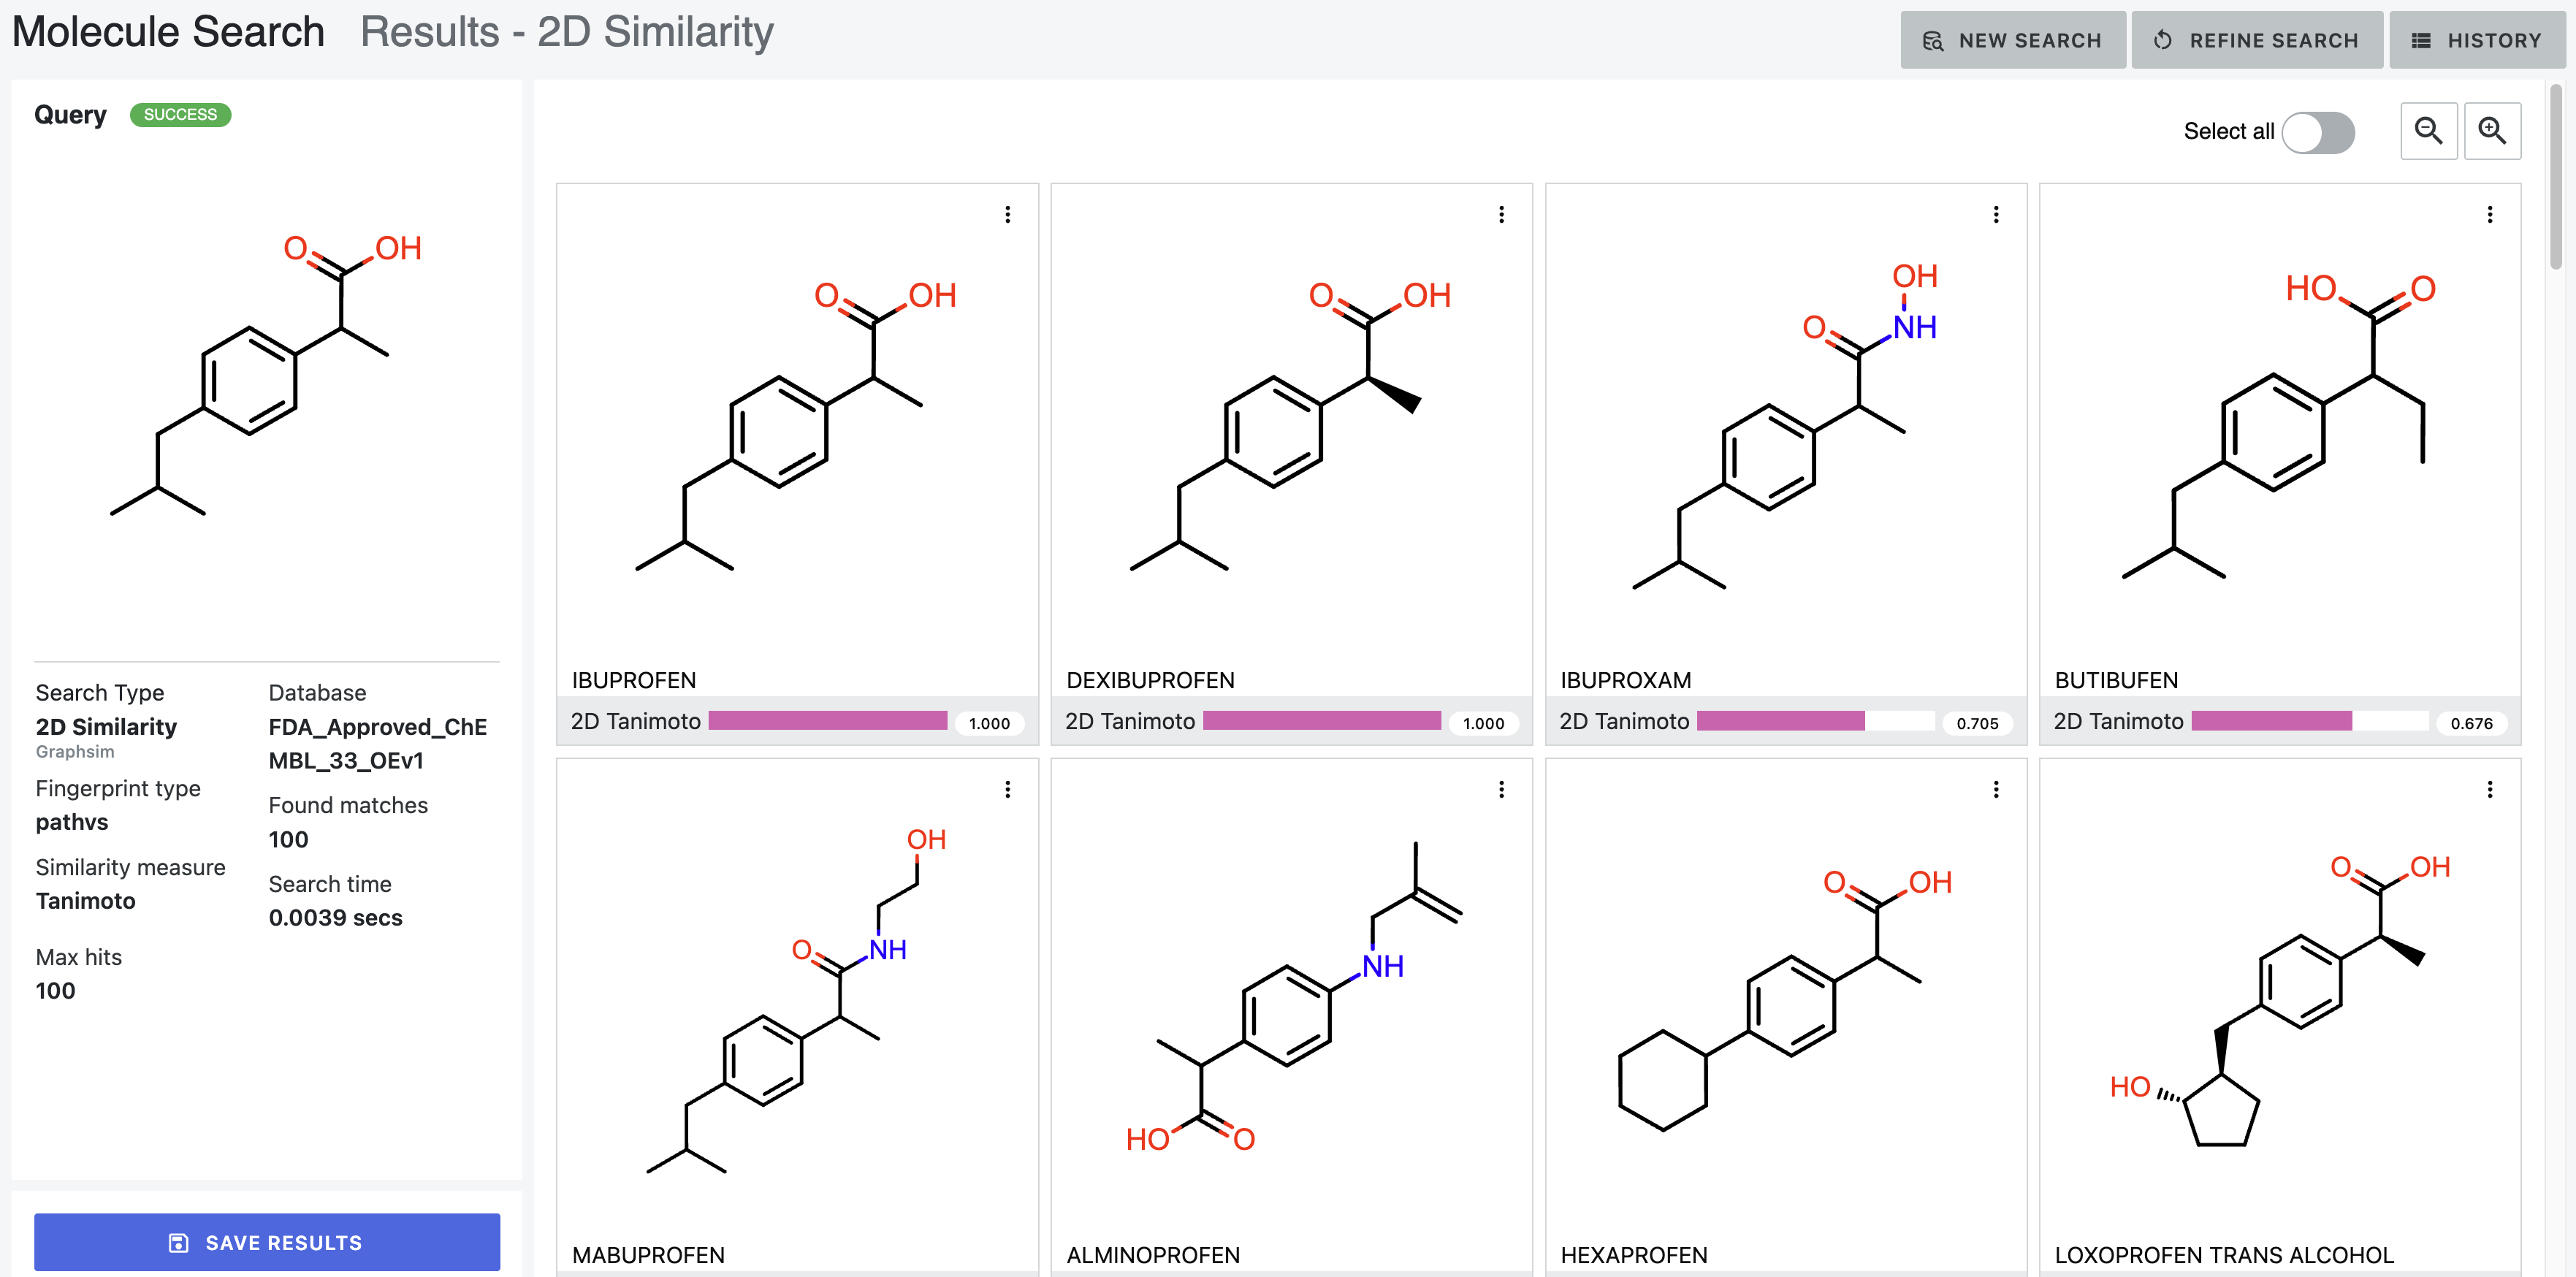
Figure 8. Results for a 2D similarity search.
3D Similarity Search Results
For a 3D similarity search, the search results list 2D scores and rank the 3D Tanimoto score by either combo, shape, or color. These options offer different methods of comparing the database molecules to the query molecule. The 3D results also show a graph of the 3D combo versus the 2D score. Additionally, the view can be changed to either 3D, 2D similarity, shape, or color visual depictions. To learn more about these depictions, see the chapter on the ROCSReport utility program.
Note
For performance reasons, searches of more than 500 hits will not return Grapheme depictions that show the 2D similarity, shape, and color results. Only 2D and 3D depictions will appear.
Figures 9 through 14 are from the same 3D similarity search of ibuprofen.
The 2D depiction simply shows the 2D representation of the molecule.
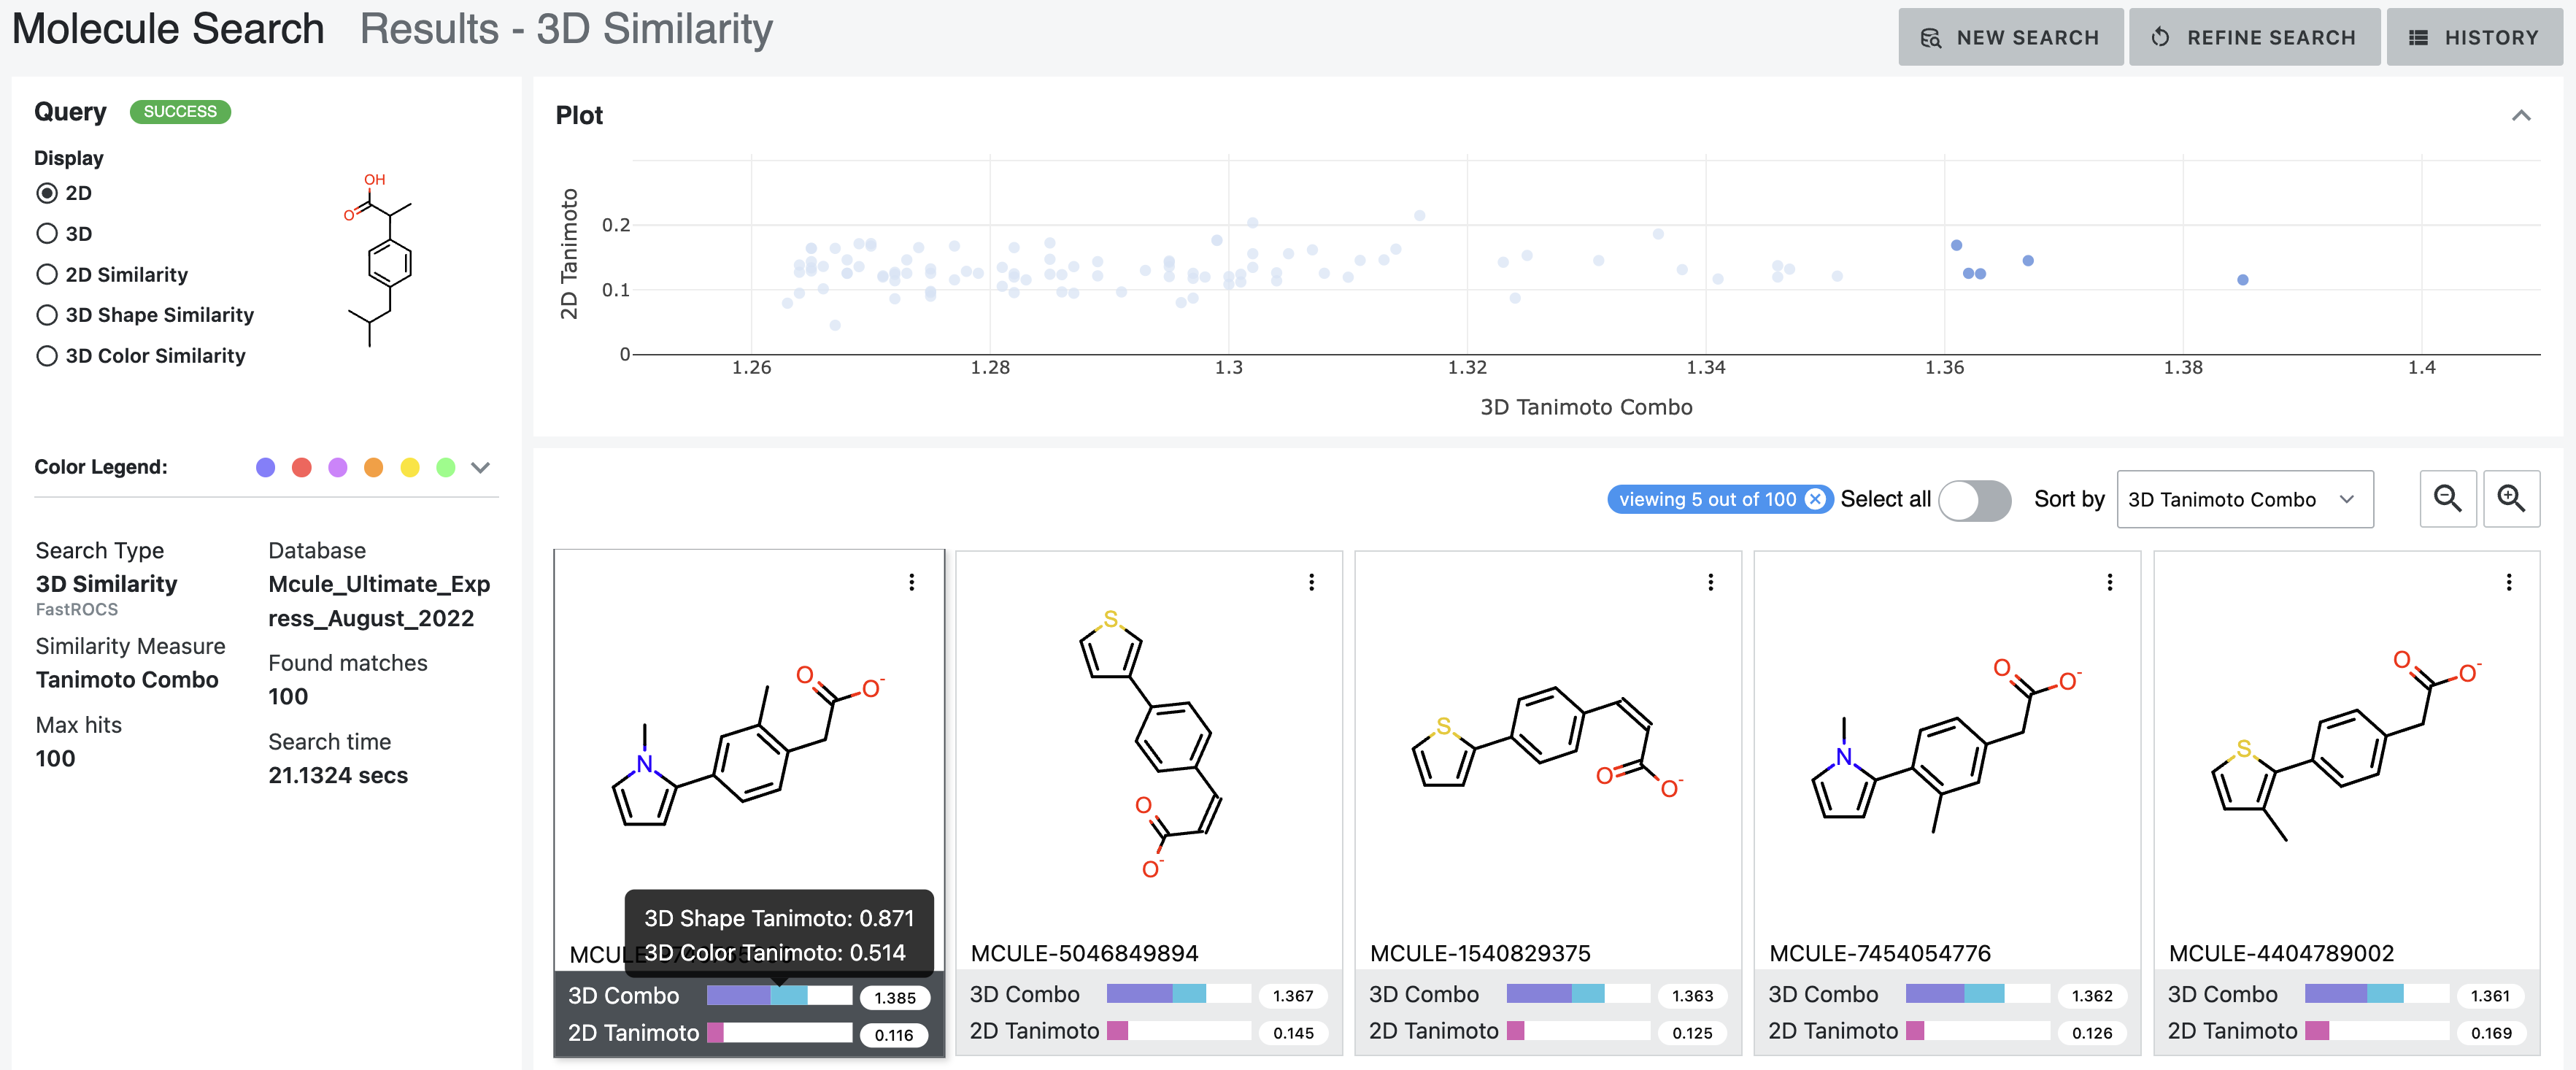
Figure 9. 2D depictions of the results from a 3D similarity search of ibuprofen. In this example, the hits with the highest Tanimoto combo scores have been selected. Individual hits can be selected on the graph by clicking on a single point or by using the mouse to draw a box around several points of interest. Hovering over the 3D bar shows the breakdown of the Tanimoto combo score to Color and Shape Tanimoto scores.
The 3D depiction shows an overlay of the query molecule in grey with the database molecule in green. The overlaid structures can be manipulated with the mouse for better viewing. Molecules in individual result windows can be rescaled using the scroll wheel of your mouse. The orientation of the query molecule on the left may not correlate to the orientation of the database molecules in the results section.
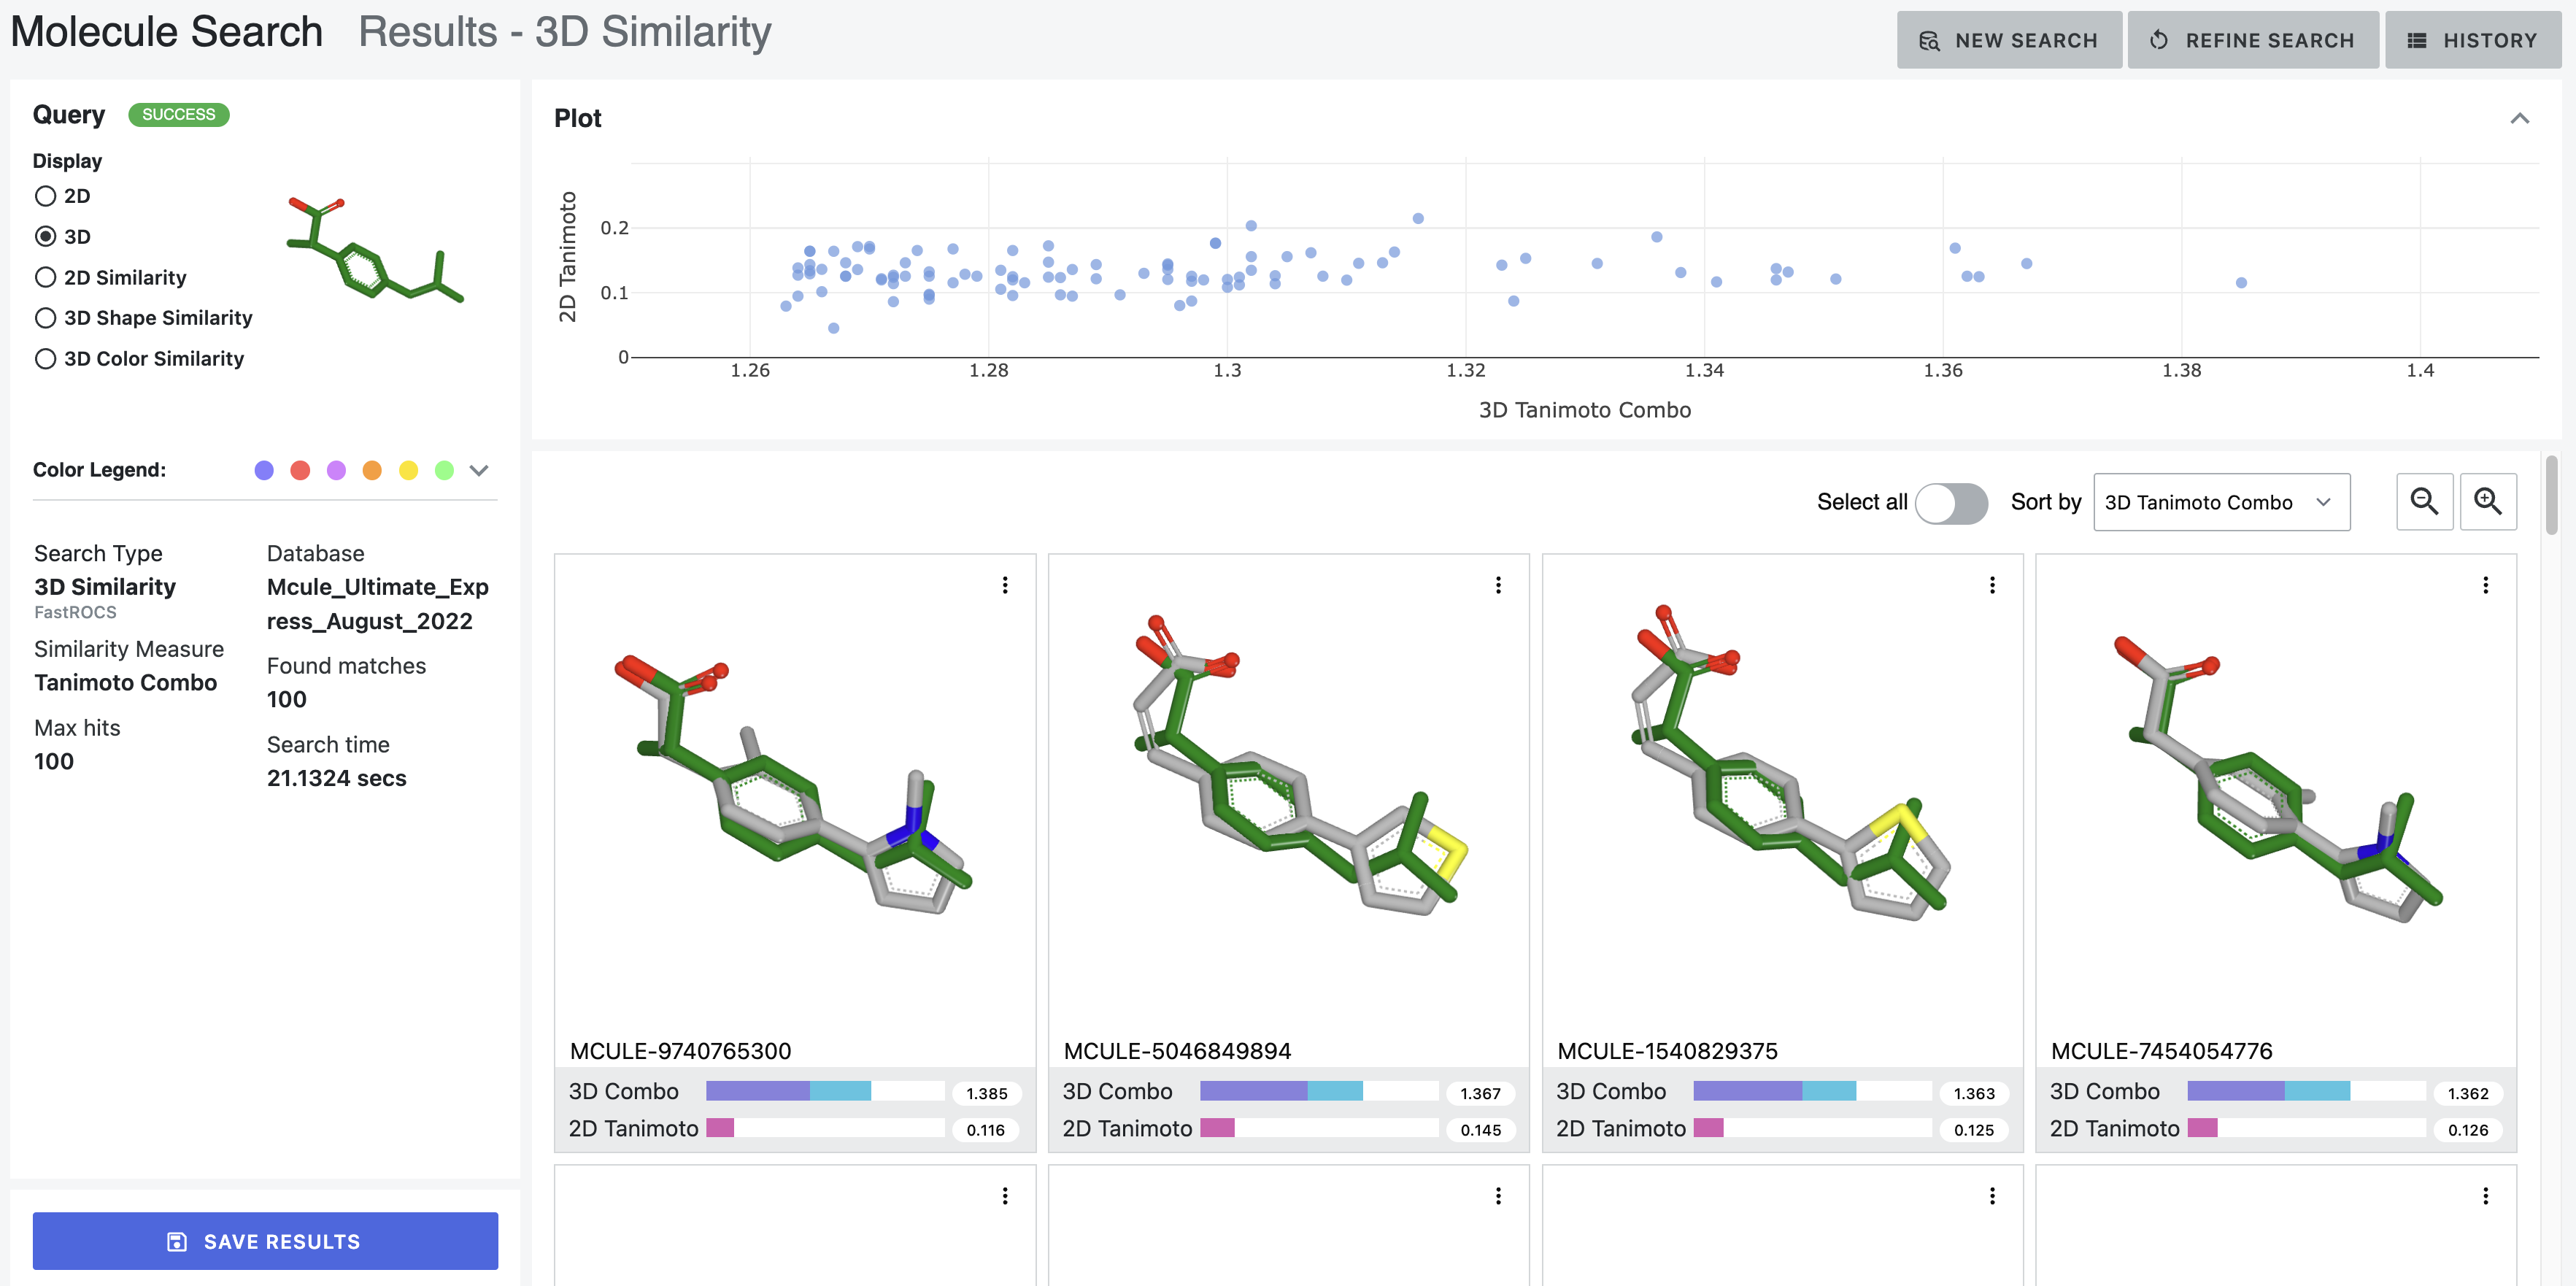
Figure 10. 3D depictions from the 3D similarity search of ibuprofen.
When a 3D search is performed using the “Color Atoms” feature, there is an additional viewing option. When the “Show Color Atoms” toggle in the 3D display in On, the structures are displayed to show the color atoms from the search and a label for the corresponding chemical feature.
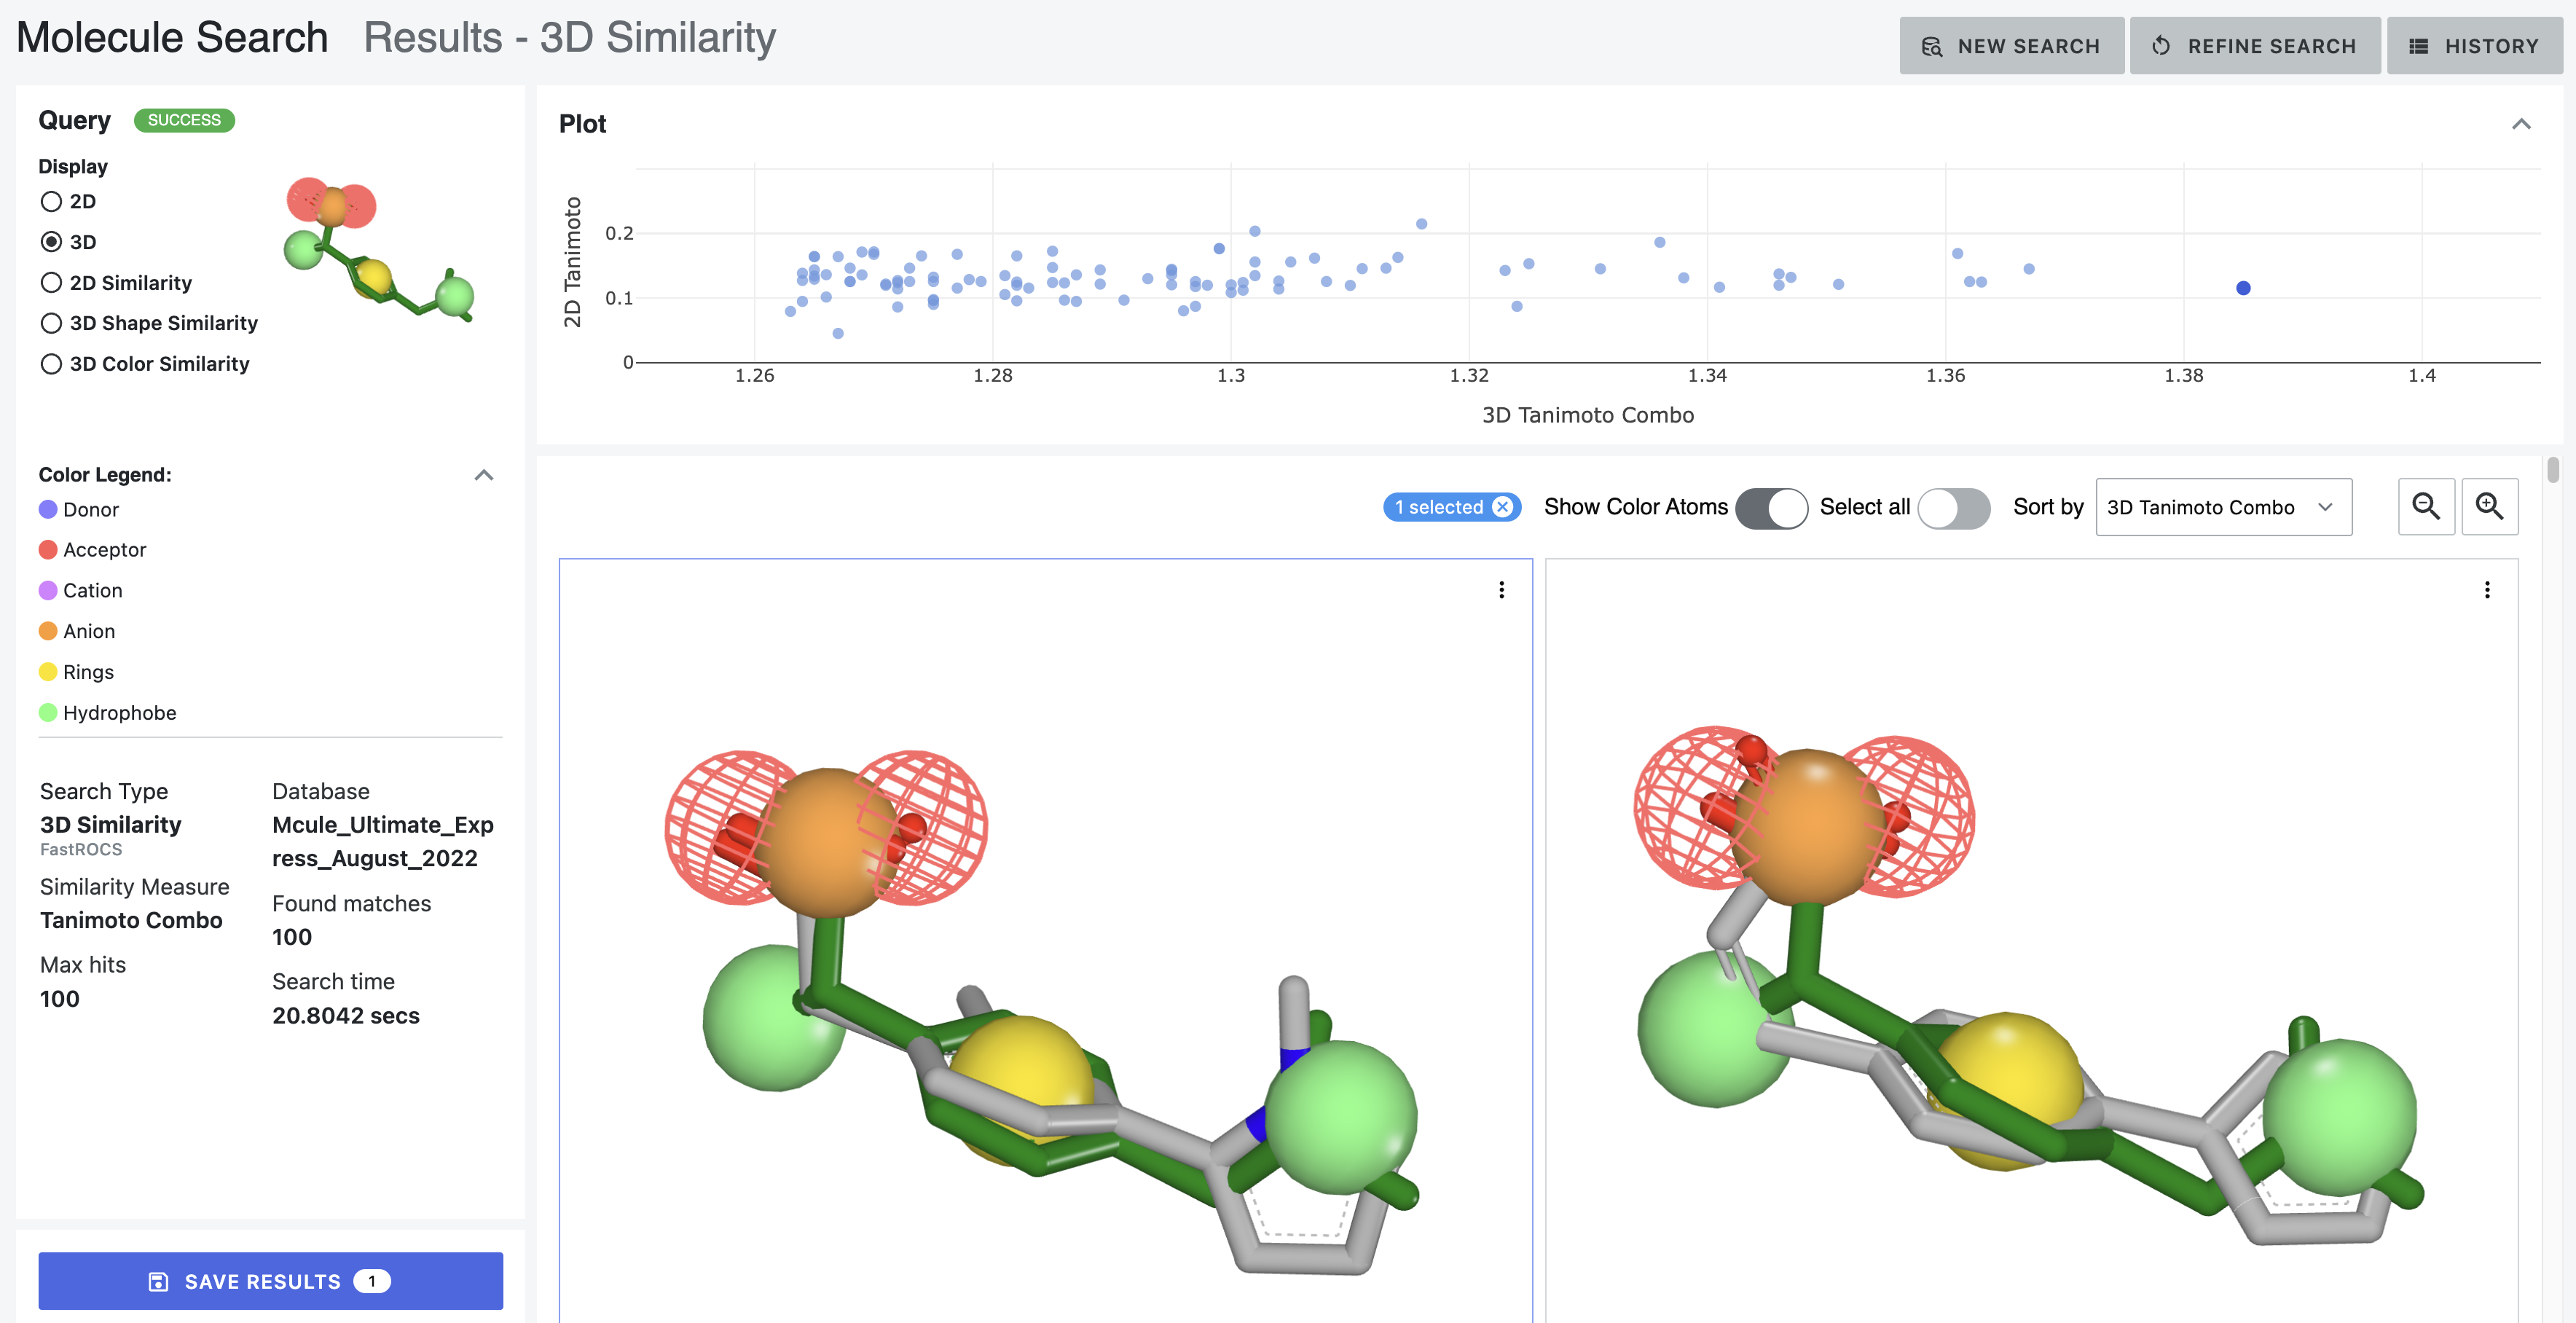
Figure 11. Depictions from a 3D similarity search of ibuprofen using color atoms. The structures shown are the same as the first two molecules shown in the other 3D search results.
The similarity depiction shows the similarity of the database molecule to the query molecule with a color gradient from yellow to dark green, with dark green indicating greater 2D similarity. Pink sections of the database molecule are not similar to the query molecule.
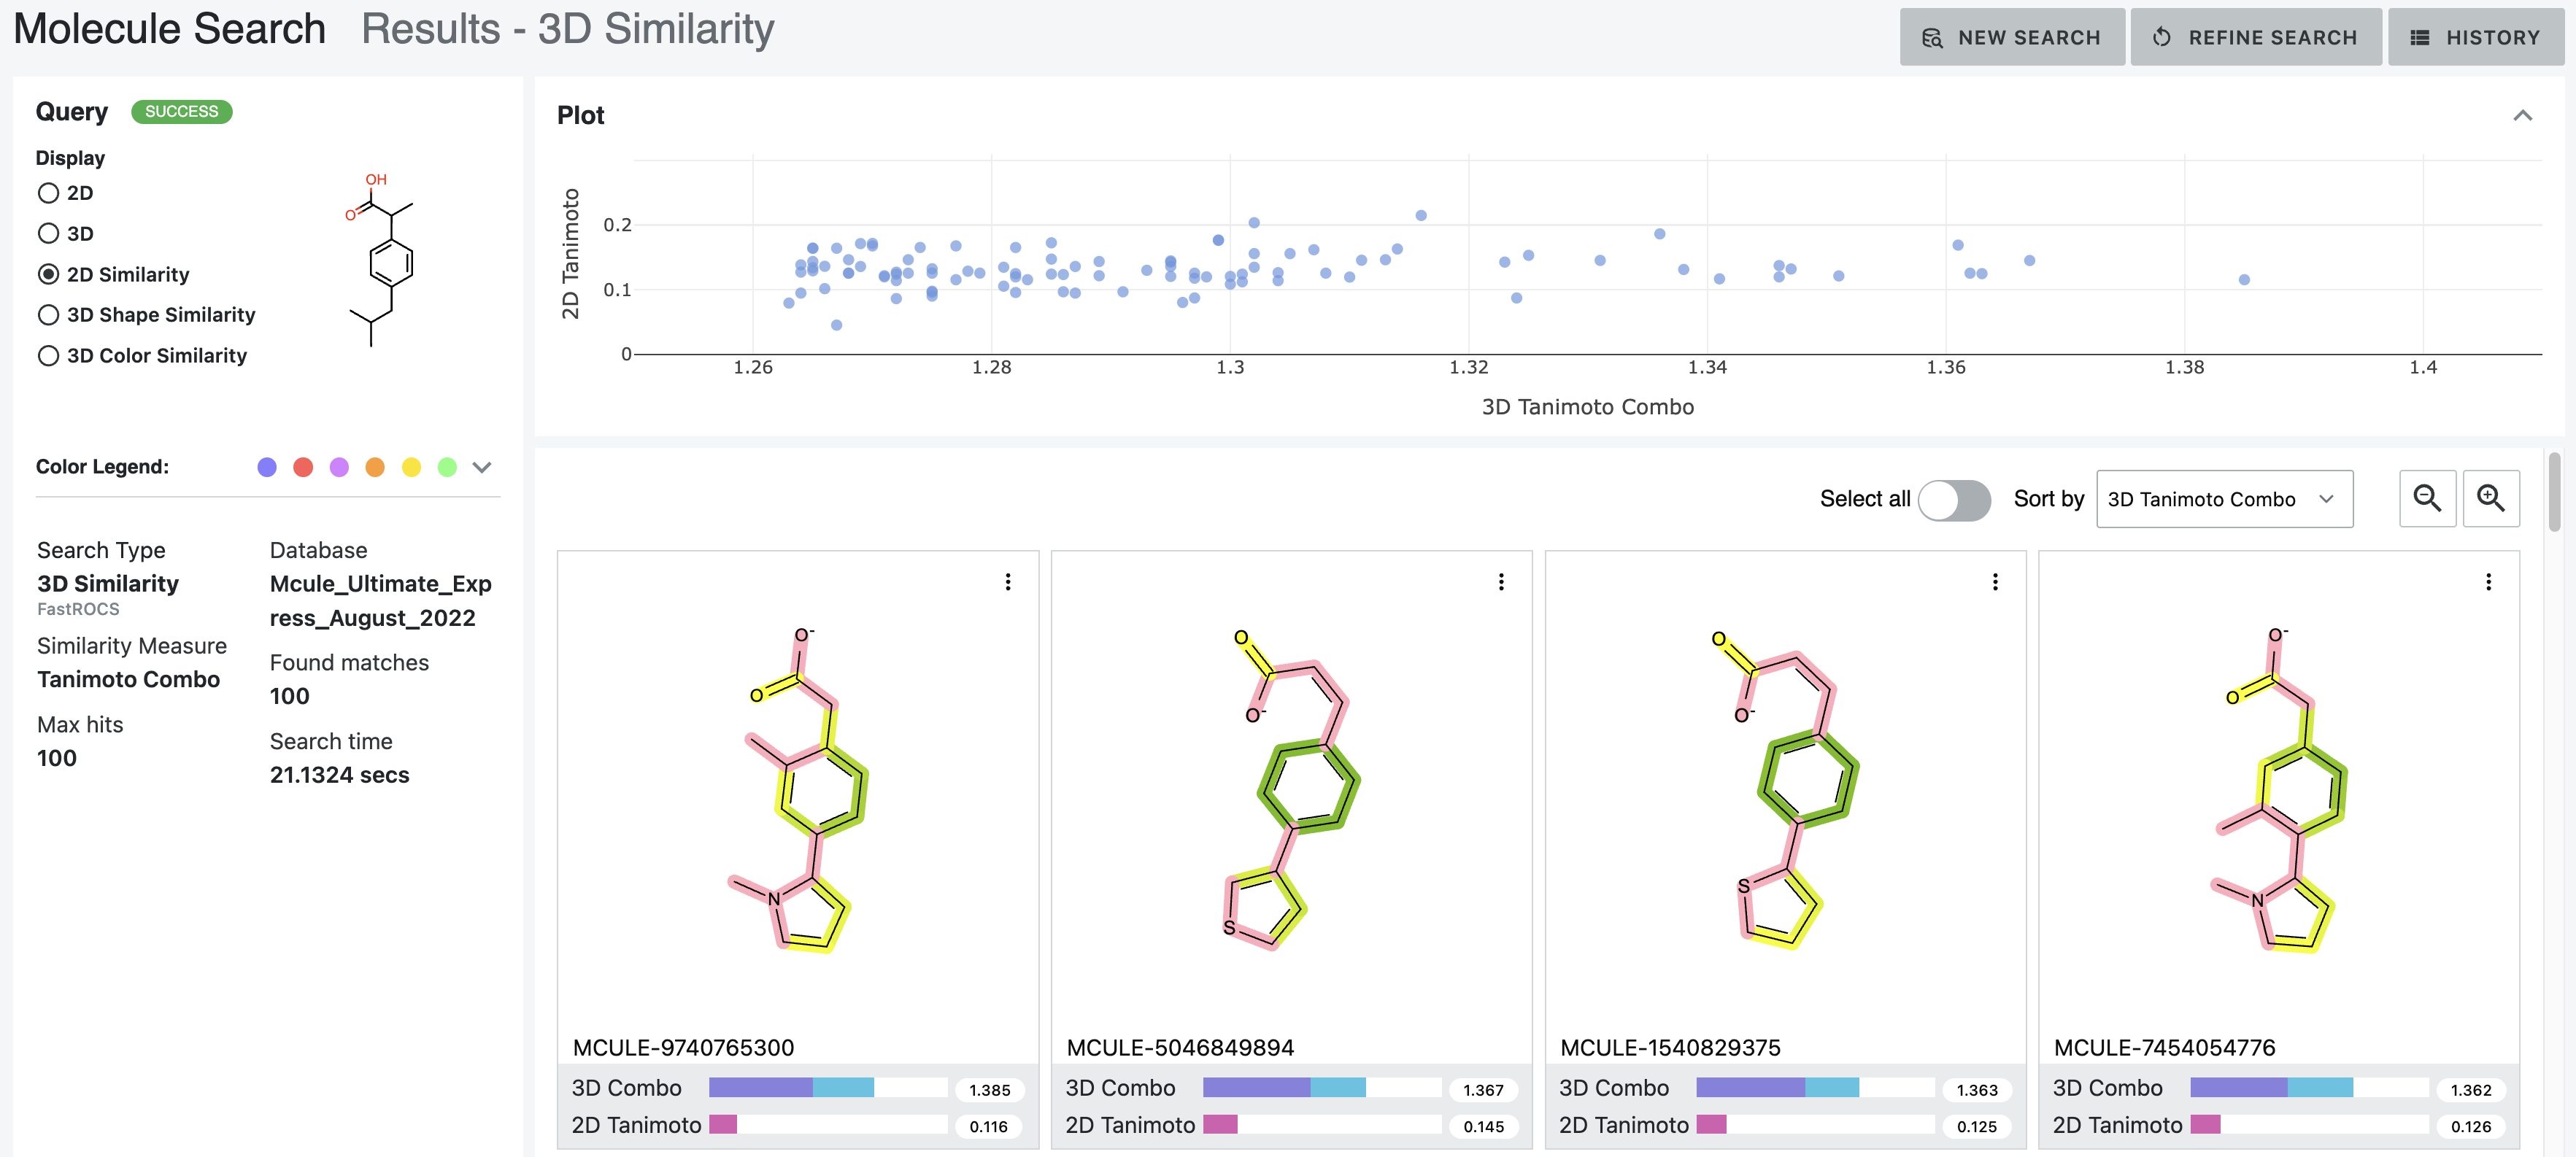
Figure 12. The 2D similarity depiction of ibuprofen and the database molecules.
The shape depiction uses volume depiction of the query molecule overlaid with the 2D structure of the database molecule. The grey dotted outline indicates the outer edge of the query molecule’s shape. A purple gradient indicates the database molecule’s shape alignment with the query molecule, with darker regions indicating higher shape overlap between the molecules.
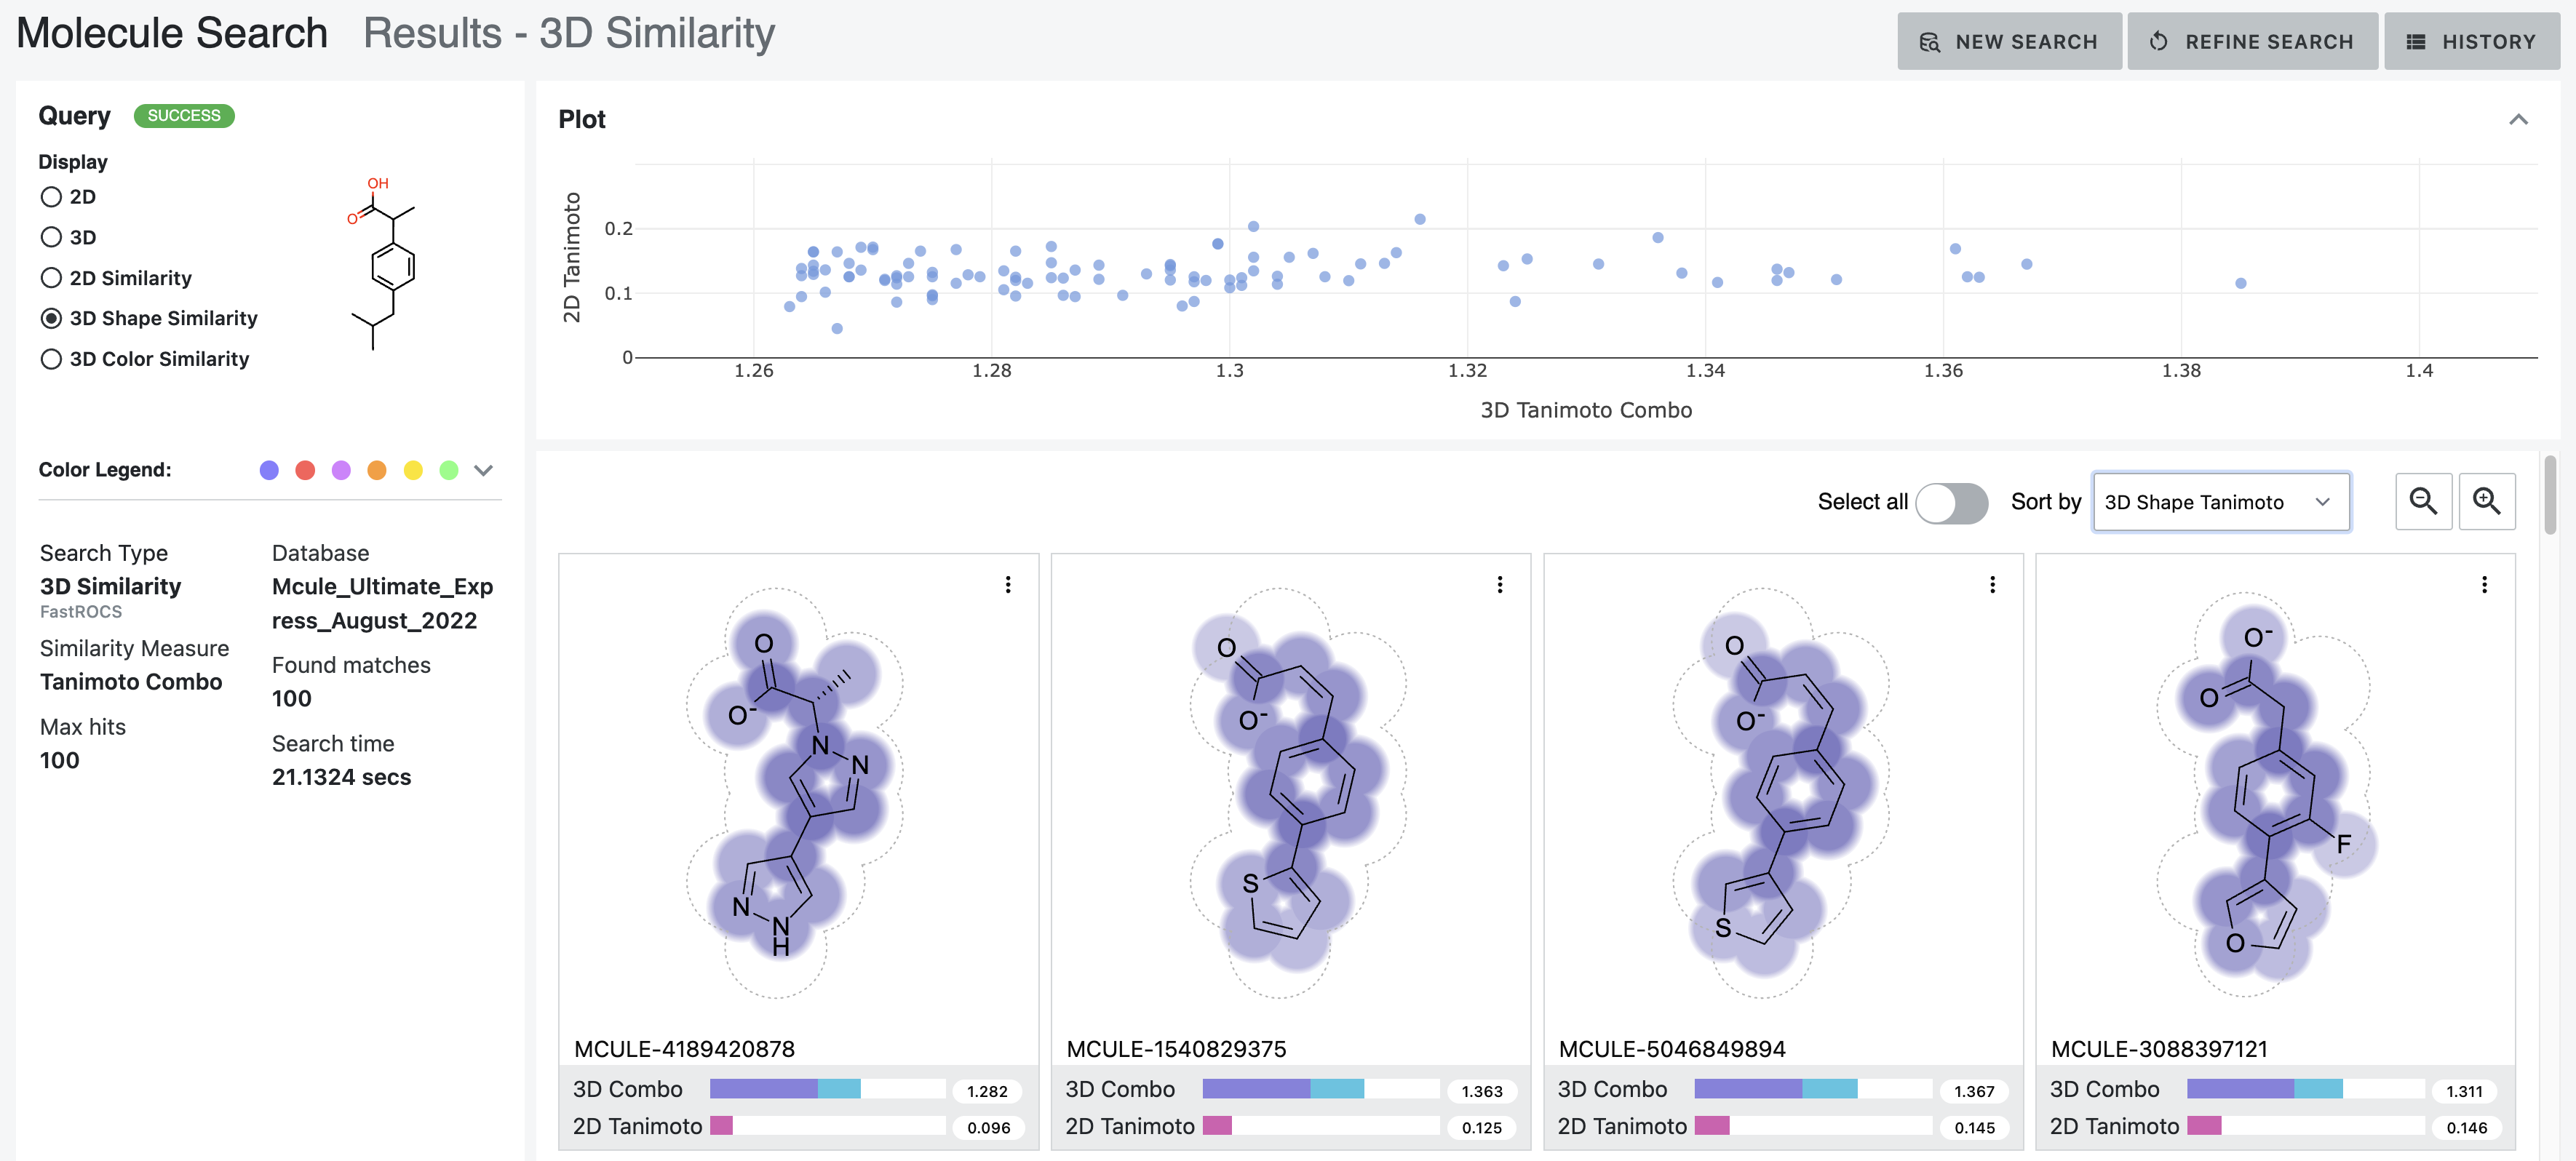
Figure 13. The shape depiction of the volume of ibuprofen overlaid with the 2D structures of the database molecules. This example shows the the hits sorted by the 3D Shape Tanimoto score.
Finally, the color depiction displays the color atoms in a similar fashion to the 3D “Color Atoms” toggle in the Sketcher. The query molecule’s color atoms are overlaid with the database molecule’s color atoms in 2D. Similar and overlapping color atoms appear as solid circles. A shading gradient indicates the database molecule’s color alignment with the query molecule, with darker regions indicating higher color overlap between the molecules. Color atoms without overlap and similarity appear as open circles.
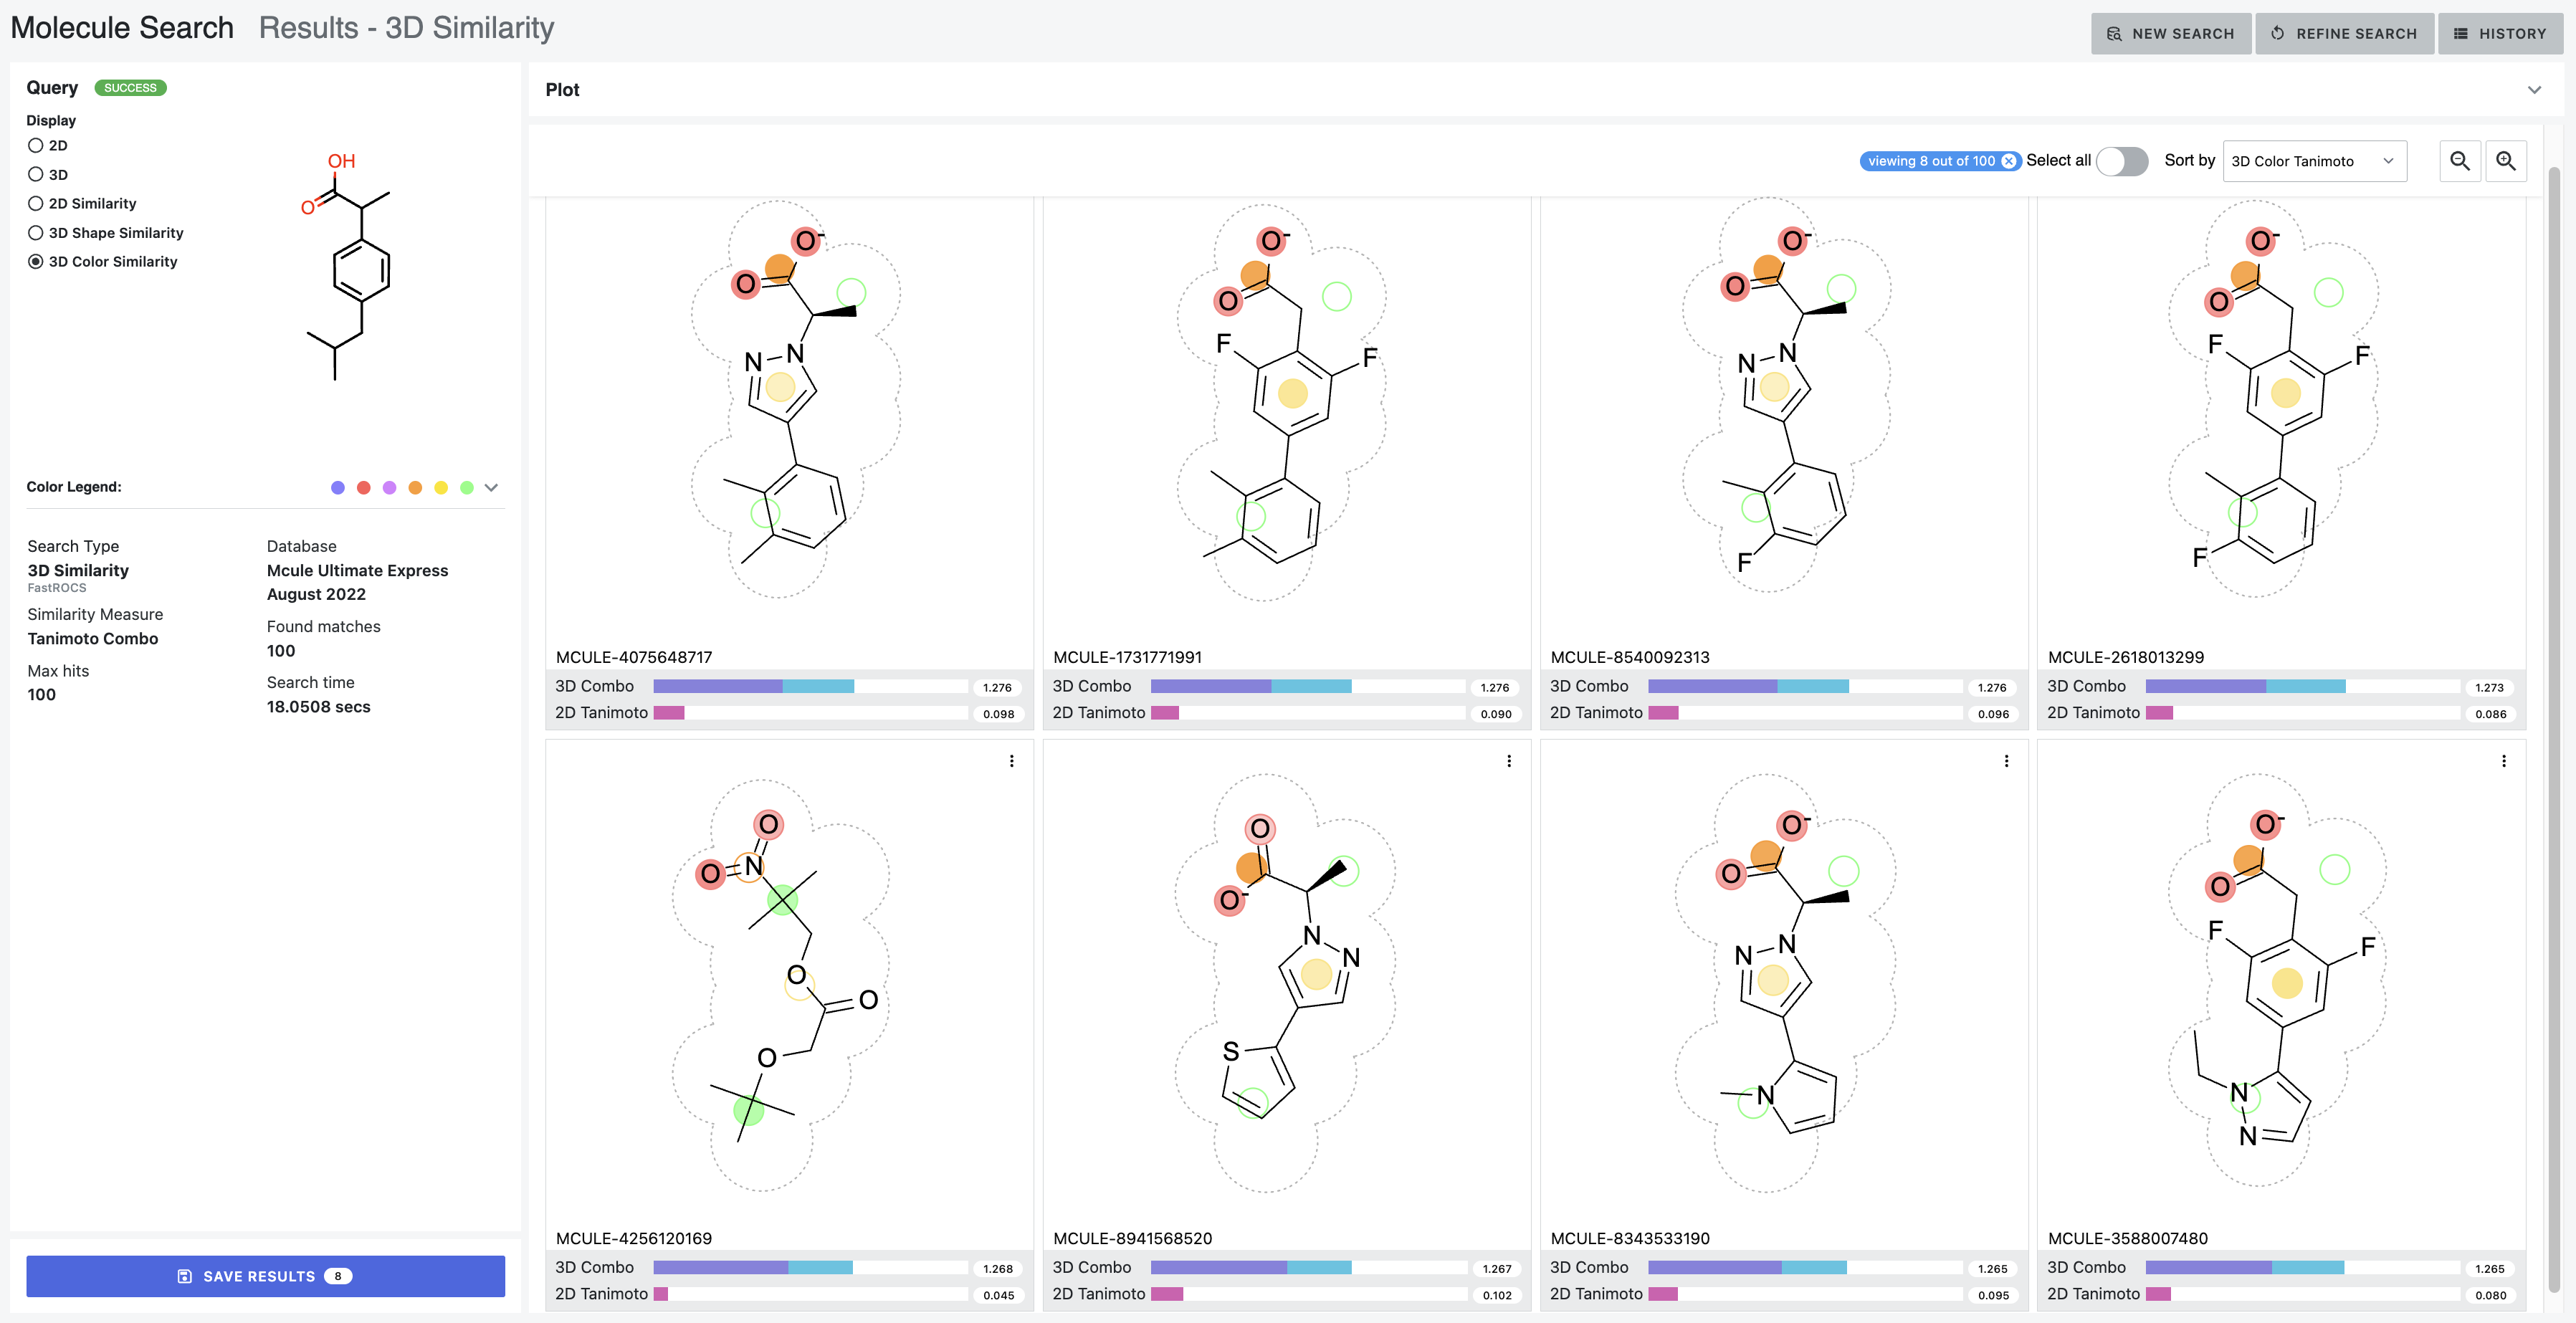
Figure 14. The color depiction of ibuprofen’s color atoms overlaid with the color atoms of the database molecules. These structures were chosen to illustrate how the color gradients can vary between the query and the database molecules. These hits are sorted by the 3D Color Tanimoto score.
Note
No similarity scores are provided for substructure or exact searches, but only the titles of the found structures.
Substructure Search Results
Common substructures found by a substructure search are highlighted in blue. Atoms and bonds that are not highlighted in blue are unique to the database molecule. Any atom or bond deviation, depending on the parameters set for the search, will not be highlighted in blue.
Note
With small databases such as the one in these examples, we can often trust that ibuprofen will be at the top of the hit list for this query. But the order of results may not be consistent with larger databases and more promiscuous queries.
By default, atom stereo information is not considered. Figure 15 shows this result, which has 42 matches.
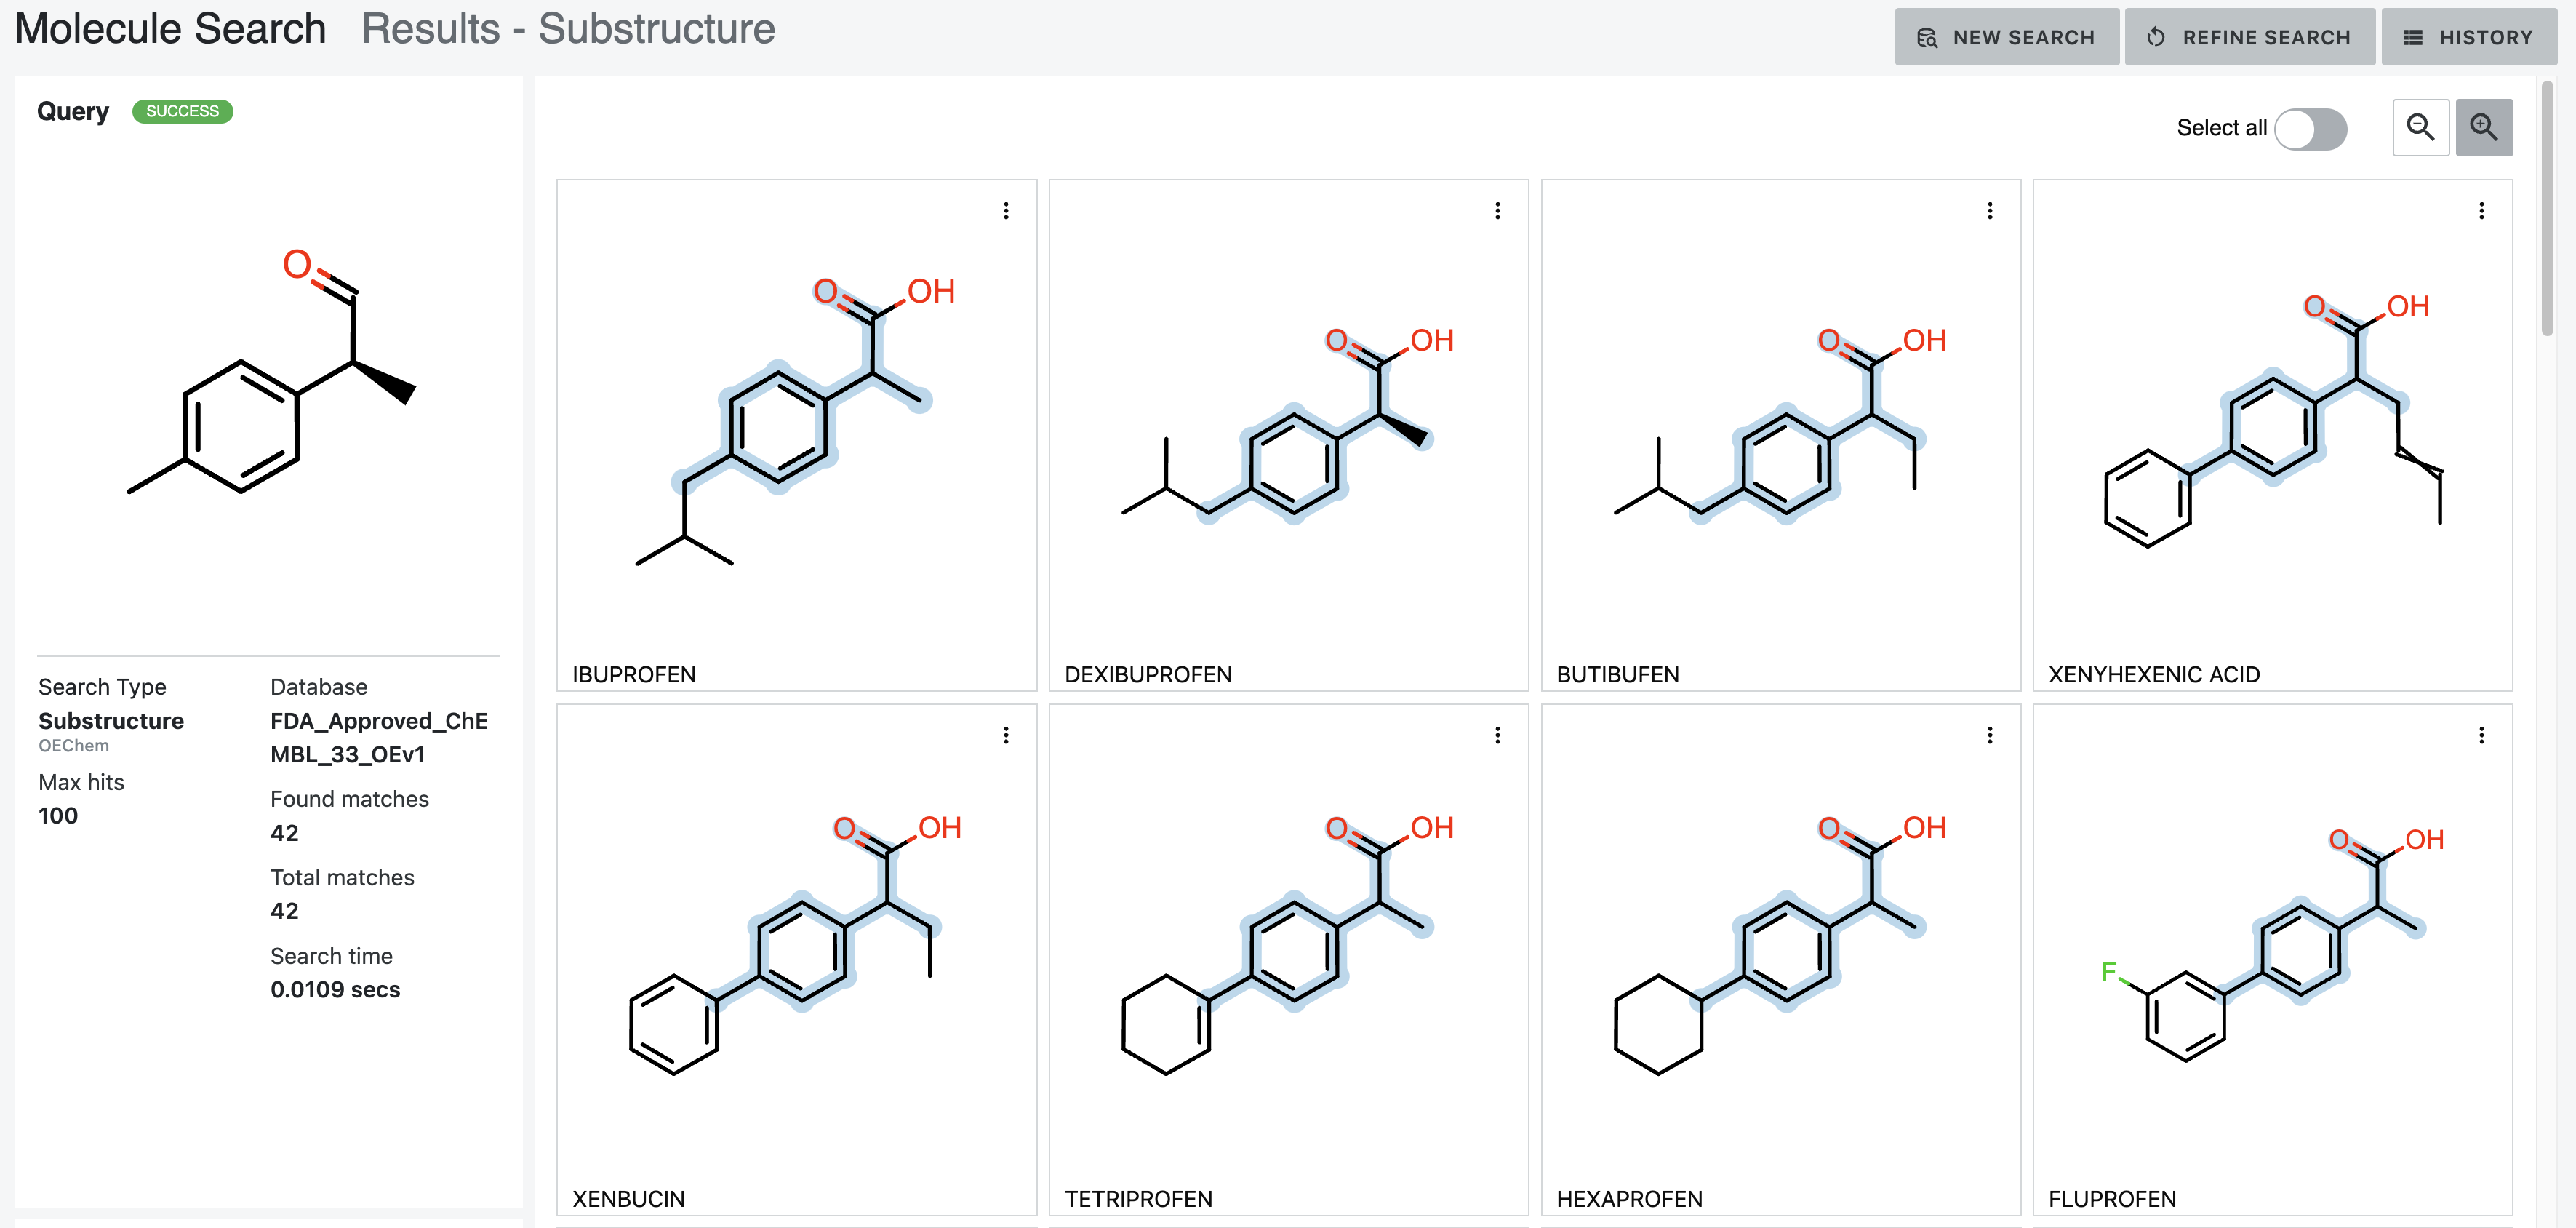
Figure 15. Results of a basic substructure search.
The MatchAtomStereo option forces the query molecules to match the specified atom stereo configuration, and the hits
decrease to five, as shown in Figure 16.
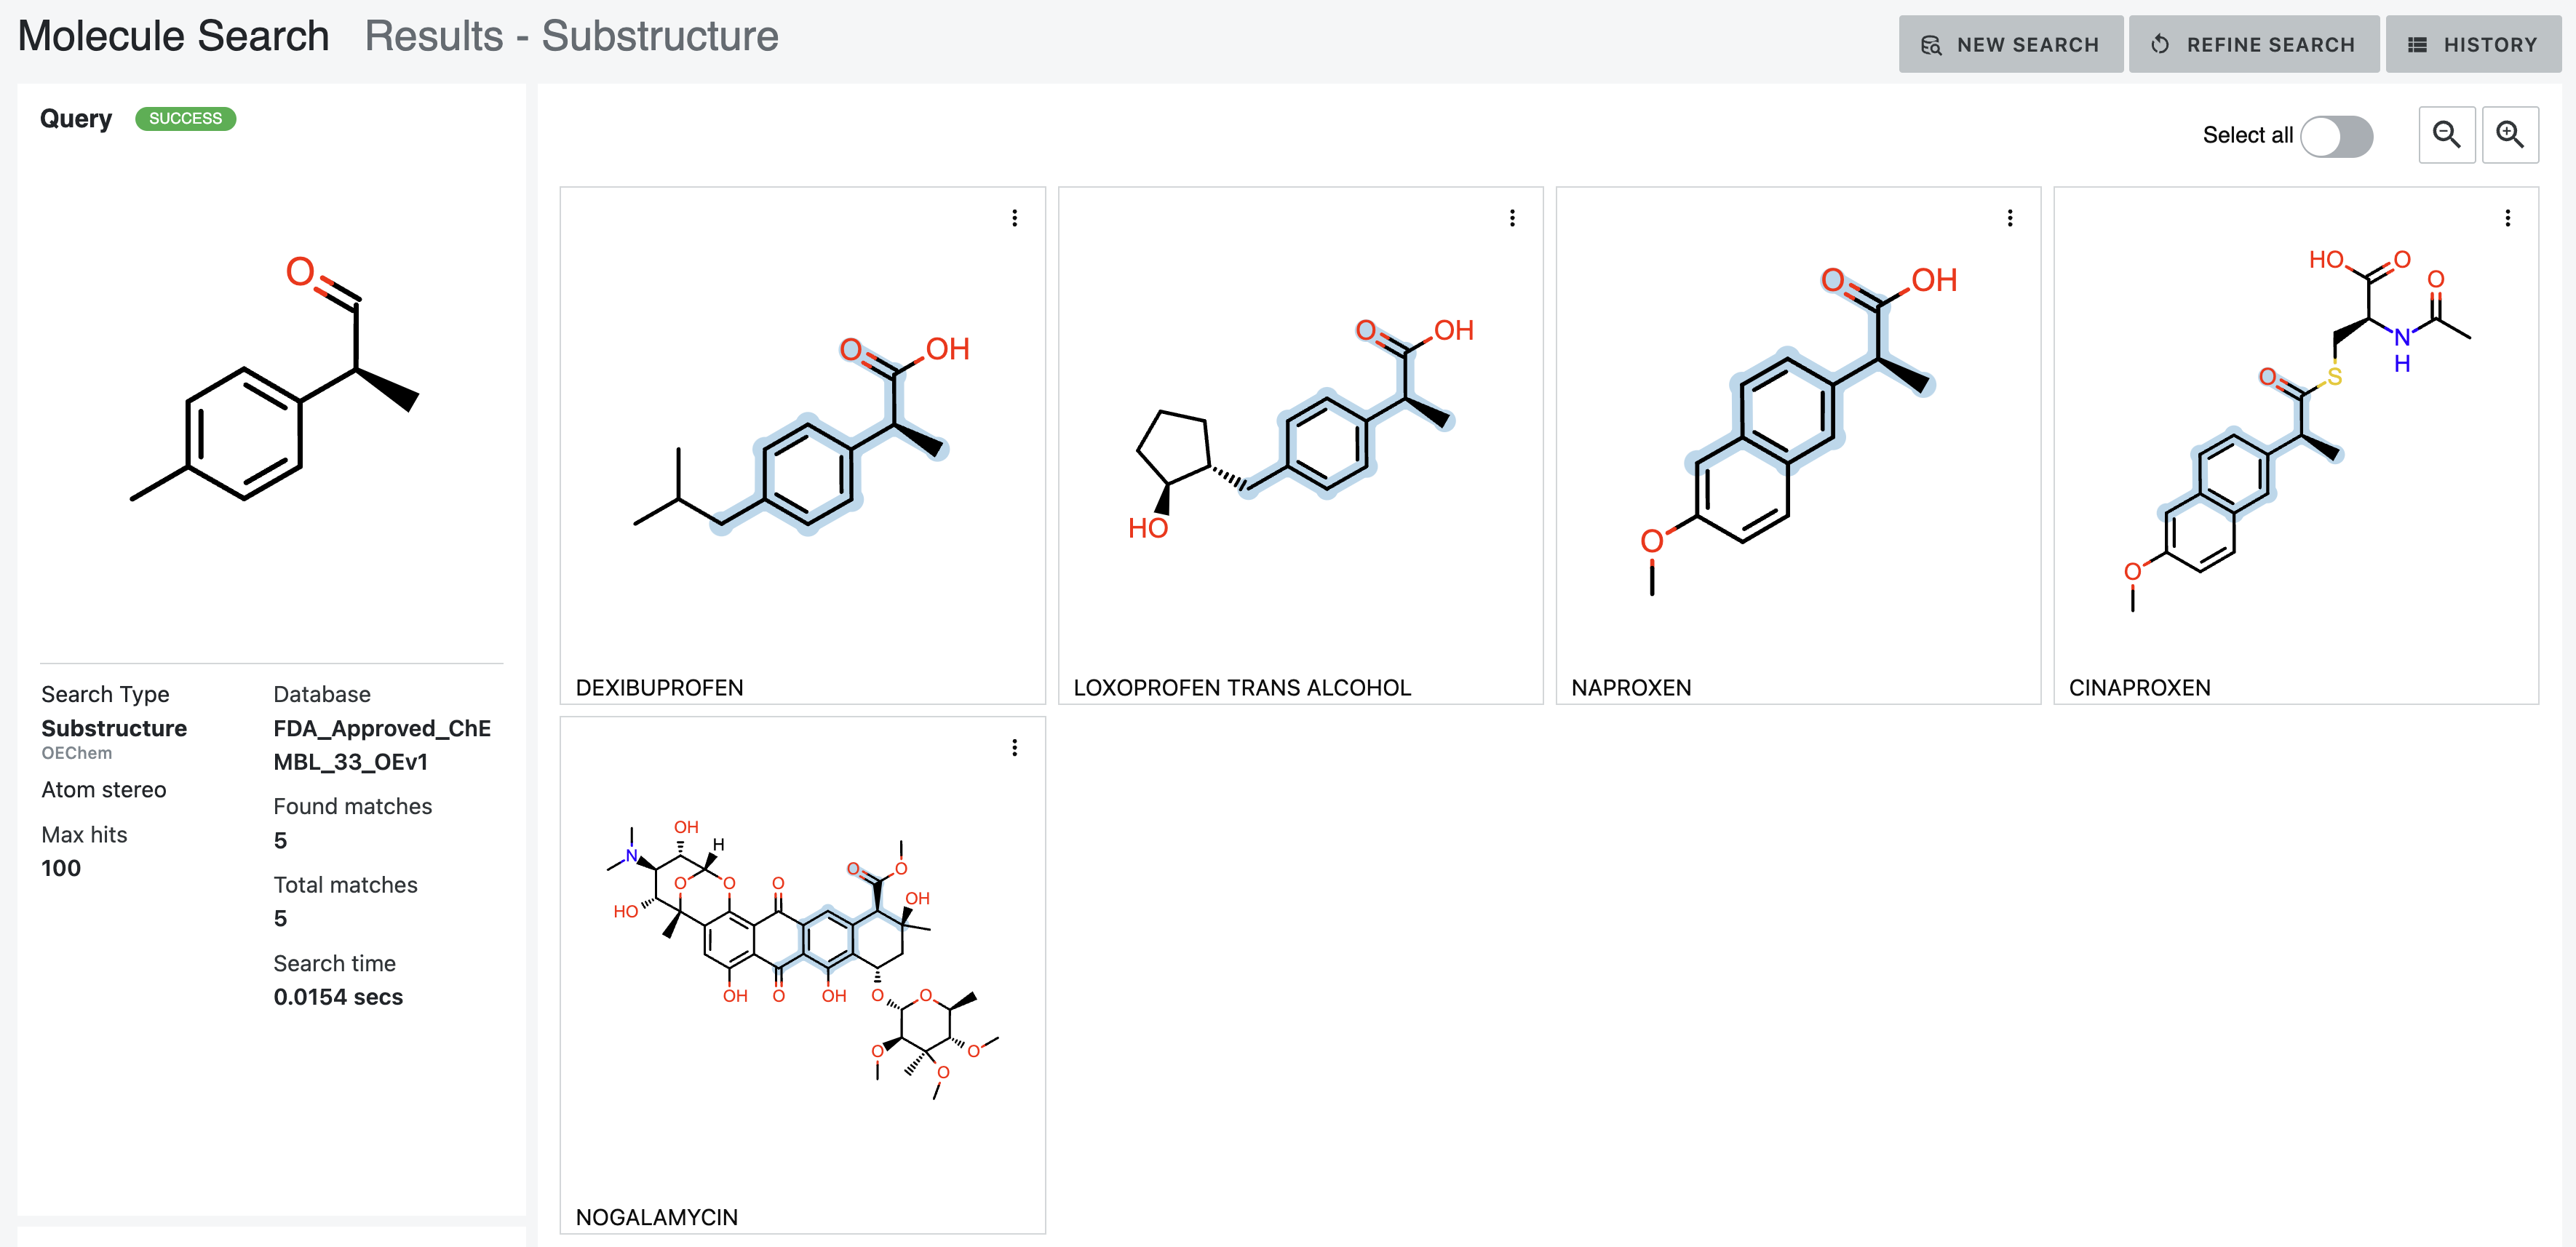
Figure 16. Results of a substructure search with the Atom Stereo parameter chosen.
The AddBondAliphaticConstraint only allows aliphatic query bonds to be mapped to aliphatic bonds in the database
molecules. Adding this constraint drops the hits to three. For example, naproxen in Figure 16 does not match the parameter
requirements. The aliphatic methyl in the query does not match the aromatic bond in the napthalene of naproxen.
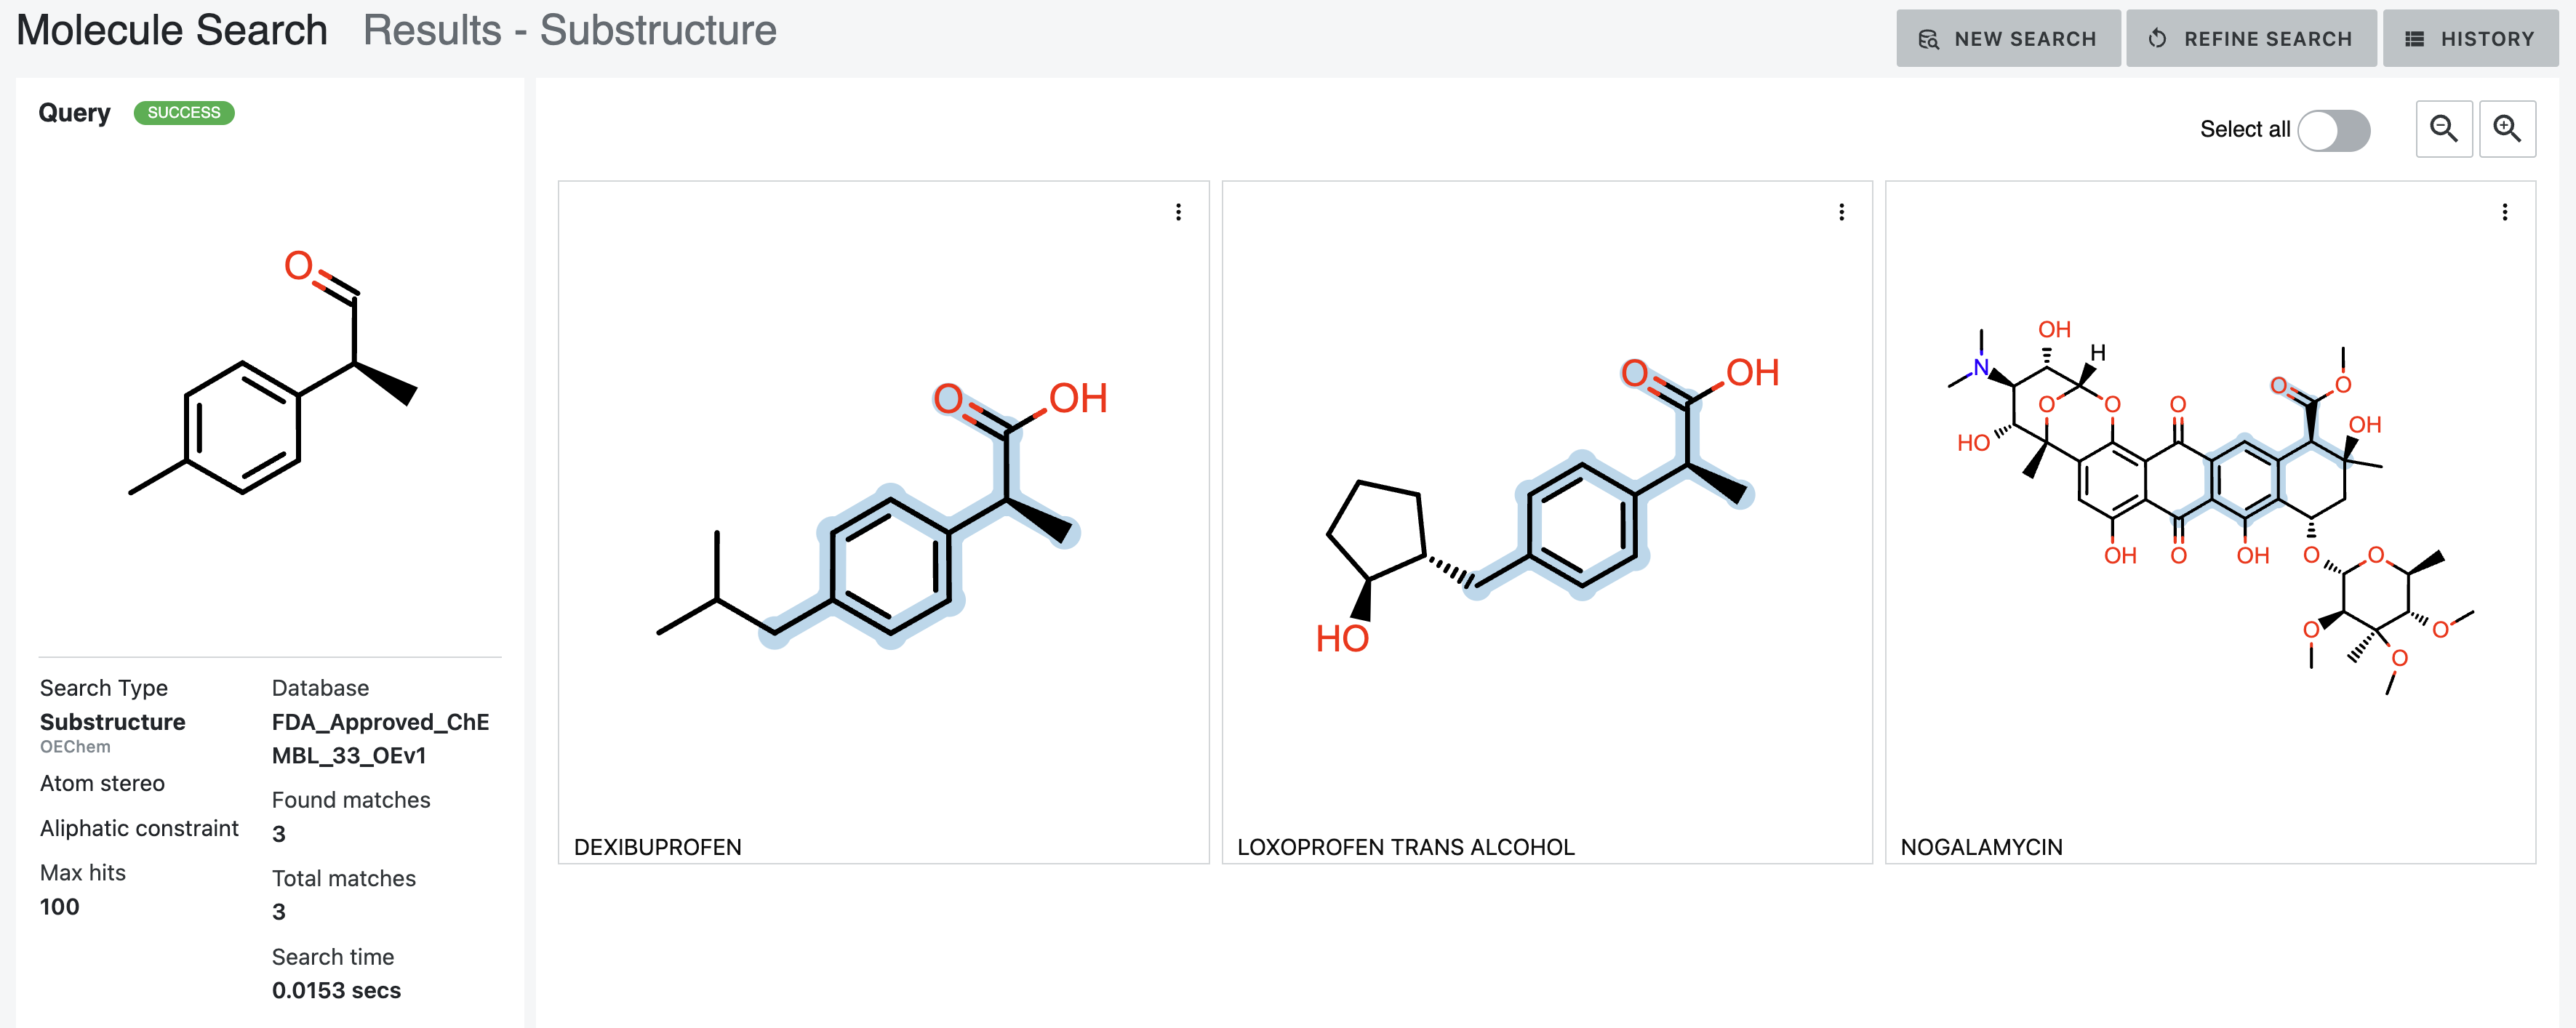
Figure 17. Results of a substructure search with the Atom Stereo and Aliphatic Constraint parameters chosen.
Adding the third parameter, AddBondTopologyConstraint, requires that chain bonds be mapped only to chain bonds. This
reduces the hits to two, as nogalamycin maps to a ring bond.
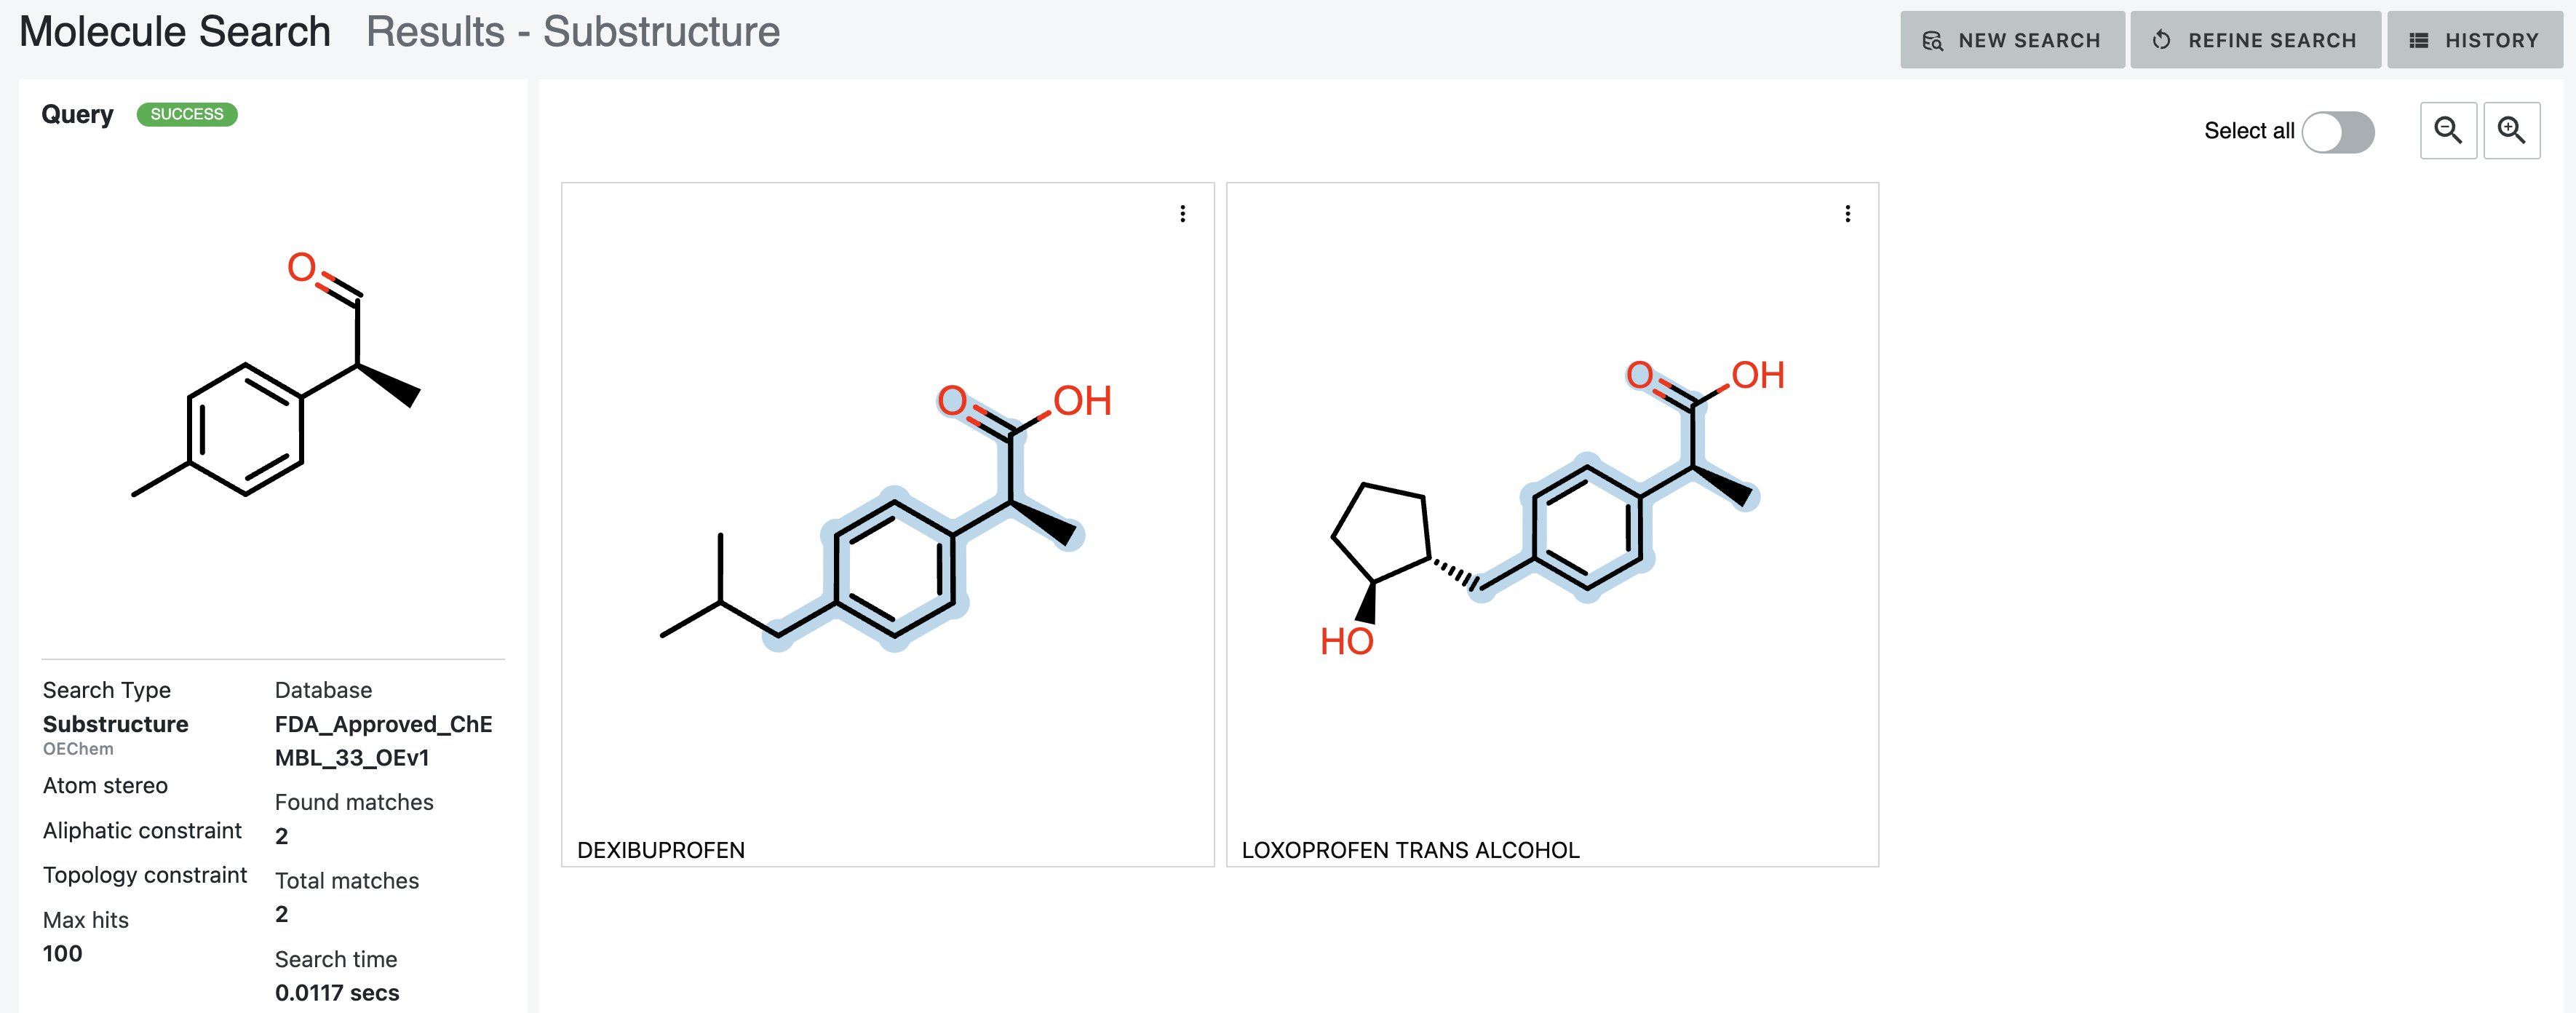
Figure 18. Results of a substructure search with the Atom Stereo, Aliphatic Constraint, and Topology Constraint parameters chosen.
The combination of the MatchAtomStereo and AddBondTopologyConstraint options yields the same result shown in
Figure 18, as the disallowed aliphatic/aromatic matches are also chain/ring matches.
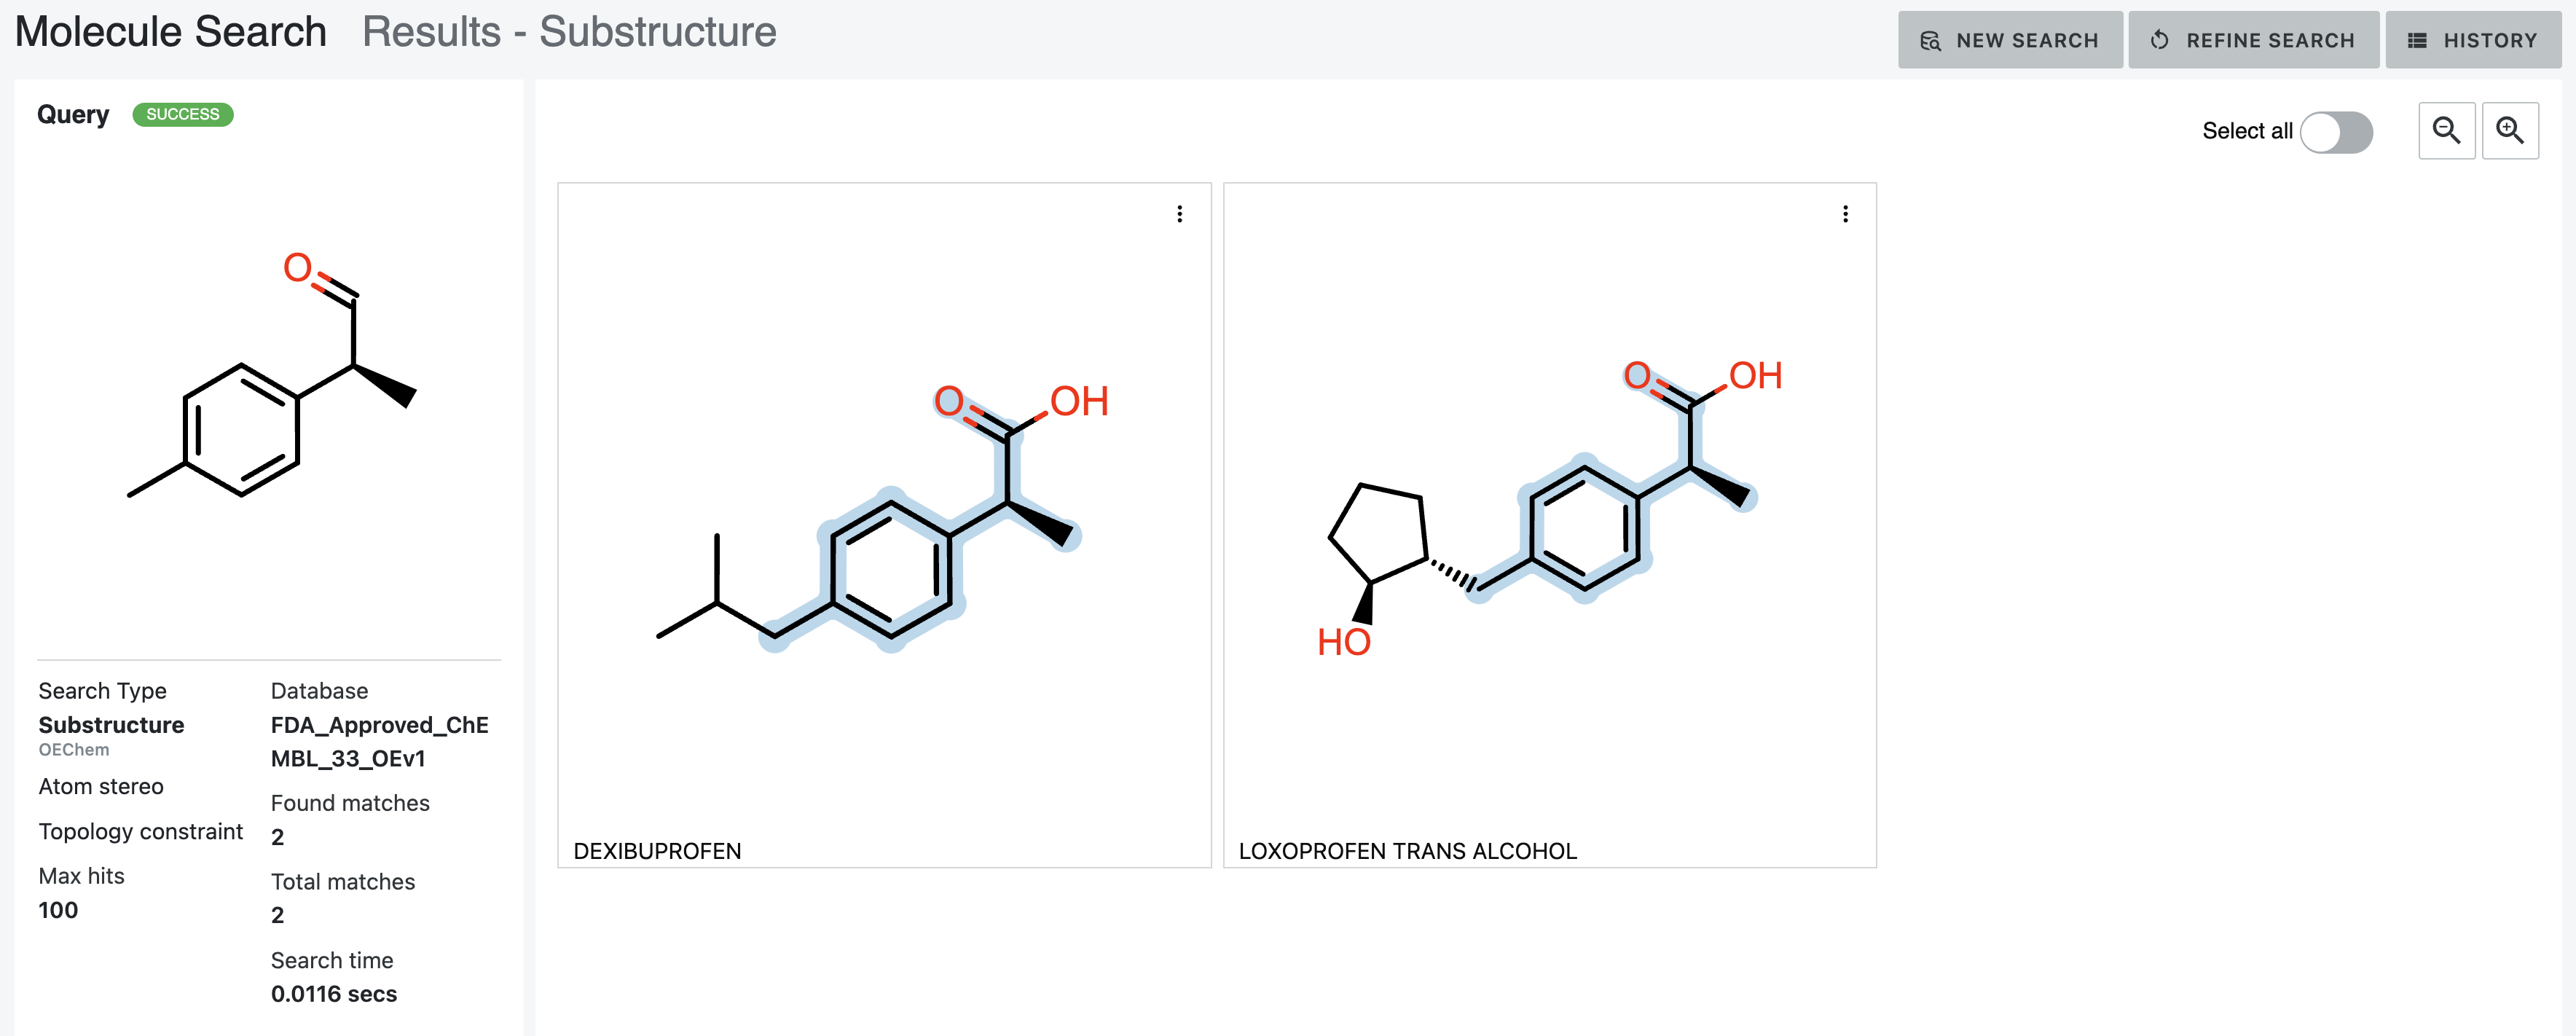
Figure 19. Results of a substructure search with the Atom Stereo and Topology Constraint parameters chosen.
As one would expect, the AddBondAliphaticConstraint and the AddBondTopologyConstraint parameters either on their
own or combined are not nearly as restrictive as searches that include MatchAtomStereo to restrict the atom stereo configuration.
Exact Match Search Results
Again, an exact search seeks to restrict or maintain the stereochemistry, bonding, or hybridization of a structure. An exact search may yield no results if the query molecule is not present in the database, or it may yield only the query molecule. Some searches do yield several hits, depending on the database and parameter choices. Exact searches can be very sensitive to the parameters chosen for the search.
The parameters chosen for the search are listed under Exact Search Type in the query information of the Results section. These search parameters use the following terms:
ISM: Match Stereo. The stereochemistry of the query and the database molecules must match. See the documentation for the OECreateIsoSmiString function and the OESMILES flag in OEChem TK.
ABS: Match without Stereo. The stereochemistry configuration does not need to match. See the documentation for the OECreateAbsSmiString function in OEChem TK.
ISOMORPH: Isomorphic Match. Atom hybridization is retained.
UNCOLOR: Match Uncolored Graph. Chemical features are stripped from the query and only the connectivity between atoms is retained.
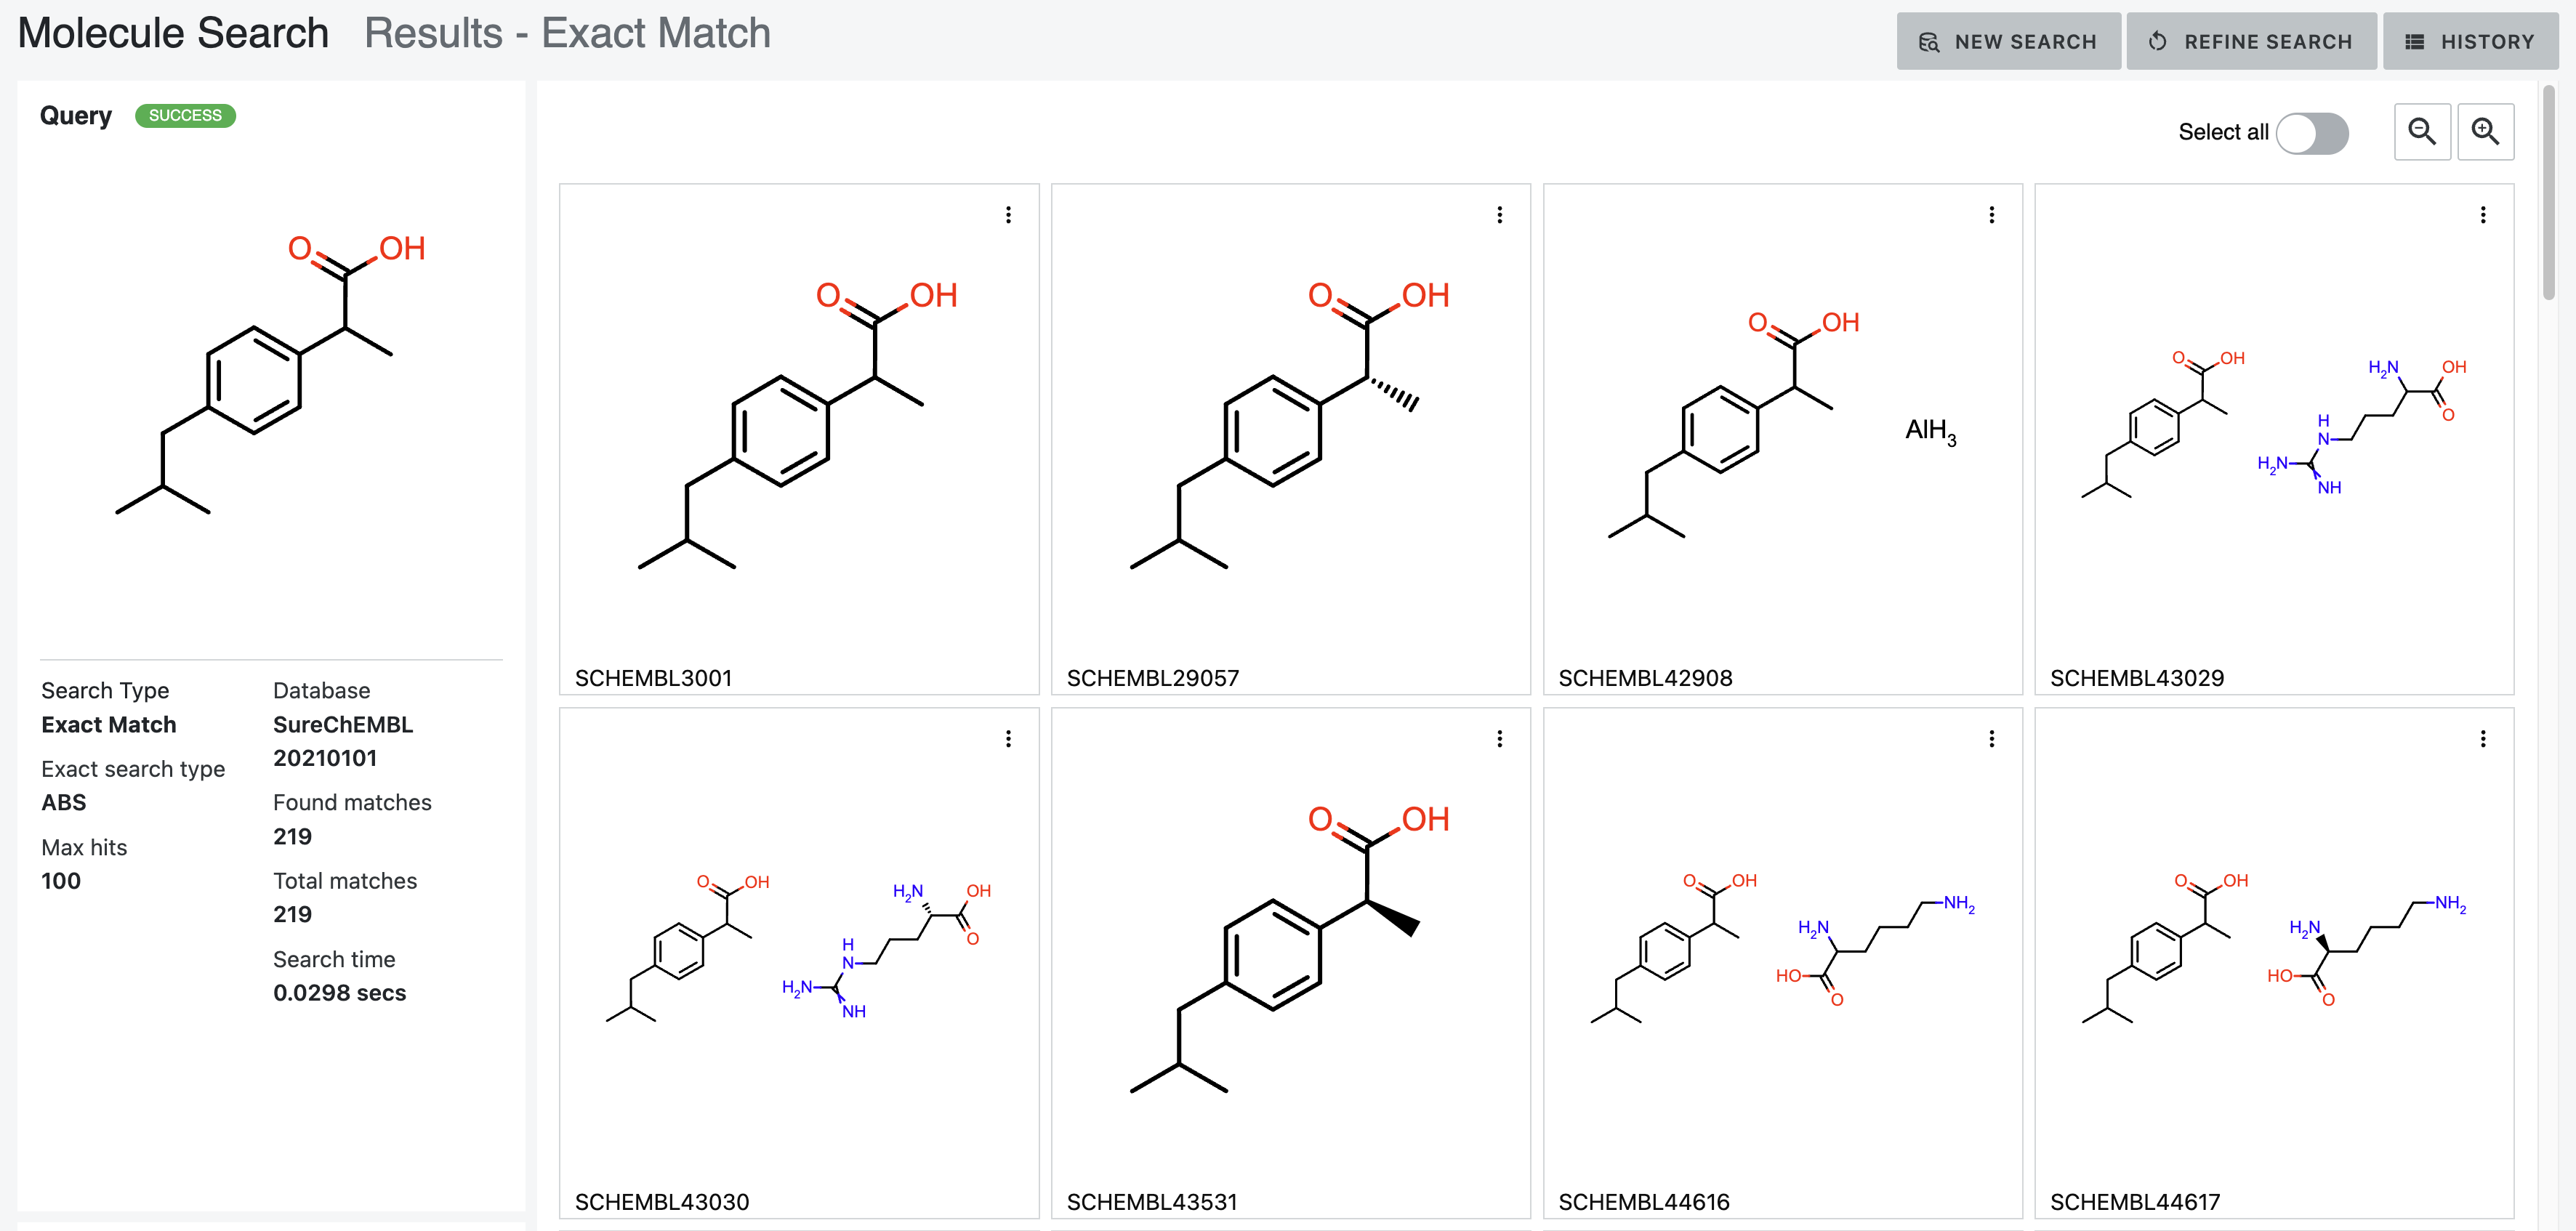
Figure 20. Results of an Exact Match search using the Match without Stereo parameter.
Using a Result for a New Search
Any of the search results can be used as input for a new search, using either the kebab menu ( ) or drag-and-drop.
Click on the kebab menu of a molecule in the search results, then select “New Search.” Alternatively, you can copy the
found molecule as a title, SMILES string, or MOL file.
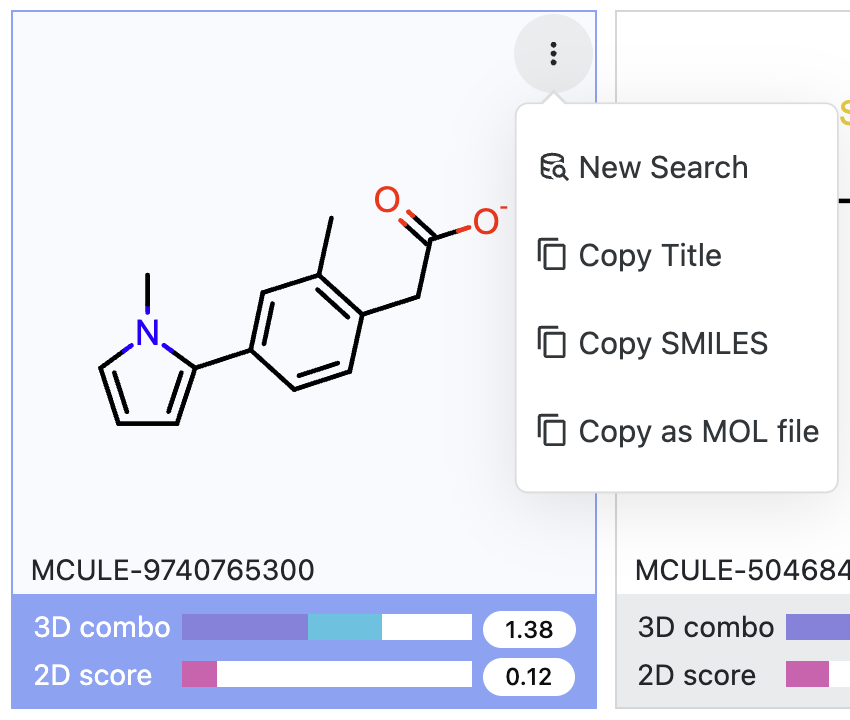
Figure 21. Ways to use the kebab menu to use a hit molecule as a query for a new search.
The tile for a hit can also be dragged onto the query molecule tile. Hover over the horizontal bar at the top of the hit molecule tile and then use the hand drag icon to overlap the query molecule. This sends the molecule directly to the search window.
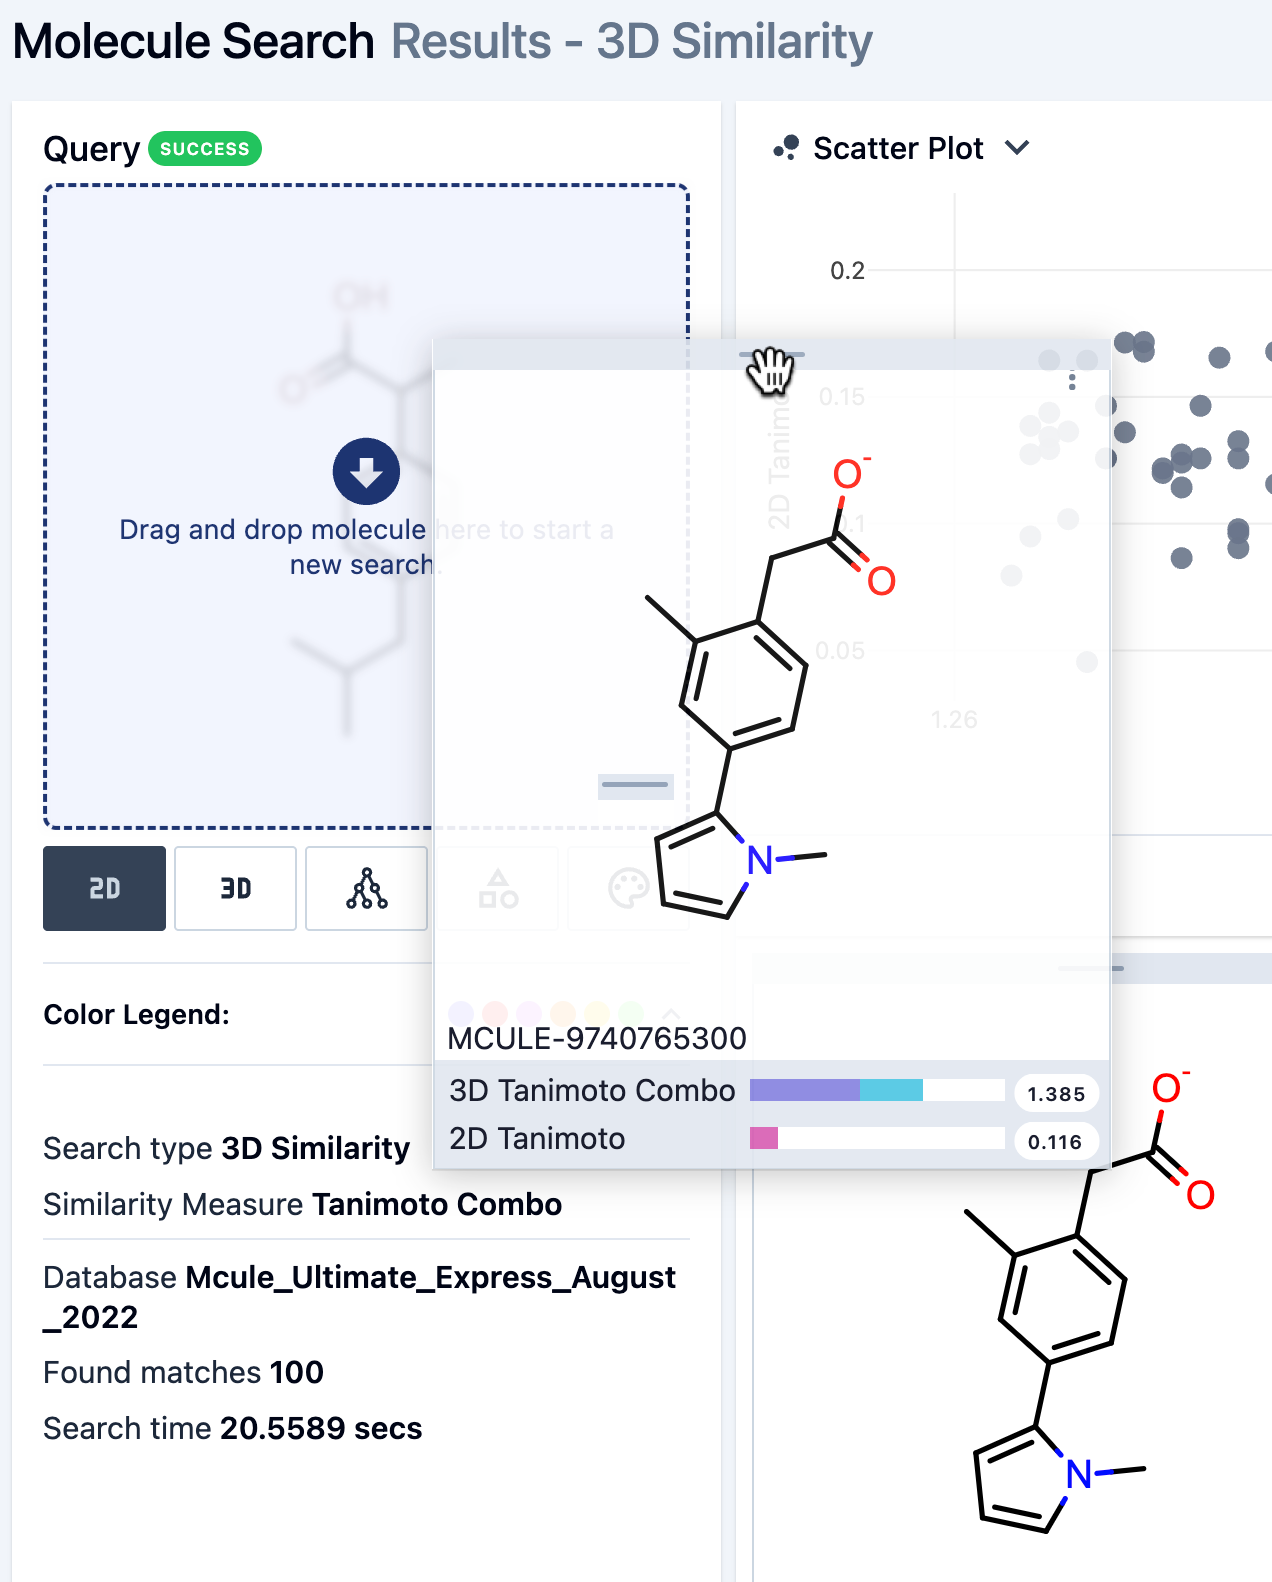
Figure 22. Dragging the hit molecule tile onto the query molecule to use the hit molecule as a new query.
How to Retain Search Results
Save Results
If you have an Orion license, you can save the search results to either a file or a dataset for use in other Orion operations. Select the results you want to save and click the drop-down arrow on the “Save as Dataset” button. If only some results were selected to save, the number of records will appear on the button. Here you can choose to save as either a file or a dataset, as shown in Figure 23.

Figure 23. Options for Orion customers to save a file or dataset. Standalone Search customers may save results only as a file.
Both options allow results to be sent directly to the 3D & Analyze page. To save as a file, the output can be saved to a .csv, .oeb, or .sdf file; in addition, all search types except for 3D can be saved to a .smi file.

Figure 24. Saving 2D search results as a file.
When saving as a dataset, you can specify a path for it.
Note
For 3D searches, the pop-up information box also includes a check box that allows you to save or create a query molecule file or dataset, respectively.
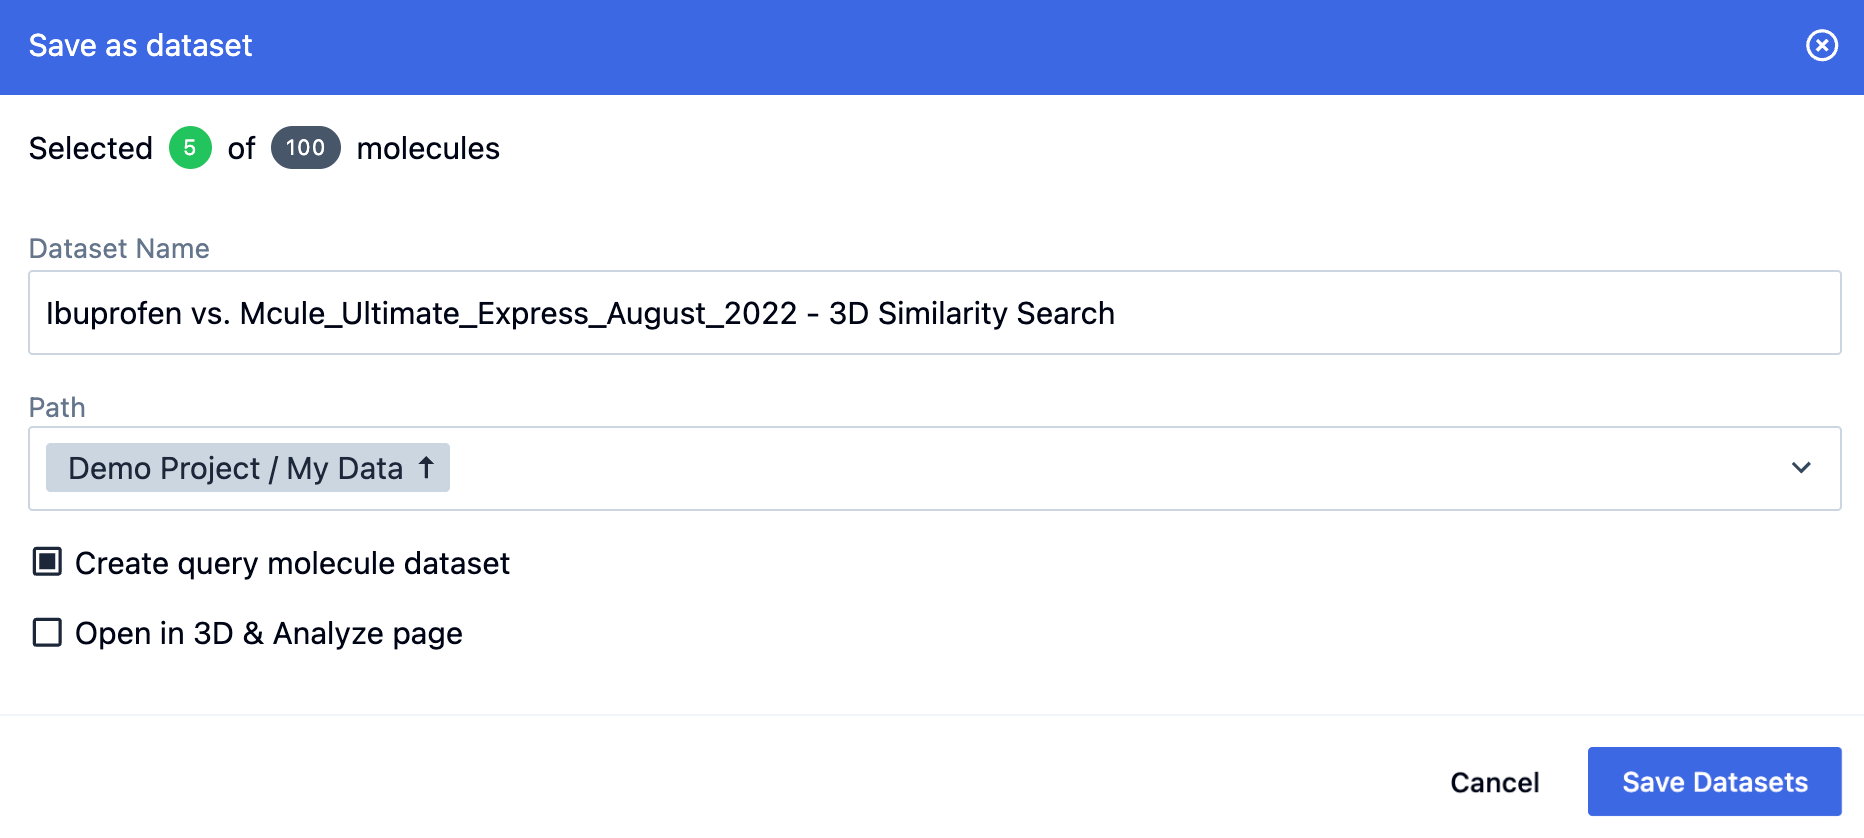
Figure 25. Saving the results of a 3D search as a dataset.
Note
Standalone Search customers may only download files. File types may be selected as above. There is also an option to save the query molecule file for 3D searches.
Search History
To view the results of recent and pinned searches, click the “History” button in the upper right corner. On the left side of each individual query in the History, an editable line is available to name the query after the search has been completed. The Options column lists all applicable information about the search, including the database used, similarity measure, maximum hits requested, fingerprint type, and constraints. On the right side, four options are available: Load Query, Load Results, Pin Query, and Delete. These options allow you to take the corresponding action regarding the query. “Load Results” allows you to access the results for that query. “Pin Query” will pin your search to retain the results. You can also narrow the view of the history using the “Show active project queries only” and “Show pinned queries only” toggles.
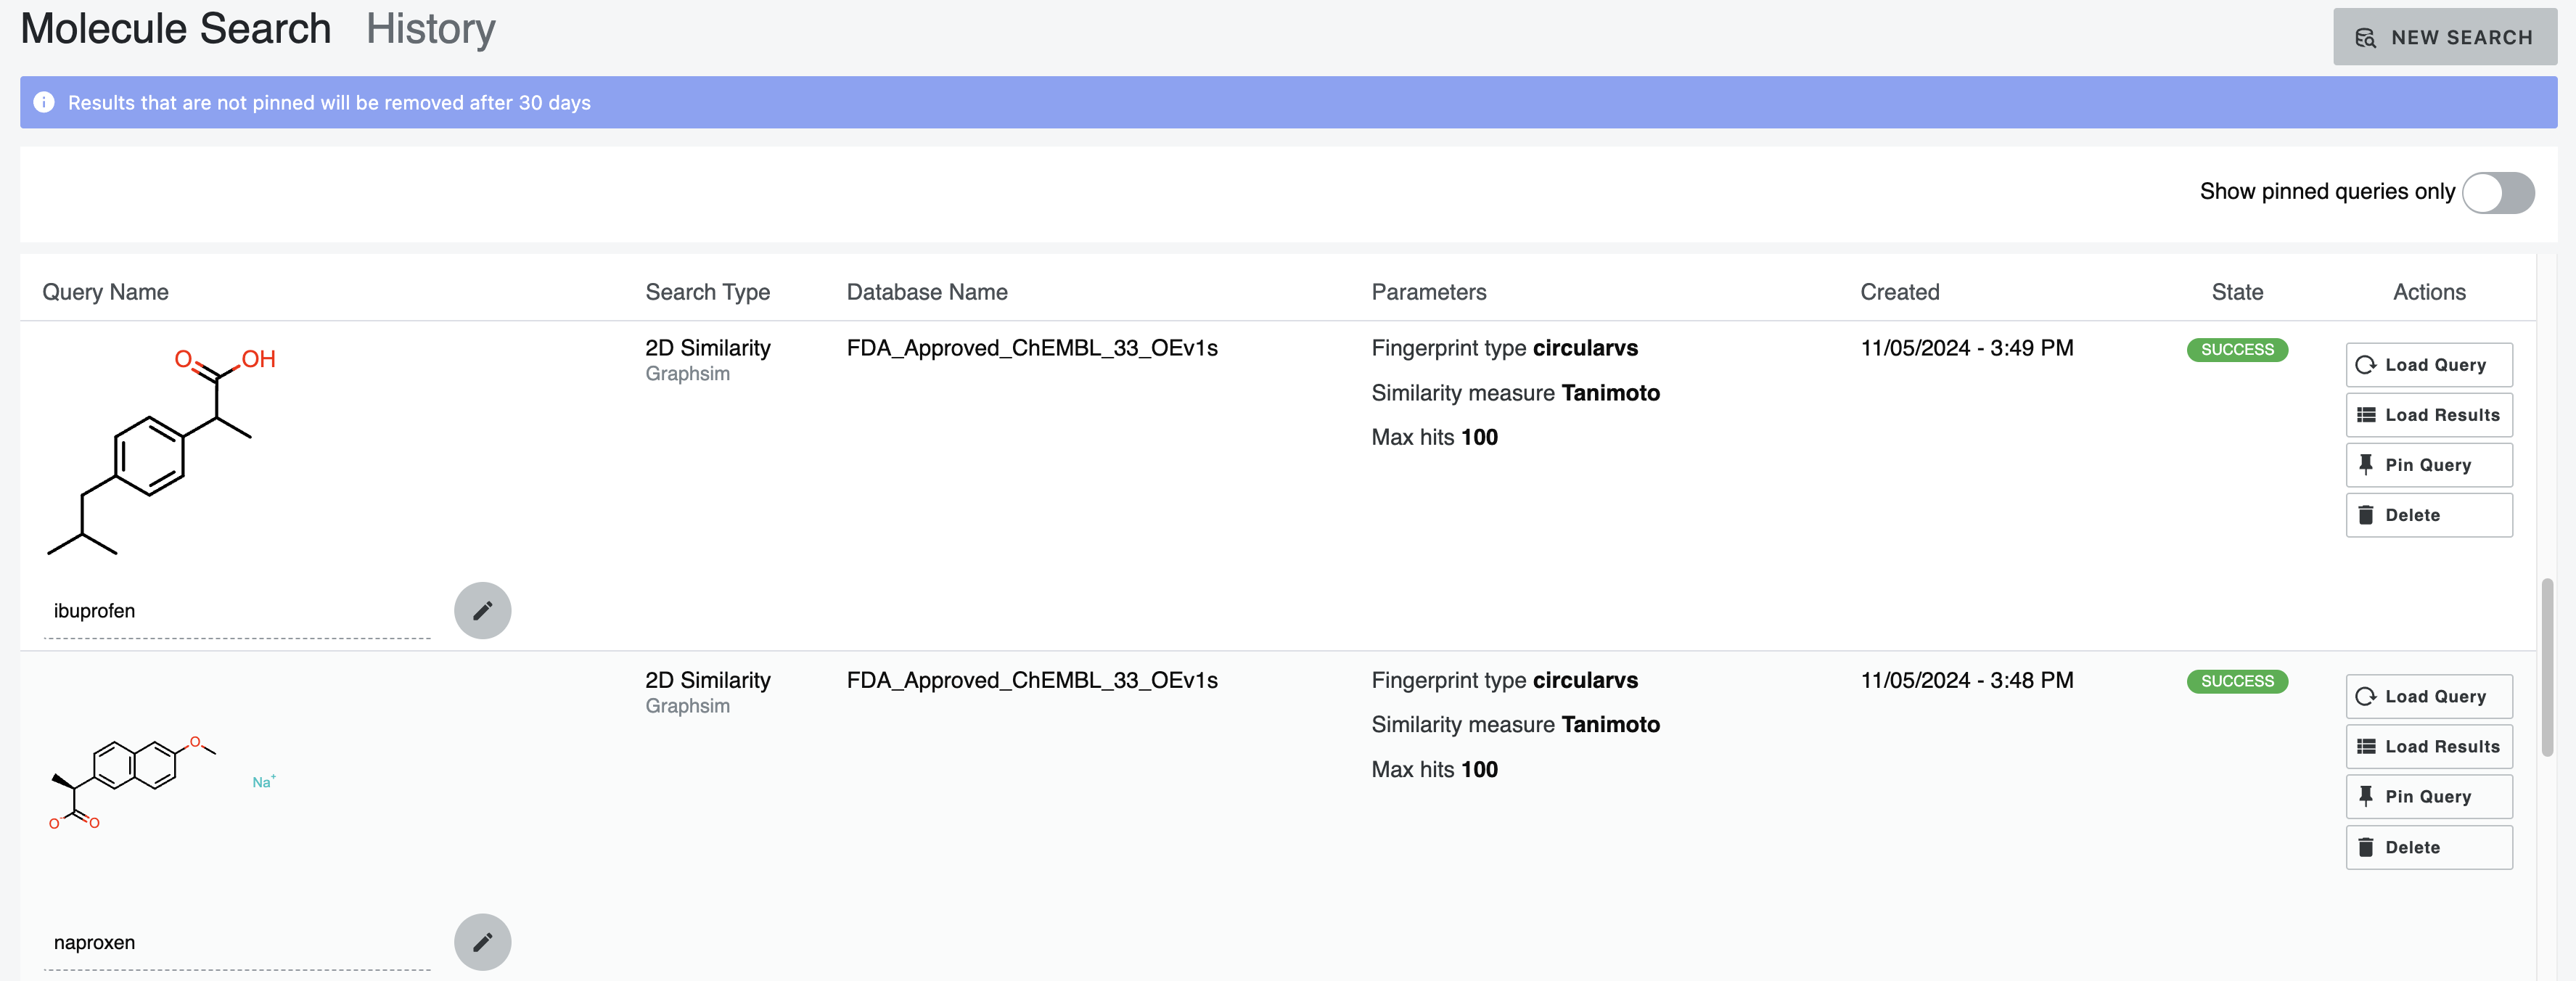
Figure 26. The History tab.
Note
Molecule Search retains the history of your searches automatically. They are cleared after 30 days unless you pin them.
